. 2020 Apr;40(4):720-738.
doi: 10.1177/0271678X19888630. Epub 2019 Nov 13.

RNA sequencing reveals novel macrophage transcriptome favoring neurovascular plasticity after ischemic stroke

Affiliations

RNA sequencing reveals novel macrophage transcriptome favoring neurovascular plasticity after ischemic stroke

Rongrong Wang et al. J Cereb Blood Flow Metab. 2020 Apr.

Abstract

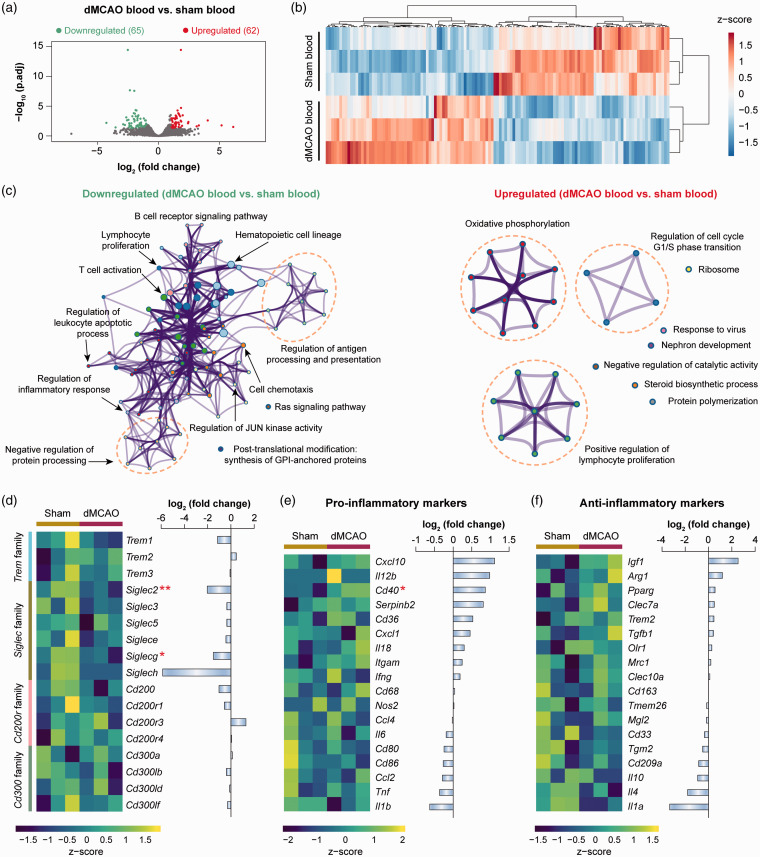
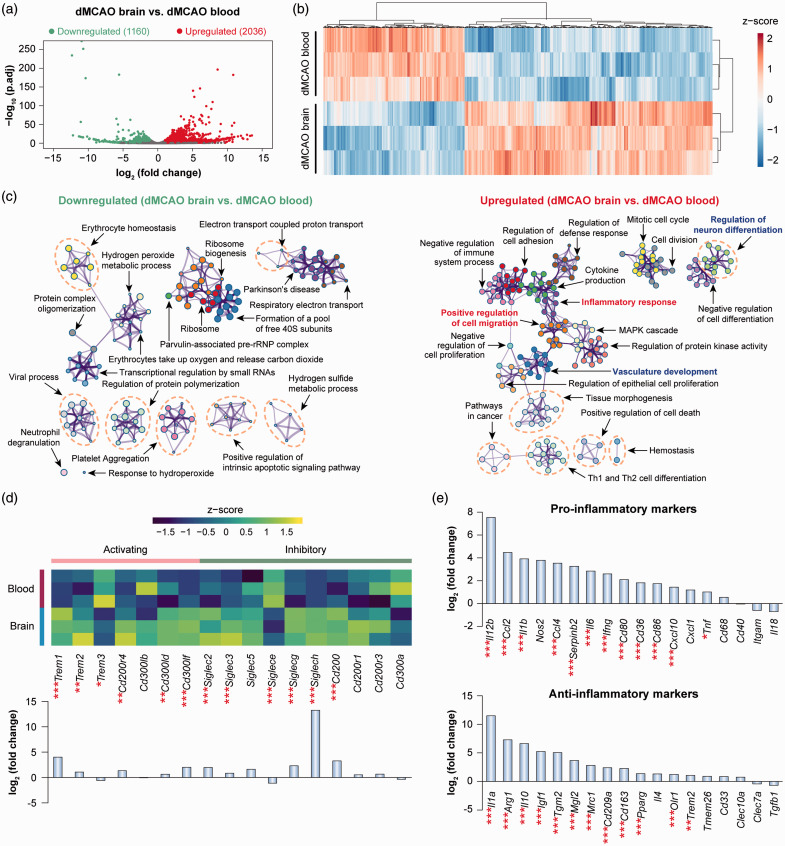
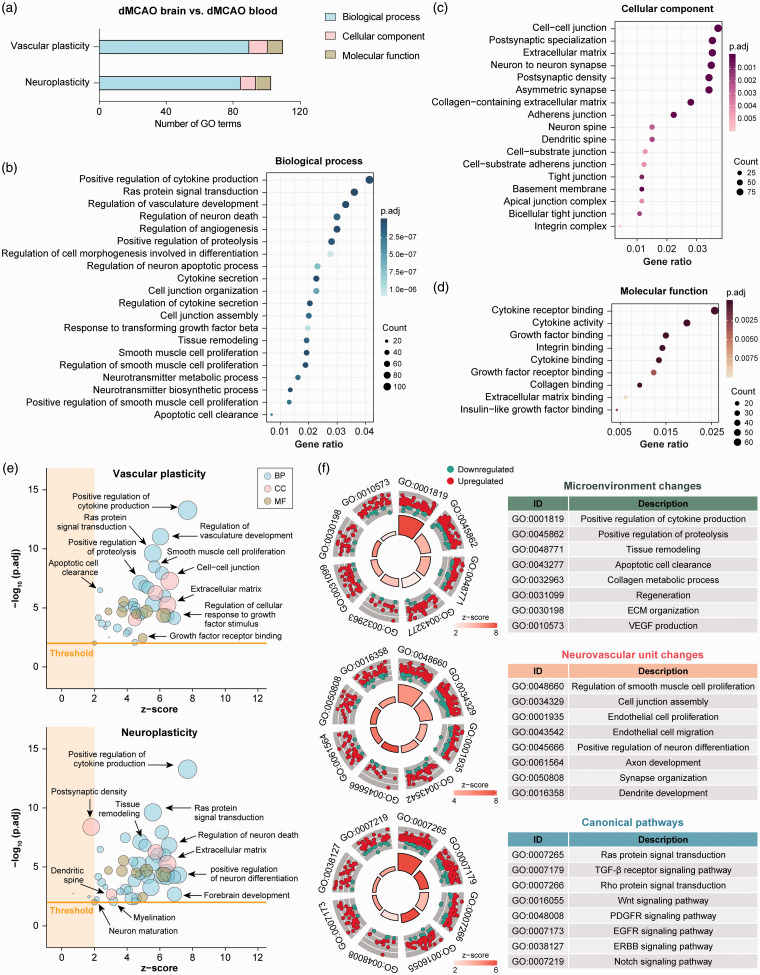
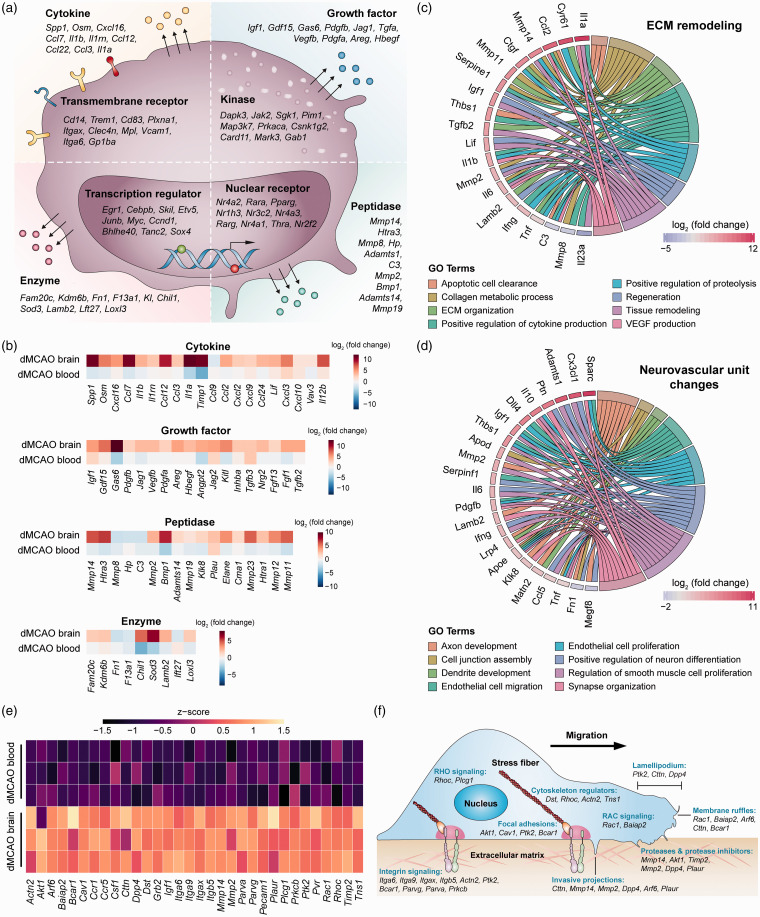
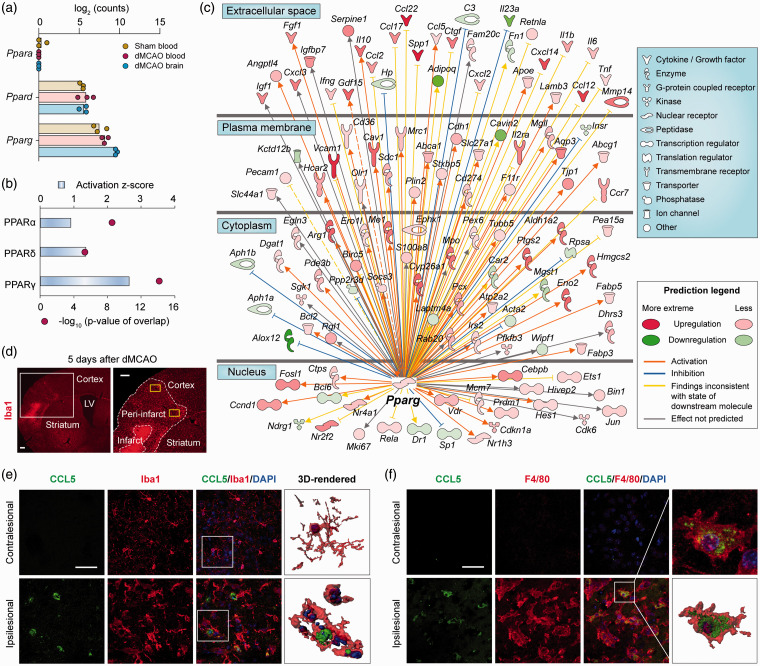
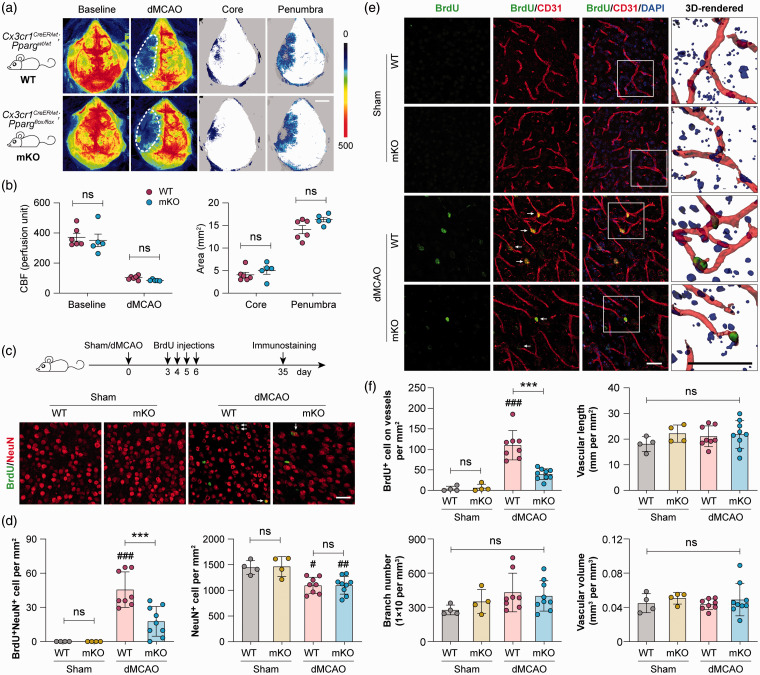
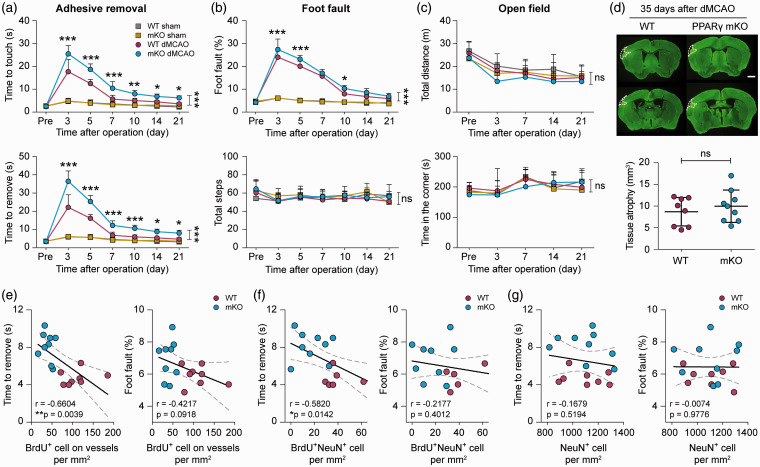
Blood monocytes/macrophages infiltrate the brain after ischemic stroke and critically influence brain injury and regeneration. We investigated stroke-induced transcriptomic changes of monocytes/macrophages by RNA sequencing profiling, using a mouse model of permanent focal cerebral ischemia. Compared to non-ischemic conditions, brain ischemia induced only moderate genomic changes in blood monocytes, but triggered robust genomic reprogramming in monocytes/macrophages invading the brain. Surprisingly, functional enrichment analysis of the transcriptome of brain macrophages revealed significant overrepresentation of biological processes linked to neurovascular remodeling, such as angiogenesis and axonal regeneration, as early as five days after stroke, suggesting a previously underappreciated role for macrophages in initiating post-stroke brain repair. Upstream Regulator analysis predicted peroxisome proliferator-activated receptor gamma (PPARγ) as a master regulator driving the transcriptional reprogramming in post-stroke brain macrophages. Importantly, myeloid cell-specific PPARγ knockout (mKO) mice demonstrated lower post-stroke angiogenesis and neurogenesis than wild-type mice, which correlated significantly with the exacerbation of post-stroke neurological deficits in mKO mice. Collectively, our findings reveal a novel repair-enhancing transcriptome in brain macrophages during post-stroke neurovascular remodeling. As a master switch controlling genomic reprogramming, PPARγ is a rational therapeutic target for promoting and maintaining beneficial macrophage functions, facilitating neurorestoration, and improving long-term functional recovery after ischemic stroke.

Keywords: Angiogenesis; PPARγ; fluorescence-activated cell sorting; focal cerebral ischemia; neurogenesis.


Figures

Figure 1.
Figure 1.
Transcriptome changes of blood monocytes after ischemic stroke. Differential gene analysis was performed on RNA-seq data obtained from blood monocytes at five days after dMCAO or sham operation. (a) Volcano plot showing the differentially expressed genes (DEGs; fold change > 2 or < −2, adjusted p-value < 0.05) in monocytes from dMCAO blood versus sham blood. (b) Heatmap with unsupervised hierarchical clustering showing the expression profile of DEGs in dMCAO blood monocytes compared to sham blood monocytes. Each row represents one sample, and each column represents one DEG. The scaled expression value (column z-score) is displayed in a blue-red color scheme with blue and red indicating low and high expression, respectively. (c) Functional enrichment analysis was performed by Metascape on downregulated (left panel) and upregulated (right panel) DEGs in monocytes from dMCAO blood versus sham blood. The significantly overrepresented (p<0.01) ontology terms were grouped into color-coded clusters based on their membership similarities and rendered as network plots. Each node represents an enriched term, and one representative term is shown for each cluster. Terms with a similarity > 0.3 are connected by edges. The complete enrichment results are provided in Supplementary Table 3. (d) Gene expression profiles of selected families of immunoreceptors containing activating and inhibitory members. Left panel: heatmap containing z-scaled gene expression levels. Each column represents one sample. Right panel: summarized gene expression fold changes in monocytes from dMCAO blood versus sham blood. (e, f) Expression profiles of representative genes that are LPS-inducible (pro-inflammatory markers; e) or IL-4-inducible (anti-inflammatory markers; f). Shown are heatmap containing z-scaled expression levels (left panel) and summarized gene expression fold changes (right panel). * and ** indicate adjusted p-value less than 0.05 and 0.01, respectively. dMCAO: distal middle cerebral artery occlusion.
Figure 2.
Figure 2.
Genomic reprogramming of monocytes/macrophages upon invasion of the post-stroke brain. Differential gene analysis was performed on RNA-seq data obtained from monocytes/macrophages in the blood and brain at five days after dMCAO. (a) Volcano plot showing the DEGs (fold change > 2 or < −2, adjusted p-value < 0.05) in macrophages from dMCAO brain versus dMCAO blood. (b) Heatmap with unsupervised hierarchical clustering showing the expression profile of DEGs in macrophages from dMCAO brain compared to dMCAO blood. Each row represents one sample, and each column represents one DEG. The scaled expression value (column z-score) is displayed in a blue-red color scheme. (c) Functional enrichment analysis was performed by Metascape on downregulated (left panel) and upregulated (right panel) DEGs in macrophages from dMCAO brain versus dMCAO blood. The significantly overrepresented (p<0.01) ontology terms were grouped into color-coded clusters based on their membership similarities and rendered as network plots. Shown are the top 20 clusters according to p-values from smallest to largest. The complete enrichment results are provided in Supplementary Table 4. (d) Gene expression profiles of selected families of immunoreceptors containing activating and inhibitory members. Shown are heatmap containing z-scaled gene expression levels (upper panel) and summarized gene expression fold changes in cells from dMCAO brain versus dMCAO blood (lower panel). (e) Expression profiles of representative genes that are LPS-inducible (pro-inflammatory markers) or IL-4-inducible (anti-inflammatory markers). Data are expressed as fold changes in cells from dMCAO brain versus dMCAO blood. *, **, and *** indicate adjusted p-value less than 0.05, 0.01, and 0.001, respectively. dMCAO: distal middle cerebral artery occlusion.
Figure 3.
Figure 3.
Transcriptome analysis of macrophages in the post-stroke brain implicates promotion of neurovascular plasticity. Functional enrichment analysis was performed on DEGs in monocytes/macrophages from the dMCAO brain versus dMCAO blood by the R package clusterProfiler. (a) the numbers of significantly overrepresented (adjusted p-value < 0.01) gene ontology (GO) terms in the three categories related to vascular plasticity and neuroplasticity: Biological process (BP), cellular component (CC), and molecular function (MF). (b–d) The top 20 enriched BP (b), CC (c) and MF (d) terms according to the adjusted p-values from smallest to largest. The full list of GO terms is provided in Supplementary Tables 5 and 6. Terms are arranged by the numbers of genes under each term (count). (e) Enriched GO terms related to vascular plasticity or neuroplasticity were filtered according to their gene membership similarities, to reduce the number of redundant terms. Terms with similarity < 0.8 were presented as bubble plots, where the sizes of the bubbles reflect the number of genes under each term. The threshold was set at z-score >2 and adjusted p-value < 0.01. (f) Enriched biological processes were further classified into three clusters: (1) Functions related to microenvironment and extracellular (ECM) changes (upper panel); (2) functions related to changes in the neurovascular unit (middle panel); and (3) canonical pathways (lower panel). Shown are the circular visualizations of eight representative biological processes in each cluster. The DEGs under each biological process were shown as dots which were color-coded according to their direction of change. dMCAO: distal middle cerebral artery occlusion.
Figure 4.
Figure 4.
Gene-level characterization of macrophage transcriptome changes favoring neurovascular plasticity in the post-stroke brain. DEGs in macrophages from the dMCAO brain versus dMCAO blood were analyzed for their potential influence on post-stroke neurovascular plasticity. (a) DEGs related to neurovascular plasticity were manually annotated according to the type and subcellular localization of gene products. The top 10 genes were shown under each category according to the adjusted p-value, from lowest to highest. The complete gene list is provided in Supplementary Table 8. (b) Heatmaps showing the expression profiles of four clusters of genes whose products are in the extracellular space. Data were expressed as log2 transformation of fold changes in dMCAO brain versus dMCAO blood (first row), and dMCAO blood versus sham blood (second row). (c, d) Genes related to ECM remodeling (c) and neurovascular unit changes (d) were explored for their association with eight functional subcategories. Shown are genes associated with at least two subcategories, displayed as Circos plots. (e) Heatmap of the expression profile of 32 DEGs related to cell movement, cell–cell adhesion, and monocyte–vessel interactions, which were upregulated in macrophages in the dMCAO brain compared to those in the dMCAO blood. (f) The DEGs were manually annotated to functional categories of cell movement and cell–cell interactions. ECM: extracellular matrix; dMCAO: distal middle cerebral artery occlusion.
Figure 5.
Figure 5.
PPARγ is predicted to regulate the genomic reprogramming of monocytes/macrophages after ischemic stroke. (a) RNA-seq expression profiles of the PPAR family genes Ppara, Ppard and Pparg in monocytes/macrophages from sham blood, dMCAO blood, and dMCAO brain groups. n=3 biological replicates per group. (b, c) Upstream regulator analyses were performed by Ingenuity Pathway Analysis (IPA) on all DEGs in macrophages from dMCAO brain versus dMCAO blood. (b) The activation z-score and p-value of overlap were calculated for each PPAR as a potential upstream regulator. The cutoff values for predicated activation were z-score > 2 and p-value < 0.01. (c) DEGs that are regulated by Pparg are shown in a network view, with annotations on the subcellular localization and types of their products. (d–f) The expression of CCL5 was examined by immunofluorescence staining at five days after dMCAO in the ipsilesional peri-infarct area and the corresponding region in the non-injured contralateral hemisphere. (d) Representative images demonstrate the peri-infarct area defined by Iba1 (red) immunostaining. Yellow rectangles illustrate the regions where images in (e) and (f) were captured. Scale bars: 50 µm. (e, f) Double-label immunostaining of CCL5 with Iba1 (e) or F4/80 (f). Nuclei were counterstained with DAPI. Squares illustrate the regions that were enlarged and 3D-rendered in the fourth column. Scale bars: 50 µm. Robust CCL5 immunosignal was detected in Iba1+ or F4/80+ cells in the ipsilesional cortex, which was absent in the contralesional side. dMCAO: distal middle cerebral artery occlusion; LV: lateral ventricle.
Figure 6.
Figure 6.
Selective deletion of PPARγ in myeloid-lineage cells impairs neurovascular plasticity after ischemic stroke. Focal cerebral ischemia was induced in myeloid cell-specific PPARγ knockout (PPARγ mKO) mice and wild-type (WT) control mice by dMCAO. (a) Two-dimensional laser speckle images showing cortical cerebral blood flow (CBF) before (baseline) and 30 min after dMCAO. Ischemic core (areas with CBF reduction of >70% of baseline) and penumbra (areas with CBF reduction of 50–70% of baseline) were illustrated by blue dots. Scale bar: 3 mm. (b) Summarized CBF data showing that PPARγ mKO did not significantly alter CBF changes during dMCAO. n= 5–6 mice per group. ns: no significant difference. (c–f) WT and PPARγ mKO mice received BrdU injections at 3–6 days after dMCAO or sham operation to label newly proliferated cells. Neurogenesis and angiogenesis were examined at 35 days after dMCAO. (c) Double-label immunofluorescence of BrdU and the neuronal marker NeuN in the peri-infarct cortex. Arrow: BrdU and NeuN double-positive cell. Scale bar: 50 µm. (d) The numbers of BrdU and NeuN double-positive cells (left panel) and total NeuN-positive cells (right panel) were counted. (e) Double-label immunofluorescence of BrdU and the endothelial marker CD31 in the peri-infarct cortex. Nuclei were counterstained with DAPI. Arrow: BrdU-positive cell on CD31-positive vessels. Squares indicate the regions that were enlarged and 3D-rendered in the fourth column, Scale bars: 50 µm. (f) Summarized data on the numbers of BrdU-positive cells on vessels and vascular branch numbers, lengths and volumes. n=6 mice per sham group. n=8–9 mice per dMCAO group. #p<0.05, ##p<0.01, ###p<0.001 dMCAO vs. sham. ***p<0.001 mKO dMCAO vs. WT dMCAO. dMCAO: distal middle cerebral artery occlusion; ns: no significant difference.
Figure 7.
Figure 7.
Deficient neurovascular plasticity is associated with poor functional recovery in PPARγ mKO mice after ischemic stroke. PPARγ mKO mice and WT control mice were subjected to dMCAO or sham operation. (a–c) Neurological functions were assessed before (pre) and up to 21 days after dMCAO or sham operation, with a battery of behavior tests. (a) Forepaw sensitivity and motor impairments were assessed by the adhesive removal test. Shown are the time the mouse spent to touch the adhesive tape (upper panel) and completely remove the tape (lower panel). (b) Sensorimotor coordination was assessed by the foot fault test. Foot faults were expressed as percentages of total steps (upper panel). The numbers of total steps (lower panel) were comparable among the four groups, indicating similar gross locomotor functions in all mice. (c) General locomotor activity and anxiety-like behavior were assessed by the open field test. Shown are the total distances the mouse traveled (upper panel) and the time the mouse spent in the corner zones (lower panel). (d) Chronic tissue atrophy was assessed at 35 days after dMCAO on MAP2-immunostained coronal brain sections. Representative images of MAP2 immunofluorescence (green) are shown with cortical tissue atrophy demarcated by dashed lines in the left hemisphere. Scale bar: 1 mm. The volumes of tissue atrophy were not different between WT and PPARγ mKO mice. n=6 mice per sham group. n=8–9 mice per dMCAO group. *p<0.05, **p<0.01, ***p<0.001 mKO dMCAO vs. WT dMCAO by one-way ANOVA (individual time point) or two-way repeated measures ANOVA (bracket). (e–g) Pearson correlation between the animals’ performance in the adhesive removal test (time to remove; left panel) and foot fault test (percentage of foot fault; right panel) at 21 days after dMCAO and the number of BrdU-positive cells on vessels (e), BrdU and NeuN double-positive cells (f), and total NeuN-positive cells (g) at 35 days after dMCAO in WT and PPARγ mKO mice. Dashed lines: 95% confidence intervals. n=8 and 9 mice for WT and PPARγ mKO groups, respectively. *p<0.05, **p<0.01. dMCAO: distal middle cerebral artery occlusion; ns: no significant difference.

References

    1. Prinz M, Erny D, Hagemeyer N.Ontogeny and homeostasis of CNS myeloid cells. Nat Immunol 2017; 18: 385–392. - PubMed
    1. Jiang X, Andjelkovic AV, Zhu L, et al.. Blood-brain barrier dysfunction and recovery after ischemic stroke. Prog Neurobiol 2018; 163-164: 144–171. - PMC - PubMed
    1. An C, Shi Y, Li P, et al.. Molecular dialogs between the ischemic brain and the peripheral immune system: dualistic roles in injury and repair. Prog Neurobiol 2014; 115: 6–24. - PMC - PubMed
    1. Planas AM.Role of immune cells migrating to the ischemic brain. Stroke 2018; 49: 2261–2267. - PubMed
    1. Hu X, Leak RK, Shi Y, et al.. Microglial and macrophage polarization-new prospects for brain repair. Nat Rev Neurol 2015; 11: 56–64. - PMC - PubMed

Publication types