. 2020 Nov;40(11):2225-2239.
doi: 10.1177/0271678X19887777. Epub 2019 Nov 13.

The mitochondrial calcium uniporter is crucial for the generation of fast cortical network rhythms

Affiliations

The mitochondrial calcium uniporter is crucial for the generation of fast cortical network rhythms

Carlos Bas-Orth et al. J Cereb Blood Flow Metab. 2020 Nov.

Abstract

The role of the mitochondrial calcium uniporter (MCU) gene (Mcu) in cellular energy homeostasis and generation of electrical brain rhythms is widely unknown. We investigated this issue in mice and rats using Mcu-knockout and -knockdown strategies in vivo and in situ and determined the effects of these genetic manipulations on hippocampal gamma oscillations (30-70 Hz) and sharp wave-ripples. These physiological network states require precise neurotransmission between pyramidal cells and inhibitory interneurons, support spike-timing and synaptic plasticity and are associated with perception, attention and memory. Absence of the MCU resulted in (i) gamma oscillations with decreased power (by >40%) and lower synchrony, including less precise neural action potential generation ('spiking'), (ii) sharp waves with decreased incidence (by about 22%) and decreased fast ripple frequency (by about 3%) and (iii) lack of activity-dependent pyruvate dehydrogenase dephosphorylation. However, compensatory adaptation in gene expression related to mitochondrial function and glucose metabolism was not detected. These data suggest that the neuronal MCU is crucial for the generation of network rhythms, most likely by influences on oxidative phosphorylation and perhaps by controlling cytoplasmic Ca2+ homeostasis. This work contributes to an increased understanding of mitochondrial Ca2+ uptake in cortical information processing underlying cognition and behaviour.

Keywords: Calcium signalling; electrophysiology; mitochondria; neurometabolic coupling; neuronal activity.


Conflict of interest statement

The author(s) declared no potential conflicts of interest with respect to the research, authorship, and/or publication of this article.

Figures

Figure 1.
Figure 1.
Cytoarchitecture of the hippocampus in wild type (WT) and Mcu-KO (KO) mice. (a) Acute hippocampal slices were stained with toluidine blue (TB) in WT and KO mice. (b) The CA3 region is shown at higher magnification. Note that the cytoarchitecture of the hippocampus is well preserved. The extracellular local field potential electrode was positioned in stratum pyramidale (strongly stained layer with densely packed neuronal somas; black arrows). (c) Immunoblot analysis of microdissected hippocampal CA3 region confirms lack of MCU protein expression in Mcu/Cre+ mice. Blots have been cropped for conciseness. (d) Quantification of immunoblot experiments. Round symbols represent individual animals, bars represent mean, error bars indicate standard deviation. P-values are indicated in the graph and were determined by one-way ANOVA followed by Tukey’s multiple comparisons test. (e) Scheme of the experimental design in mice. WT (Wt/Cre+) and Mcu-KO (Mcu/Cre+) littermates were used in each experiment. Acute (ex vivo) hippocampal slices were used for electrophysiological local field potential (LFP) recordings, immunostaining or qPCR arrays to obtain various readouts. The experimental design for WT and Mcu-KD slice cultures of the rat was similar.
Figure 2.
Figure 2.
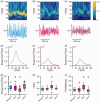
Gamma oscillations in mouse acute slices. Persistent gamma oscillations were recorded in stratum pyramidale of the CA3 region in acute hippocampal slices of the mouse. (a) Sample traces of local field potential recordings and corresponding wavelet transform of gamma oscillations in wild type (blue trace) and Mcu-KO (magenta trace) mice. (b) Sample power spectra of gamma oscillations calculated from 5 min intervals in slices from wild type (blue) and Mcu-KO (magenta) mice. Power spectra in (b) correspond to gamma oscillations in (a). Gamma oscillations in hippocampal slices from wild type (WT) (n = 23, N = 6) and Mcu-KO (n = 20, N = 6) mice were analysed for (c) the peak of the power spectrum (Power), (d) the peak frequency (f) and (e) the full width at half maximum (FWHM). Mann–Whitney rank sum test was applied for statistical analysis and Shapiro–Wilk test for normality. Statistical significance is marked by asterisks (P < 0.05).
Figure 3.
Figure 3.
Gamma oscillations in rat slice cultures. Persistent gamma oscillations were recorded in stratum pyramidale of the CA3 region in hippocampal slice cultures of the rat. (a–c) Sample traces of local field potential recordings and corresponding wavelet transform of gamma oscillations in control (a, ShLacZ) and Mcu-knockdown (KD) slice cultures (b, Sh1; c, Sh2). (d–f) Sample power spectra of gamma oscillations calculated from 5 min intervals in control (d) and KD slice cultures (e, Sh1; f, Sh2). Gamma oscillations in control (ShLacZ, n = 26, N = 6) and KD slice cultures (Sh1, n = 25, N = 7; Sh2, n = 15, N = 4; Sh3, n = 25, N = 8) were analysed for (g) the peak of the power spectrum (Power), (h) the peak frequency (f) and (i) the full width at half maximum (FWHM) of the gamma power. (g–i) Mann–Whitney rank sum test was applied for statistical analysis and Shapiro–Wilk test for normality. Statistical significance is marked by asterisks (P < 0.05).
Figure 4.
Figure 4.
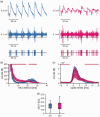
Spiking synchronization during gamma oscillations in mouse acute slices. Persistent gamma oscillations were recorded in stratum pyramidale of the CA3 region in acute hippocampal slices of the mouse. (a) Sample traces of the local field potential (top), with 700 Hz high-pass filter (middle) and extracted multi-unit (‘spiking') activity (bottom) during gamma oscillations in slices from wild type (blue traces) and Mcu-KO (magenta traces) mice. (b) Distribution of multi-unit intervals calculated from 5 min intervals in wild type (blue, 58,380 ± 3930 events, n = 23, N = 6) and Mcu-KO (magenta, 61,500 ± 7710 events, n = 20, N = 6) mice. Red dots denote significant differences. Note that the second peak of multi-unit intervals at 20–30 ms is absent in Mcu-KO (magenta). (c) Distributions of the timing of multi-unit activity relative to the negative peak of the gamma-band cycle (0 ms). Red dots denote significant differences. Note that the timing of multi-unit activity is less precise in Mcu-KO mice. (d) Frequency of multi-unit activity in wild type (WT) and Mcu-KO mice. Mann–Whitney rank sum test (b, c) and Student’s t-test (d) were applied for statistical analysis and Shapiro–Wilk test for normality. Statistical significance (P < 0.05).
Figure 5.
Figure 5.
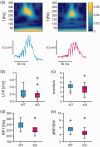
Sharp wave-ripples in mouse acute slices. Spontaneously occurring, recurrent sharp wave-ripples were recorded for 5 min in stratum pyramidale of the CA3 region in acute hippocampal slices of the mouse. (a) Sample traces of local field potential recordings and corresponding wavelet transform of single sharp wave-ripples in wild type (blue trace) and Mcu-KO (magenta trace) mice. Sharp wave-ripples in wild type (WT) (922 ± 183 events, n = 17, N = 6) and Mcu-KO (717 ± 283 events, n = 16, N = 5) mice were analysed for (b) amplitude of the sharp wave (local field potential [LFP]) and (c) incidence (events/s) of sharp waves as well as (d) the frequency of ripples (RP f) and (e) the number of ripples per sharp wave (#RP/SW). Mann–Whitney rank sum test and t-test were applied for statistical analysis and Shapiro–Wilk test for normality. Statistical significance is marked by asterisks (P < 0.05).
Figure 6.
Figure 6.
Gamma oscillation-mediated dephosphorylation of PDH in mouse acute slices. (a) Immunofluorescence labelling of acute mouse hippocampal slices. Anti-phospho PDH labelling, anti-total PDH labelling, and a pPDH/PDH ratio image are shown for a control slice (CTL) and for a slice that underwent 40 min of gamma oscillations (GAM). Both slices are from the same wild type mouse. Scale bars represent 20 µm. (b) Quantification of pPDH/PDH ratio in control slices (CTL) and slices that underwent 40 min of gamma oscillations (GAM). Slices from three animals were analysed for both conditions in each genotype. Round symbols represent individual animals; bars represent mean ratio. Values were normalized to average ratio in wild type control slices. (c) Quantification of gamma oscillation-mediated PDH dephosphorylation in wild type and Mcu-KO acute slices. Round symbols represent individual animals, horizontal lines represent mean difference between control and gamma oscillations, error bars indicate 95% CI. P value was determined by unpaired two-tailed Student’s t-test.
Figure 7.
Figure 7.
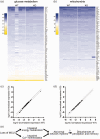
Expression of genes related to glucose metabolism and mitochondria in the mouse hippocampal region CA3 and summary scheme. (a, b) Heatmaps illustrating the results of RT2 Profiler PCR Array gene expression analyses of glucose metabolism-related (a) and mitochondria-related (b) genes. N = 5 mice per genotype. Colour scale represents log10 of normalized expression (2−dCT). (c, d) Comparison of average expression per gene in wild type versus Mcu-KO mice for glucose metabolism-related (c) and mitochondria-related (d) genes. Dotted lines indicate 2-fold up- or down-regulation. (e) Summary of the main findings and potential pathophysiological mechanisms triggered by loss of the neuronal MCU. The relative contributions of impaired oxidative energy metabolism and impaired intracellular Ca2+ homeostasis to different abnormal neuronal network rhythms as well as the disturbances of higher brain functions need to be investigated in future studies. For details, see main text.

References

    1. Kann O, Kovács R.Mitochondria and neuronal activity. Am J Physiol Cell Physiol 2007; 292: C641–C657. - PubMed
    1. Llorente-Folch I, Rueda CB, Pardo B, et al.. The regulation of neuronal mitochondrial metabolism by calcium. J Physiol 2015; 593: 3447–3462. - PMC - PubMed
    1. Kannurpatti SS, Sanganahalli BG, Herman P, et al.. Role of mitochondrial calcium uptake homeostasis in resting state fMRI brain networks. NMR Biomed 2015; 28: 1579–1588. - PMC - PubMed
    1. Billups B, Forsythe ID.Presynaptic mitochondrial calcium sequestration influences transmission at mammalian central synapses. J Neurosci 2002; 22: 5840–5847. - PMC - PubMed
    1. Bindokas VP, Lee CC, Colmers WF, et al.. Changes in mitochondrial function resulting from synaptic activity in the rat hippocampal slice. J Neurosci 1998; 18: 4570–4587. - PMC - PubMed

Publication types

MeSH terms

LinkOut - more resources