. 2019 Nov 13;23(1):355.
doi: 10.1186/s13054-019-2628-x.

Myeloid-derived suppressor cell function and epigenetic expression evolves over time after surgical sepsis

Affiliations

Myeloid-derived suppressor cell function and epigenetic expression evolves over time after surgical sepsis

McKenzie K Hollen et al. Crit Care. .

Abstract

Background: Sepsis is an increasingly significant challenge throughout the world as one of the major causes of patient morbidity and mortality. Central to the host immunologic response to sepsis is the increase in circulating myeloid-derived suppressor cells (MDSCs), which have been demonstrated to be present and independently associated with poor long-term clinical outcomes. MDSCs are plastic cells and potentially modifiable, particularly through epigenetic interventions. The objective of this study was to determine how the suppressive phenotype of MDSCs evolves after sepsis in surgical ICU patients, as well as to identify epigenetic differences in MDSCs that may explain these changes.

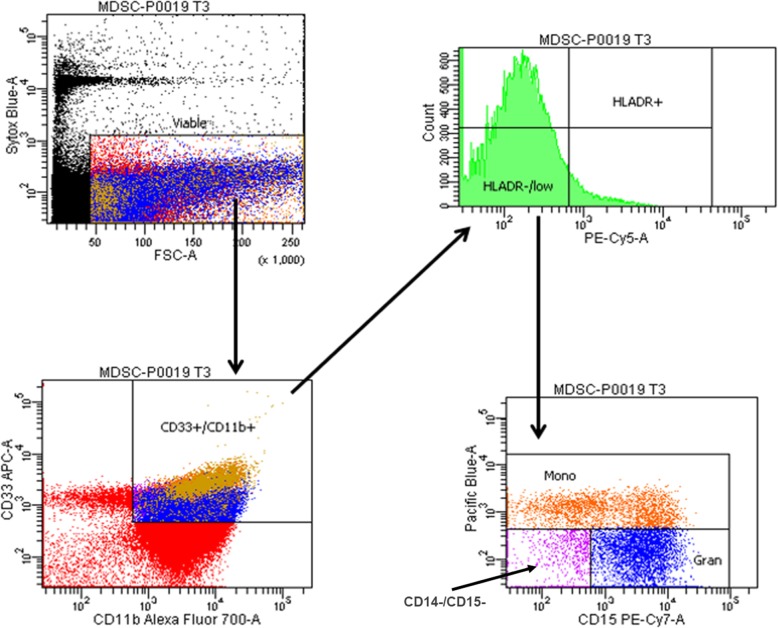
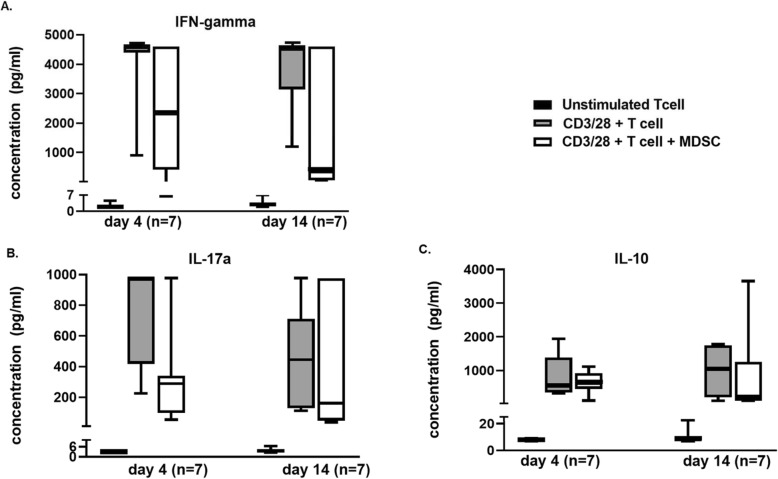
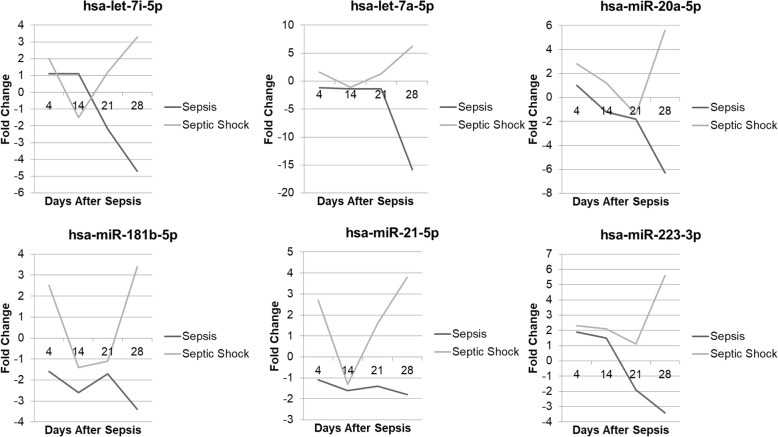
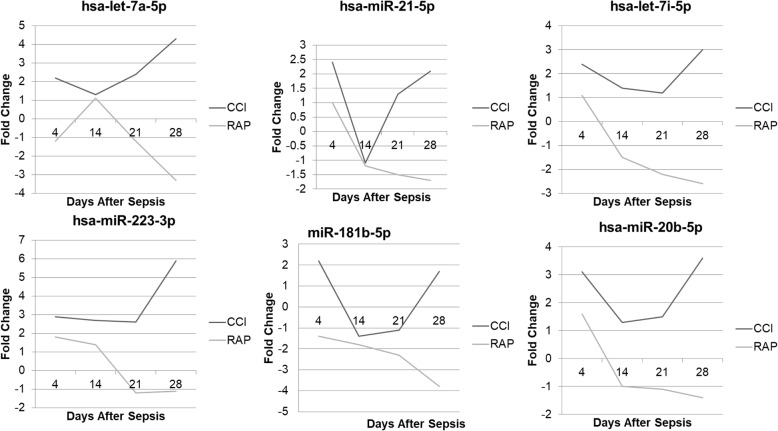
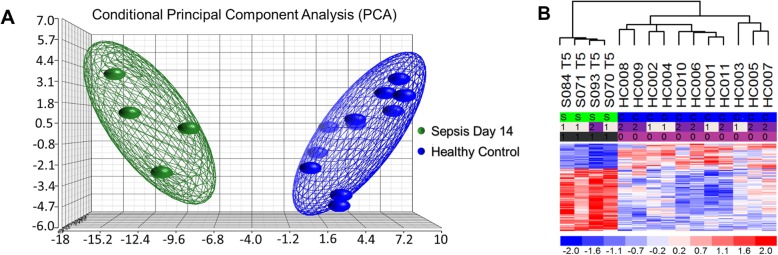
Methods: Circulating MDSCs from 267 survivors of surgical sepsis were phenotyped at various intervals over 6 weeks, and highly enriched MDSCs from 23 of these samples were co-cultured with CD3/CD28-stimulated autologous T cells. microRNA expression from enriched MDSCs was also identified.

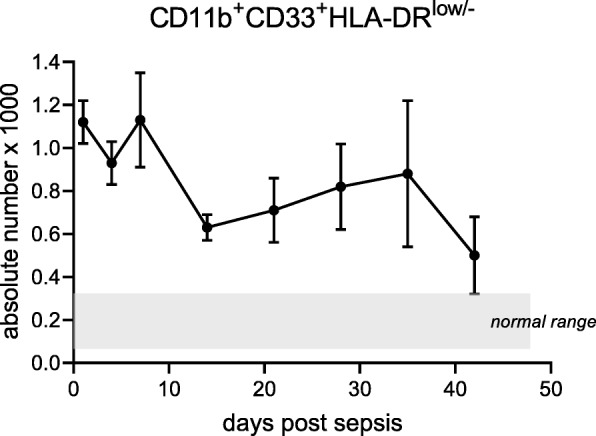
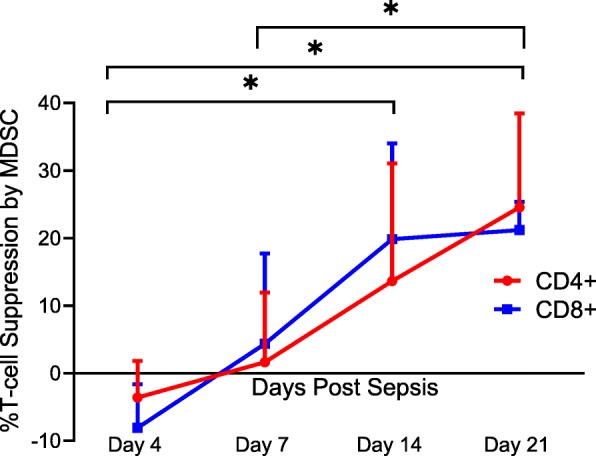
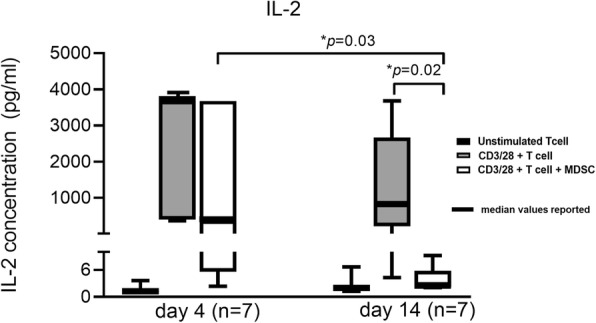
Results: We observed that MDSC numbers remain significantly elevated in hospitalized sepsis survivors for at least 6 weeks after their infection. However, only MDSCs obtained at and beyond 14 days post-sepsis significantly suppressed T lymphocyte proliferation and IL-2 production. These same MDSCs displayed unique epigenetic (miRNA) expression patterns compared to earlier time points.

Conclusions: We conclude that in sepsis survivors, immature myeloid cell numbers are increased but the immune suppressive function specific to MDSCs develops over time, and this is associated with a specific epigenome. These findings may explain the chronic and persistent immune suppression seen in these subjects.

Trial registration: ClinicalTrials.gov NCT02276417.

Keywords: Epigenetics; Human; Immunosuppression; Myeloid-derived suppressor cells; Sepsis; Surgery; miRNA.


Conflict of interest statement

The authors declare that they have no competing interests.

Figures

Fig. 1
Fig. 1
Phenotypic classification of MDSCs. Gating strategy used to classify CD33+CD11b+HLA-DR−/low MDSC populations in the human whole blood using samples stained according to the protocol and analyzed on the LSR II flow cytometer. Monocytic MDSC subpopulations were further characterized as CD14+ and granulocytic MDSCs as CD14CD15+
Fig. 2
Fig. 2
Absolute counts of circulating myeloid-derived suppressors in acute and chronic sepsis. Cells with the surface markers CD33+CD11b+HLA-DR−/low were identified on the flow cytometer, and absolute counts ([total white blood cell count (cells/ml) × percent CD33+CD11b+HLA-DRlow/−]/100) were determined for septic patients. The mean values of absolute counts are reported for patients at various time points beginning 24 h (n = 241) after the initial infectious onset and on days 4 (n = 211), 7 (n = 166), 14 (n = 100), 21 (n = 59), 28 (n = 38), 36 (n = 28), and 42 (n = 18) in patients meeting the Sepsis-3 criteria
Fig. 3
Fig. 3
Percent T lymphocyte suppression by MDSCs. Immature myeloid cells with the surface markers CD33+CD11b+HLA-DR−/low were isolated on days 4, 7, 14, and 21 after sepsis. Autologous T lymphocytes were stimulated with soluble anti-CD3/28 and seeded in a co-culture with MDSCs in a 1:1 ratio. T cells were labeled with CellTrace Violet to detect for proliferation, and a proliferation index (PI) was calculated for both CD4+ and CD8+ T cells using flow cytometric analysis. Percent suppression was calculated as the ratio of PIs from stimulated T cells in the presence of MDSCs and the PI of stimulated T cells in culture medium alone. Percent suppression for both CD4+ and CD8+ T cells was significantly different between day 4 vs 14 (p = 0.0402 and 0.0012), day 4 vs 21 (p = 0.0225 and < 0.0001), and day 7 vs 21 (p = 0.037 and 0.045). There was no significance noted of percent suppression of CD4+ and CD8+ T cells between days 7 and 14 (p = 0.17 and 0.08)
Fig. 4
Fig. 4
IL-2 concentration in functional T cell proliferation and suppression assay supernatants. After 4 days of cell culture in the following groups: (1) unstimulated T cells in culture medium, (2) CD3/28-stimulated T cells in culture medium, and (3) CD3/28-stimulated T cells in the presence of culture medium and MDSCs (1:1), supernatant was collected for quantification of IL-2 concentration (pg/ml) in septic patients from days 4 (n = 7) and 14 (n = 7). Concentration levels of IL-2 were significantly different (p = 0.03) between stimulated T cells at days 4 and 14 and between stimulated T cells and stimulated T cells + MDSCs at day 14 (p = 0.02)
Fig. 5
Fig. 5
Cytokine concentrations in functional T cell proliferation and suppression assays. After 4 days of cell culture in the following groups: (1) unstimulated T cells in culture medium, (2) CD3/28-stimulated T cells in culture medium, and (3) CD3/28-stimulated T cells in the presence of culture medium and MDSCs (1:1), supernatant was collected for quantification of interferon-γ (a), interleukin-17α (b), and interleukin-10 (c) concentration (pg/ml) in septic patients from days 4 (n = 7) and 14 (n = 7). No significant differences were found
Fig. 6
Fig. 6
A comparison of miRNA expression patterns between patients with septic shock vs sepsis. MDSCs from patients with septic shock had significantly different miRNA expression patterns (fold change difference ≥ 2) as compared to patients with sepsis at or beyond day 14 following sepsis
Fig. 7
Fig. 7
A comparison of miR expression patterns between patients with CCI vs RAP after surgical sepsis. MDSCs from patients with CCI had significantly different miR expression patterns (fold change difference ≥ 2) as compared to patients who rapidly recovered from sepsis at or beyond day 14 following sepsis
Fig. 8
Fig. 8
Microarray transcriptomic analysis of MDSCs from patients 14 days after sepsis and healthy control subjects. The genomic response of isolated MDSC RNA in healthy controls and septic patients 14 days after initial infectious onset. a Conditional principal component analysis of septic (day 14) and healthy control myeloid-derived suppressor cell gene expression patterns. b Heat map of the hierarchical clustering of MDSC gene expression patterns and variation between septic patients from day 14 and healthy control subjects

References

    1. Mares CA, Sharma J, Ojeda SS, Li Q, Campos JA, Morris EG, et al. Attenuated response of aged mice to respiratory Francisella novicida is characterized by reduced cell death and absence of subsequent hypercytokinemia. PLoS One. 2010;5(11):e14088. doi: 10.1371/journal.pone.0014088. - DOI - PMC - PubMed
    1. Singer M, Deutschman CS, Seymour CW, Shankar-Hari M, Annane D, Bauer M, et al. The Third International Consensus Definitions for Sepsis and Septic Shock (Sepsis-3) JAMA. 2016;315(8):801–810. doi: 10.1001/jama.2016.0287. - DOI - PMC - PubMed
    1. Plevin R, Callcut R. Update in sepsis guidelines: what is really new? Trauma Surg Acute Care Open. 2017;2(1):e000088. doi: 10.1136/tsaco-2017-000088. - DOI - PMC - PubMed
    1. National Inpatient Hospital Costs. The most expensive conditions by payer, 2013: Agency for Healthcare Research and Quality; 2016. Available from: https://www.hcup-us.ahrq.gov/reports/statbriefs/sb204-Most-Expensive-Hos.... Accessed May 2019. - PubMed
    1. Seventieth World Health Assembly update, 26 May 2017 [press release]. World Health Organization, May 26, 2017 2017.

Publication types

Associated data