. 2019 Nov 13;11(1):90.
doi: 10.1186/s13195-019-0542-8.

Retinal thinning of inner sub-layers is associated with cortical atrophy in a mouse model of Alzheimer's disease: a longitudinal multimodal in vivo study

Affiliations

Retinal thinning of inner sub-layers is associated with cortical atrophy in a mouse model of Alzheimer's disease: a longitudinal multimodal in vivo study

Samuel Chiquita et al. Alzheimers Res Ther. .

Abstract

Background: It has been claimed that the retina can be used as a window to study brain disorders. However, concerning Alzheimer's disease (AD), it still remains controversial whether changes occurring in the brain and retina are associated. We aim to understand when changes start appearing in the retina and brain, how changes progress, and if they are correlated.

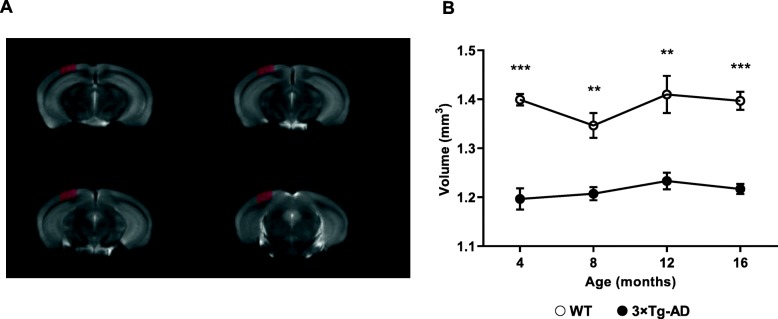
Methods: We carried out a unique longitudinal study, at 4, 8, 12, and 16 months of age, in a triple transgenic mouse model of AD (3×Tg-AD), which mimics pathological and neurobehavioral features of AD, as we have already shown. Retinal structure and physiology were evaluated in vivo using optical coherence tomography and electroretinography. Brain visual cortex structure was evaluated in vivo using magnetic resonance imaging.

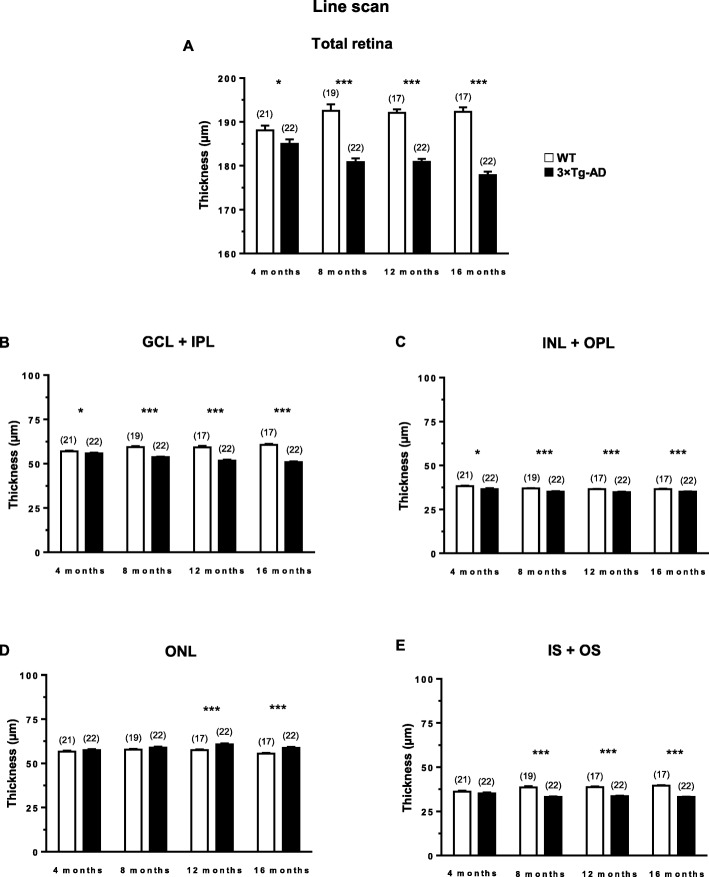
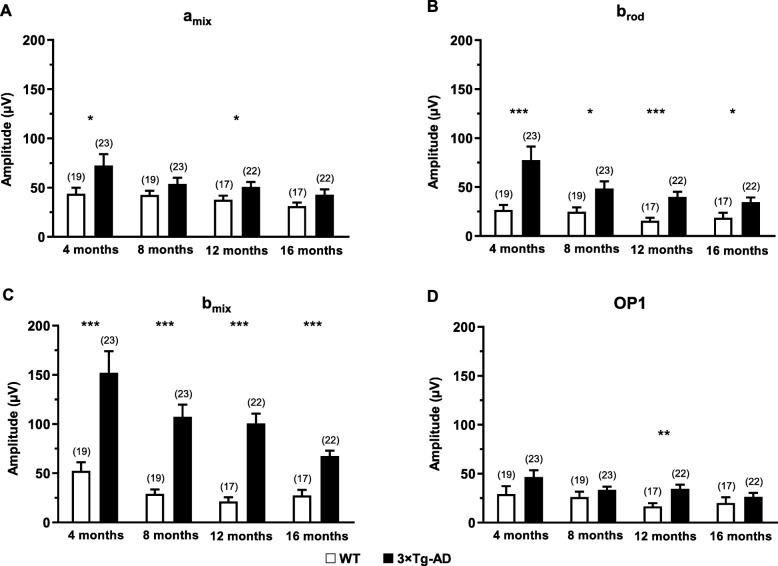
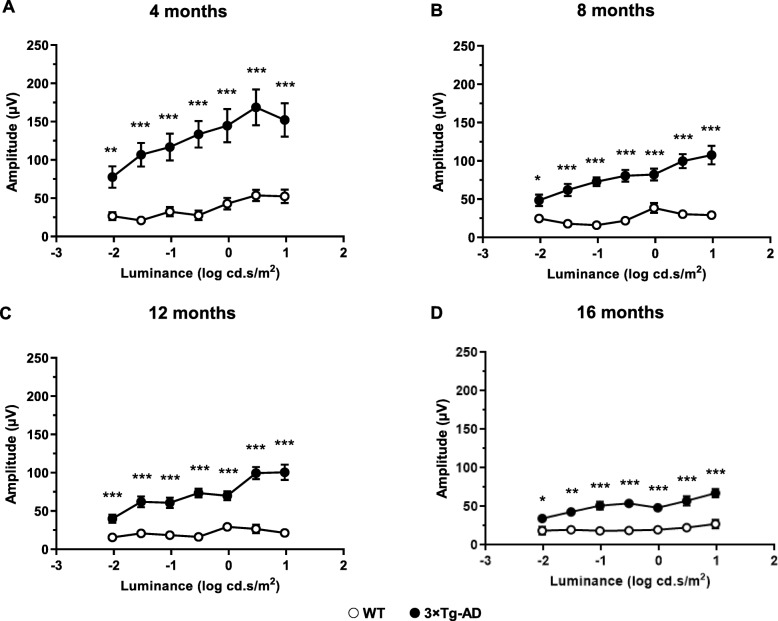
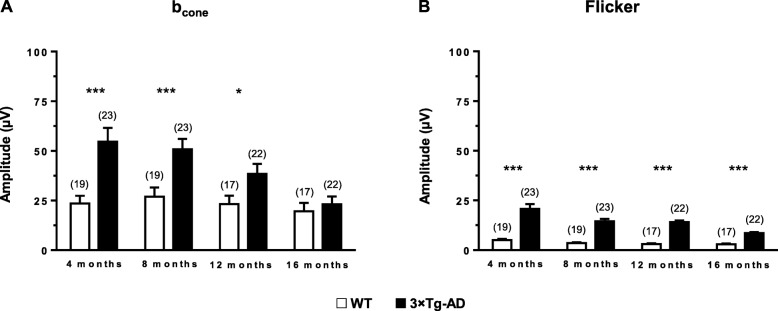
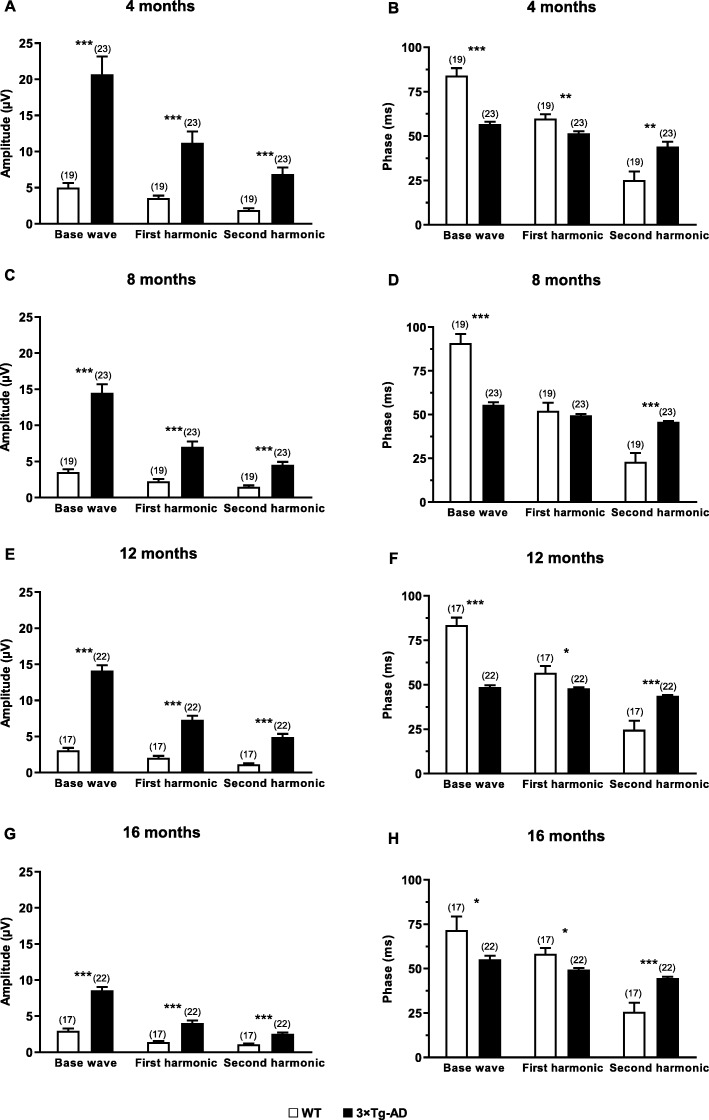
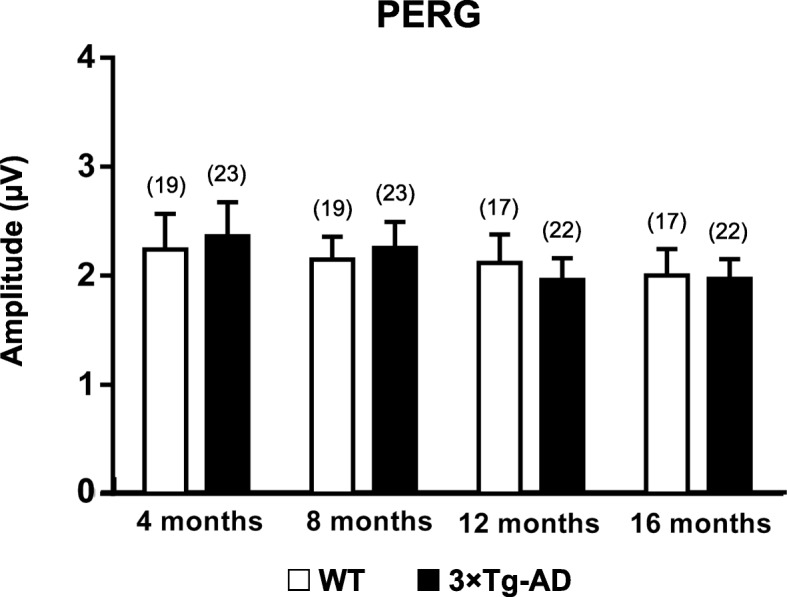
Results: The retinal thickness of 3×Tg-AD decreased, at all time points, except for the outer nuclear layer, where the opposite alteration was observed. Amplitudes in scotopic and photopic responses were increased throughout the study. Similarly, higher amplitude and lower phase values were observed in the photopic flicker response. No differences were found in the activity of retinal ganglion cells. Visual cortex gray matter volume was significantly reduced.

Conclusions: Our results show that this animal model shows similar neural changes in the retina and brain visual cortex, i.e., retinal and brain thinning. Moreover, since similar changes occur in the retina and brain visual cortex, these observations support the possibility of using the eye as an additional tool (noninvasive) for early AD diagnosis and therapeutic monitoring.

Keywords: 3×Tg-AD mouse model; Alzheimer’s disease; Brain; Retina.


Conflict of interest statement

The authors declare that they have no competing interests.

Figures

Fig. 1
Fig. 1
Thickness of different retinal layers in WT (white bars) and 3×Tg-AD (black bars) mice at 4, 8, 12, and 16 months of age, based on in vivo OCT line scans. The thickness of retinal layers was measured using the InSight software. a Total retina, b GCL+IPL, c INL+OPL, d ONL, e IS+OS. The results are presented as mean ± SEM. *p < 0.05, ***p < 0.001, according to Student’s t test. nWT: at 4 months = 21, at 8 months = 19, at 12 months = 17, at 16 months = 17; n 3×Tg-AD: at 4 months = 22, at 8 months = 22, at 12 months = 22, at 16 months = 22
Fig. 2
Fig. 2
Retinal function in WT and 3×Tg-AD mice at 4, 8, 12, and 16 months of age assessed by fERG, under scotopic conditions. Main component values obtained in response to 0.0095 cd.s/m2 light stimulus (brod) or 9.49 cd.s/m2 light stimulus (amix, bmix, and OP1) in WT (white bars) and 3×Tg-AD (black bars): a amix amplitude, b brod amplitude, c bmix amplitude, d OP1 amplitude. The results are presented as mean ± SEM. *p < 0.05, **p < 0.01, and ***p < 0.001 according to Student’s t test. nWT: at 4 months = 19, at 8 months = 19, at 12 months = 17, at 16 months = 17; n3×Tg-AD: at 4 months = 23, at 8 months = 23, at 12 months = 22, at 16 months = 22
Fig. 3
Fig. 3
Scotopic b-wave amplitude in WT (white circles) and 3×Tg-AD (black circles) mice, at a 4, b 8, c 12, and d 16 months of age. Graphs present the amplitude of the b-wave at the indicated luminance conditions. The results are presented as mean ± SEM. *p < 0.05, **p < 0.01, ***p < 0.001, according to Student’s t test. nWT: at 4 months = 19, at 8 months = 19, at 12 months = 17, at 16 months = 17; n3×Tg-AD: at 4 months = 23, at 8 months = 23, at 12 months = 22, at 16 months = 22
Fig. 4
Fig. 4
Retinal function in WT and 3×Tg-AD mice at 4, 8, 12, and 16 months of age, assessed by fERG, under photopic conditions. Main component values obtained in response to 9.49 cd.s/m2 light stimulus in WT (white bars) and 3×Tg-AD (black bars): a bcone amplitude, b base wave amplitude. The results are presented as mean ± SEM. **p < 0.01, ***p < 0.001 according to Student’s t test. nWT: at 4 months = 19, at 8 months = 19, at 12 months = 17, at 16 months = 17; n3×Tg-AD: at 4 months = 23, at 8 months = 23, at 12 months = 22, at 16 months = 22
Fig. 5
Fig. 5
Photopic flicker retinal response in WT (white bars) and 3×Tg-AD (black bars) mice at a, b 4, c, d 8, e, f 12, and g, h 16 months of age. The responses were recorded in response to 9.49 cd.s/m2 light stimulus. The amplitude and phase of the signal were evaluated after fast Fourier transform. The results are presented as mean ± SEM. **p < 0.01, ***p < 0.001, according to Student’s t test. nWT: at 4 months = 19, at 8 months = 19, at 12 months = 17, at 16 months = 17; n3×Tg-AD: at 4 months = 23, at 8 months = 23, at 12 months = 22, at 16 months = 22
Fig. 6
Fig. 6
RGC function in WT and 3×Tg-AD mice at 4, 8, 12, and 16 months of age, assessed by PERG. PERG amplitude obtained in WT (white bars) and 3×Tg-AD (black bars). The results are presented as mean ± SEM. No statistically significant differences were obtained, according to Student’s t test. nWT: at 4 months = 19, at 8 months = 19, at 12 months = 17, at 16 months = 17; n3×Tg-AD: at 4 months = 23, at 8 months = 23, at 12 months = 22, at 16 months = 22
Fig. 7
Fig. 7
Gray matter volume analysis in the visual cortex. a Region of interest used in the assessment of the visual cortex volume overlaid on a mean T2-weighted image. b GM volume in the visual cortex of WT (white circles) and 3×Tg-AD (black circles) mice measured by VBM analysis. Results are presented as mean ± SEM. The significance of the alterations in GM volumes of the visual cortex along time and between groups was assessed by an ANOVA repeated measures (mixed-effects) followed by a Bonferroni post hoc test. **p < 0.01 and ***p < 0.001. nWT = 6, n3×Tg-AD = 7

References

    1. London A, Benhar I, Schwartz M. The retina as a window to the brain—from eye research to CNS disorders. Nat Rev Neurol. 2013;9(1):44–53. doi: 10.1038/nrneurol.2012.227. - DOI - PubMed
    1. Sperling RA, Aisen PS, Beckett LA, Bennett DA, Craft S, Fagan AM, et al. Toward defining the preclinical stages of Alzheimer’s disease: recommendations from the National Institute on Aging-Alzheimer’s Association workgroups on diagnostic guidelines for Alzheimer's disease. Alzheimers Dement. 2011;7(3):280–292. doi: 10.1016/j.jalz.2011.03.003. - DOI - PMC - PubMed
    1. Jack CR, Knopman DS, Jagust WJ, Petersen RC, Weiner MW, Aisen PS, et al. Tracking pathophysiological processes in Alzheimer’s disease: an updated hypothetical model of dynamic biomarkers. Lancet Neurol. 2013;12(2):207–216. doi: 10.1016/S1474-4422(12)70291-0. - DOI - PMC - PubMed
    1. Sutphen CL, Fagan AM, Holtzman DM. Progress update: fluid and imaging biomarkers in Alzheimer’s disease. Biol Psychiatry. 2014;75(7):520–526. doi: 10.1016/j.biopsych.2013.07.031. - DOI - PMC - PubMed
    1. Lim JK, He Z, Vingrys AJ, Chinnery HR, Li Q-X, Bui BV, et al. Age-related changes in retinal structure and function in a mouse model of Alzheimer’s disease. Invest Ophthalmol Vis Sci. 2016;57(12):613.

Publication types

MeSH terms