. 2019 Nov 13;12(1):67.
doi: 10.1186/s13072-019-0313-6.

Chromatin accessibility and transcription dynamics during in vitro astrocyte differentiation of Huntington's Disease Monkey pluripotent stem cells

Affiliations

Chromatin accessibility and transcription dynamics during in vitro astrocyte differentiation of Huntington's Disease Monkey pluripotent stem cells

Alexandra V Goodnight et al. Epigenetics Chromatin. .

Abstract

Background: Huntington's Disease (HD) is a fatal neurodegenerative disorder caused by a CAG repeat expansion, resulting in a mutant huntingtin protein. While it is now clear that astrocytes are affected by HD and significantly contribute to neuronal dysfunction and pathogenesis, the alterations in the transcriptional and epigenetic profiles in HD astrocytes have yet to be characterized. Here, we examine global transcription and chromatin accessibility dynamics during in vitro astrocyte differentiation in a transgenic non-human primate model of HD.

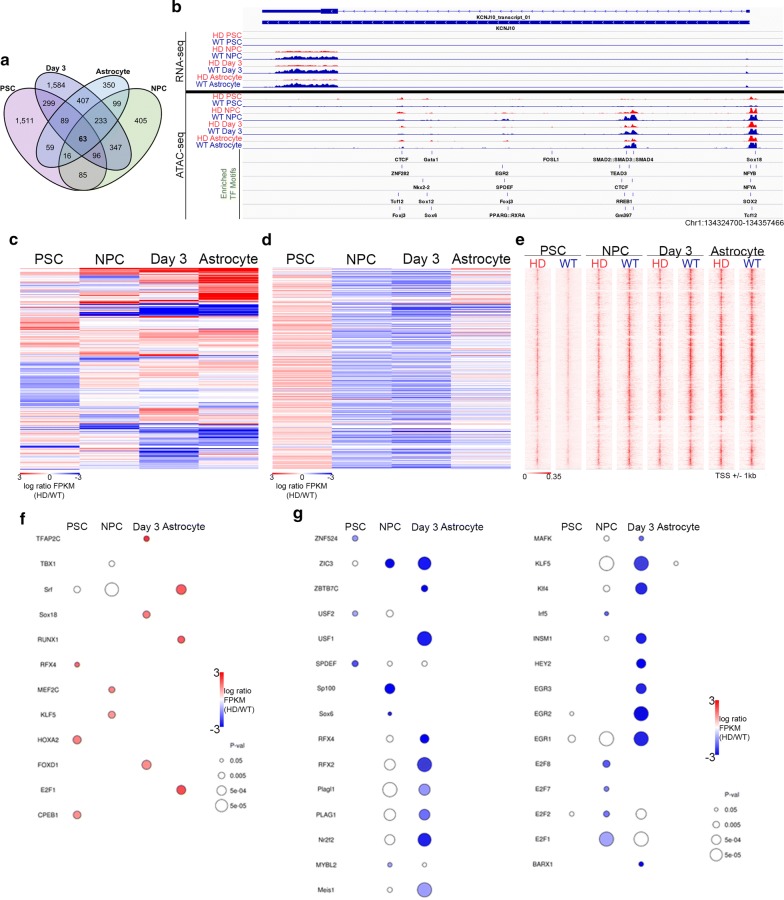
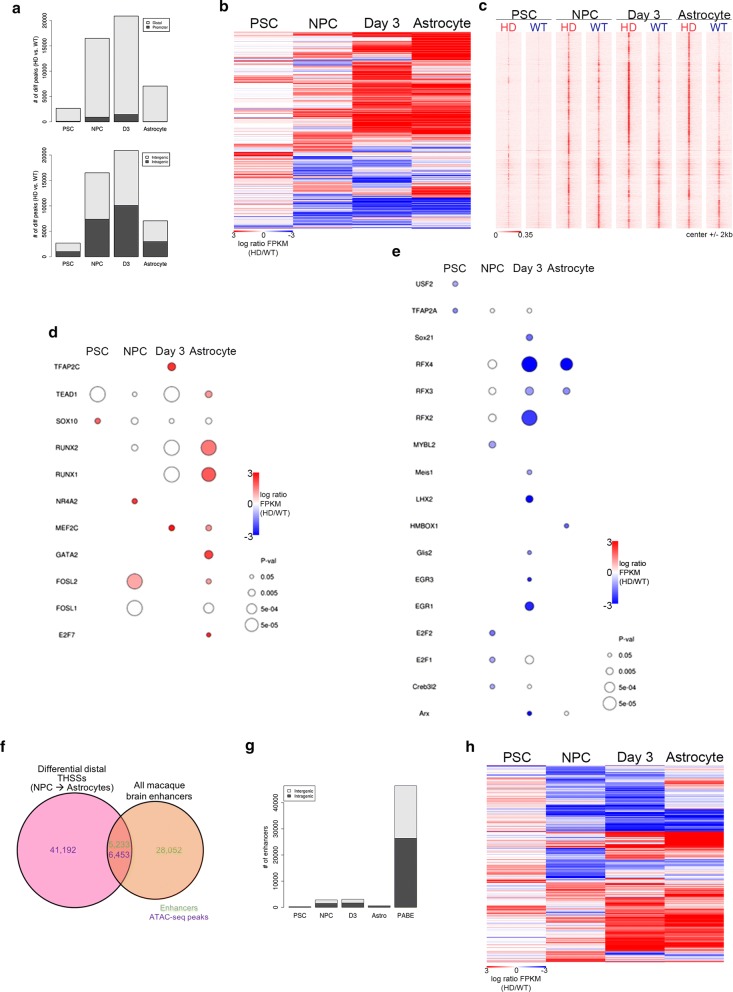
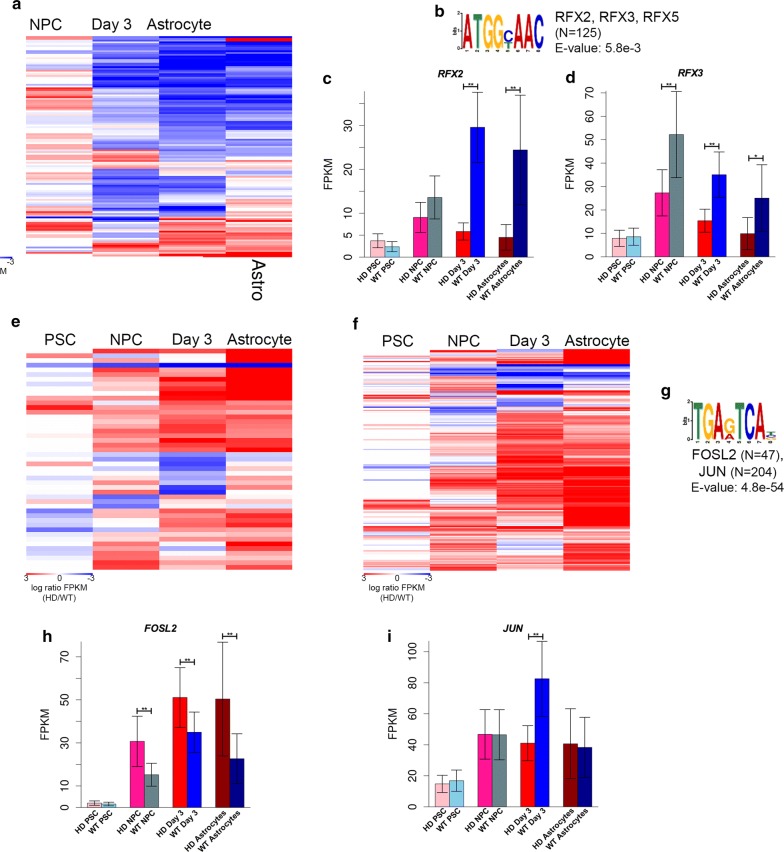
Results: We found global changes in accessibility and transcription across different stages of HD pluripotent stem cell differentiation, with distinct trends first observed in neural progenitor cells (NPCs), once cells have committed to a neural lineage. Transcription of p53 signaling and cell cycle pathway genes was highly impacted during differentiation, with depletion in HD NPCs and upregulation in HD astrocytes. E2F target genes also displayed this inverse expression pattern, and strong associations between E2F target gene expression and accessibility at nearby putative enhancers were observed.

Conclusions: The results suggest that chromatin accessibility and transcription are altered throughout in vitro HD astrocyte differentiation and provide evidence that E2F dysregulation contributes to aberrant cell-cycle re-entry and apoptosis throughout the progression from NPCs to astrocytes.

Keywords: ATAC-seq; Brain; Glia; Neural progenitor cells; Neurodegeneration.


Conflict of interest statement

The authors declare that they have no competing interests.

Figures

Fig. 1
Fig. 1
Characterization of promoter-proximal THSSs at differentially expressed genes during HD astrocyte differentiation. a Venn diagram showing overlap of genes differentially expressed between HD and WT cells at each stage of astrocyte differentiation. b Track view of RNA-seq and THSSs, as well as identified motifs within ATAC-seq peaks across the KCNJ10 gene. HD samples are shown in red and WT samples are shown in blue. c Heatmap depicting 5643 genes found DE at any stage of differentiation. Red indicates increased expression in HD cells and blue indicates reduced expression in HD cells. Each row corresponds to the same gene. d Heatmap depicting differential THSS enrichment at DE gene promoters. The red color represents HD enrichment and the blue color indicates HD depletion. Genes arranged according to gene order in c. e Distributions of ATAC-seq peaks around the promoter (± 2 kb TSS) in HD and WT cells at each timepoint across differentiation. f, g TF motifs identified at differential promoter-proximal ATAC-seq peaks in HD (f) and WT (g) cells. Only TF motifs with significant enrichment at least at one stage were included (p < 0.05)
Fig. 2
Fig. 2
Characterization of differential distal THSSs during HD astrocyte differentiation. a Genome-wide distribution of differential THSSs between HD and WT cells across differentiation identified from ATAC-seq non-nucleosomal fragments. Both distal vs. proximal (top) and intergenic vs. intragenic distributions (bottom) are reported. THSSs located ± 500 nt from a TSS are considered proximal. b Heatmap depicting differential enrichment of distal ATAC-seq THSSs at each stage of differentiation. The red color represents HD enrichment and the blue color indicates HD depletion. c Genome-wide distributions of distal ATAC-seq THSSs from HD and WT cells at each timepoint. d, e TF motifs identified from distal ATAC-seq peaks that were enriched in HD (D) and WT (E) cells. Only TF motifs with significant enrichment at least at one stage were included (p < 0.05). f Venn diagram showing overlap of differential distal ATAC-seq THSSs and Putative Active Brain Enhancers (PABEs) previously published [43]. Purple denotes ATAC-seq peaks and green indicates macaque brain enhancers. g Genome-wide distribution of differential enhancer THSSs across HD astrocyte differentiation. h Heatmap depicting differential enrichment of distal ATAC-seq THSSs at PABEs during differentiation. The red color represents HD enrichment and the blue color indicates HD depletion
Fig. 3
Fig. 3
Differences in TF-binding site accessibility occur in putative enhancers at every stage of differentiation in HD cells. a Heatmap depicting differential ATAC-seq signal in HD and WT cells at macaque brain enhancers containing the RFX2, RFX3, and RFX5 binding sequences (N = 125). The red color represents enrichment and the blue color indicates depletion of THSSs containing this RFX motif in HD cells. b RFX2, RFX3, and RFX5 motif found by de novo motif analysis at enhancers showing differential ATAC-seq. c, d Bar graphs generated from RNA-seq data depicting differential expression of RFX2 (c) and RFX3 (d) showing differential expression corresponding with motif accessibility. Average FPKM for each sample was plotted. Error bars show 95% confidence intervals (**p < 0.001 and *p < 0.01, differential expression analysis). e, f Heatmap depicting differential THSSs at macaque brain enhancers containing FOSL2 (N = 47; e) and JUN (N = 204; f) binding sequences. Red represents HD enrichment and blue represents HD depletion. g The motif for FOSL2 and JUN found at enhancers showing differential ATAC-seq enrichment. h, i Bar graphs generated from RNA-seq for FOSL2 (h) and JUN (i) expression across differentiation. Error bars show 95% confidence intervals (**p < 0.001 and *p < 0.01, differential expression analysis)
Fig. 4
Fig. 4
RNA-seq identifies multiple pathways that are altered across HD astrocyte differentiation. Top ten KEGG pathways reported from GO analyses of DE genes at the PSC (a), NPC (b), day 3 (c), and astrocyte (d) stages. Pathways are ranked by −log10(q value), determined by Benjamini–Hochberg procedures, with threshold set to q < 0.05. Line graphs show the ratio of DE genes in each KEGG pathway. e DE genes at any stage show overlap with the KEGG Huntington’s Disease pathway. f Huntington’s disease pathway showing DE genes (in purple) in HD cells at any stage of astrocyte differentiation. g Bar plot depicting the enrichment scores of the top 9 most enriched gene sets, which comprise 6 functional categories. Negative enrichment scores (left; blue) reflect HD-depleted gene sets, and positive enrichment scores (right; red) represent HD-enriched gene sets. NPC GSEA results are shown in purple and astrocyte GSEA results are shown in orange
Fig. 5
Fig. 5
RNA-seq revealed dysregulation of p53 signaling and cell-cycle pathways across HD differentiation. a p53 signaling pathway diagram showing DE genes (in purple) in HD cells at any stage of astrocyte differentiation. b Heatmap depicting 38 DE genes in the p53 signaling pathway at each stage of differentiation. Red indicates increased expression in HD cells and blue indicates reduced expression in HD cells. Each row corresponds to the same gene and gene names are displayed to the right of the plot. cf Cross-sectional GSEA enrichment plots. For GSEA plots, the black lines indicate the position of pathway genes in the expression data rank-sorted between HD and WT samples. Red dots indicate leading edge genes. q values are FDR corrected p values with alpha = 0.02, or the equivalent. g Diagram of the KEGG cell-cycle pathway showing genes DE (purple) in HD cells. h Heatmap depicting 54 DE cell-cycle genes in the p53-signaling pathway at each stage of differentiation. Red indicates increased expression in HD cells and blue indicates reduced expression in HD cells. Each row corresponds to the same gene and gene names are displayed to the right of the plot
Fig. 6
Fig. 6
Aberrant E2F regulation coincides with increased p53 signaling and cell-cycle gene expression in HD astrocytes. Cross-sectional GSEA enrichment plots shows significant depletion of E2F target gene expression in HD NPCs (a) and significant enrichment in HD astrocytes (b) compared to WT cells. Black lines indicate E2F target gene positions in rank-sorted expression data between HD and WT samples. Red dots indicate leading edge genes. q values are FDR corrected p values with alpha = 0.02, or the equivalent. RNA-seq expression data for E2F1 (c) and E2F7 (d) showing differential expression corresponding with motif accessibility. Average FPKM for each sample was plotted. Error bars show 95% confidence intervals (**p < 0.001 and *p < 0.01, differential expression analysis). e Heatmap depicting nearest differential ATAC-seq peaks to E2F target genes that are DE in at least one stage of astrocyte differentiation. Both proximal and distal peaks are included. Nearest differential ATAC-seq peaks are arranged according to hierarchical clustering, and correspond to the gene order in panel F. The E2F1 motif is shown below the heatmap. f Heatmap depicting differential expression of E2F target genes across differentiation. Each row corresponds to the same gene and gene names are displayed to the right of the plot. For both heat maps, red represents HD enrichment and blue indicates HD depletion. g Track view of RNA-seq and ATAC-seq data, as well as motifs present in differential peaks, at MCM3, an example E2F target gene. HD signal is shown in red and WT in blue. Significant differential peaks are indicated in the tracks below ATAC-seq tracks at each stage. TF motifs enriched in differential peaks are displayed at the bottom
Fig. 7
Fig. 7
Schematic model showing cell cycle, p53 signaling, and E2F target gene regulation across HD astrocyte differentiation. a HD NPCs show increased expression of p53 signaling genes, decreased expression of cell cycle and E2F target genes, which coincides with depleted promoter-proximal and distal accessibility of the E2F TF motif, while WT NPCs (b) show normal cell-cycle progression and accessible E2F TF motifs genome-wide. c HD astrocytes show upregulation of p53 signaling, apoptosis, cell cycle and E2F target gene expression, along with increased E2F TF motif accessibility, suggesting cell-cycle re-entry leading to apoptosis. d In comparison, WT astrocytes show depleted accessibility of E2F TF motifs, and have low expression of p53 signaling, E2F target and cell-cycle genes, indicating they are quiescent

References

    1. Zuccato C, Valenza M, Cattaneo E. Molecular mechanisms and potential therapeutical targets in Huntington’s disease. Physiol Rev. 2010;90:905–981. doi: 10.1152/physrev.00041.2009. - DOI - PubMed
    1. Cho IK, Hunter CE, Ye S, Pongos AL, Chan AWS. Combination of stem cell and gene therapy ameliorates symptoms in Huntington’s disease mice. NPJ Regen Med. 2019;4:7. doi: 10.1038/s41536-019-0066-7. - DOI - PMC - PubMed
    1. Cho IK, Yang B, Forest C, Qian L, Chan AWS. Amelioration of Huntington’s disease phenotype in astrocytes derived from iPSC-derived neural progenitor cells of Huntington’s disease monkeys. PLoS ONE. 2019;14:e0214156. doi: 10.1371/journal.pone.0214156. - DOI - PMC - PubMed
    1. Gagnon KT, Pendergraff HM, Deleavey GF, Swayze EE, Potier P, Randolph J, Roesch EB, Chattopadhyaya J, Damha MJ, Bennett CF, et al. Allele-selective inhibition of mutant huntingtin expression with antisense oligonucleotides targeting the expanded CAG repeat. Biochemistry. 2010;49:10166–10178. doi: 10.1021/bi101208k. - DOI - PMC - PubMed
    1. Hu J, Dodd DW, Hudson RH, Corey DR. Cellular localization and allele-selective inhibition of mutant huntingtin protein by peptide nucleic acid oligomers containing the fluorescent nucleobase [bis-o-(aminoethoxy)phenyl]pyrrolocytosine. Bioorg Med Chem Lett. 2009;19:6181–6184. doi: 10.1016/j.bmcl.2009.09.004. - DOI - PMC - PubMed

Publication types

MeSH terms