. 2019 Nov 14;4(22):e131610.
doi: 10.1172/jci.insight.131610.

Using a barcoded AAV capsid library to select for clinically relevant gene therapy vectors

Affiliations

Using a barcoded AAV capsid library to select for clinically relevant gene therapy vectors

Katja Pekrun et al. JCI Insight. .

Abstract

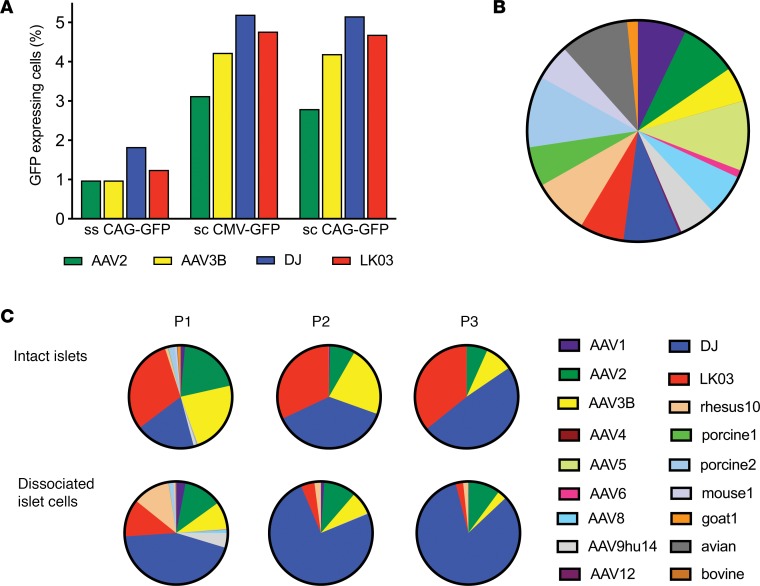
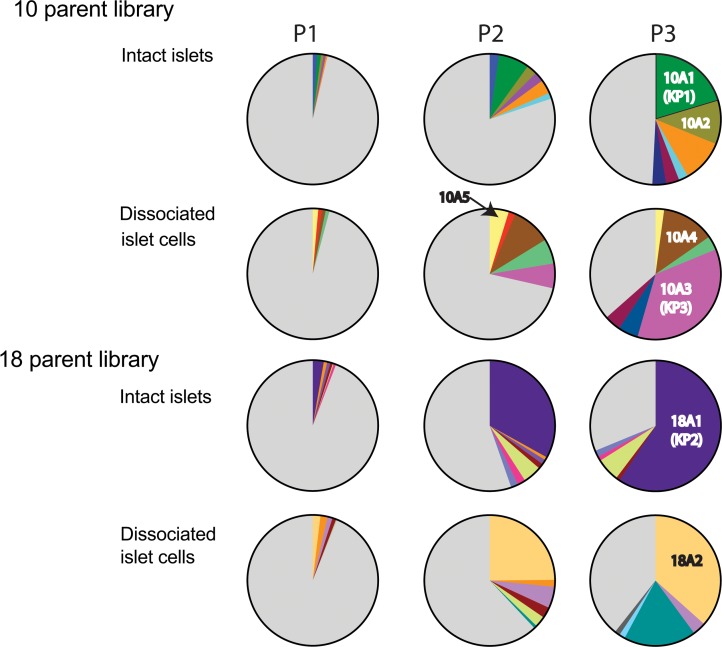
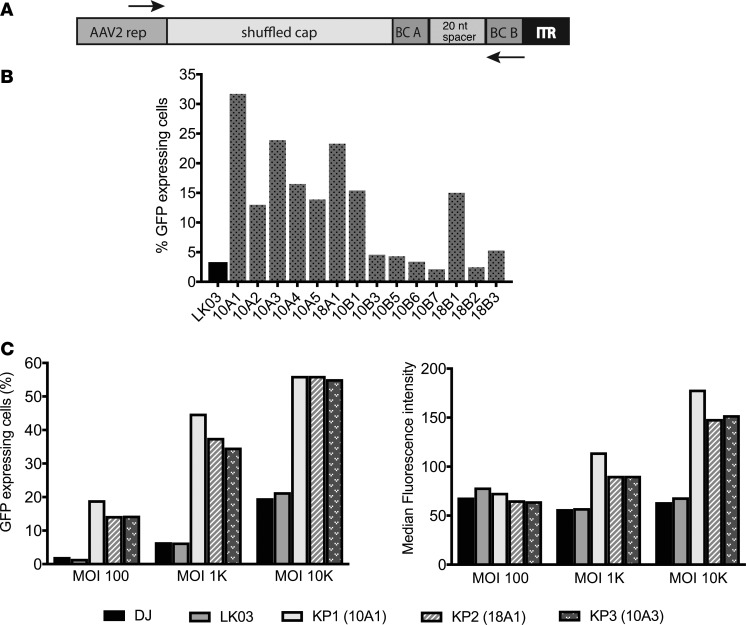
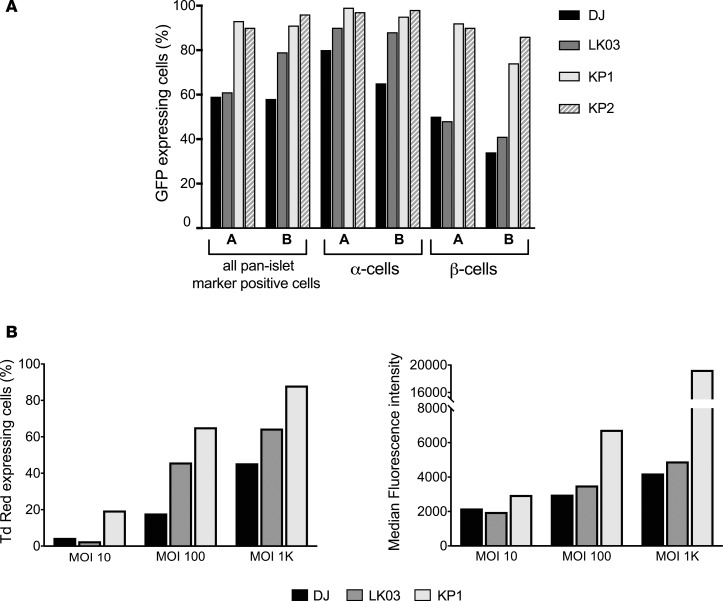
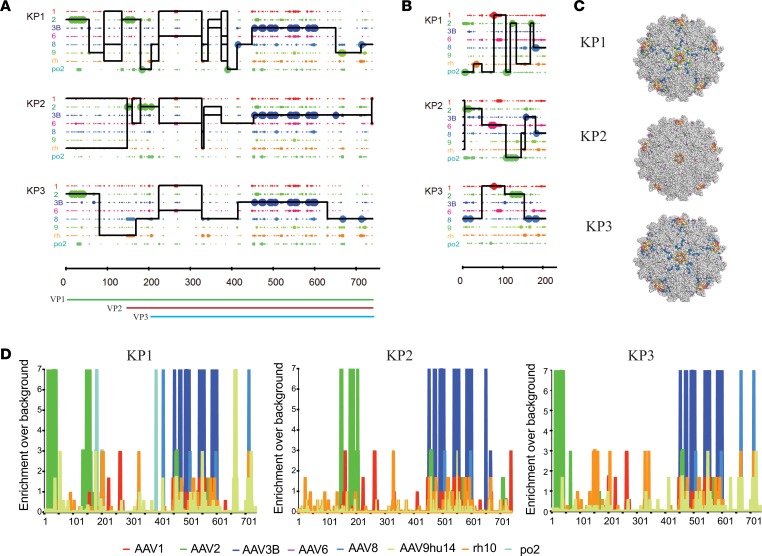
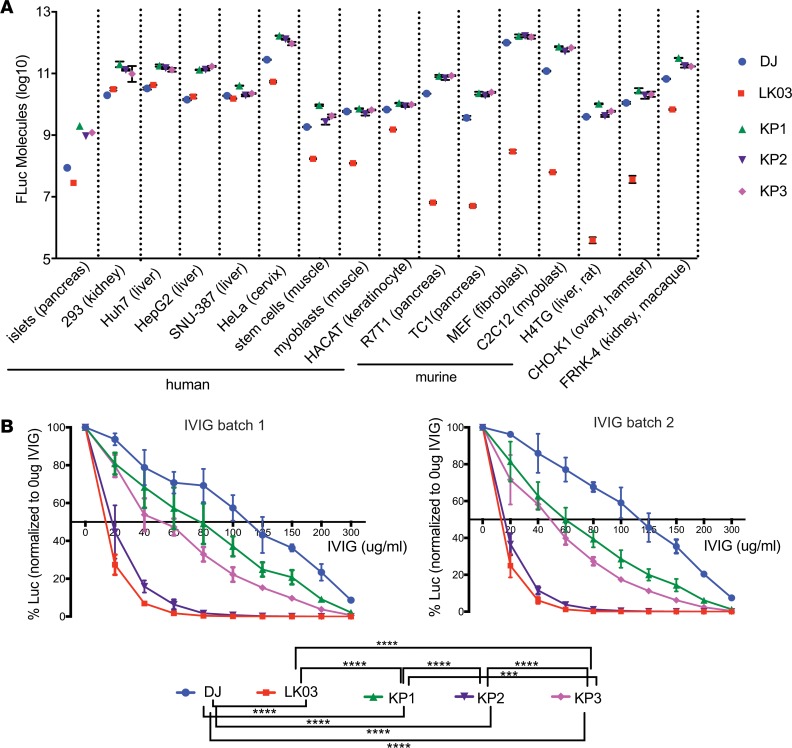
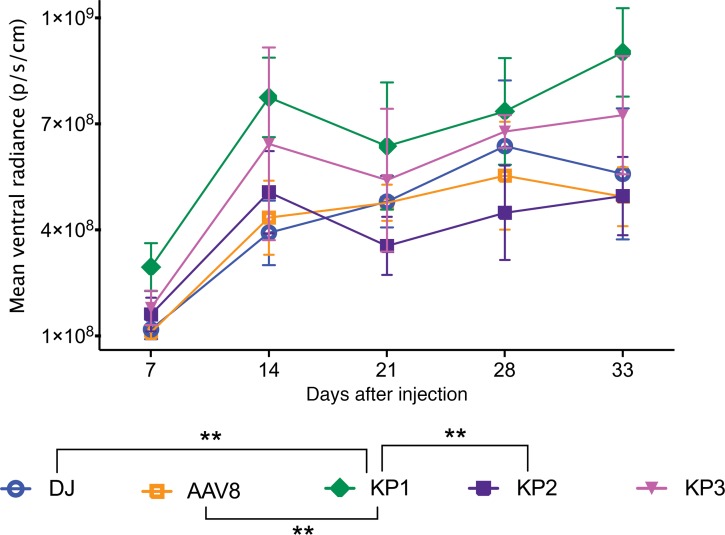
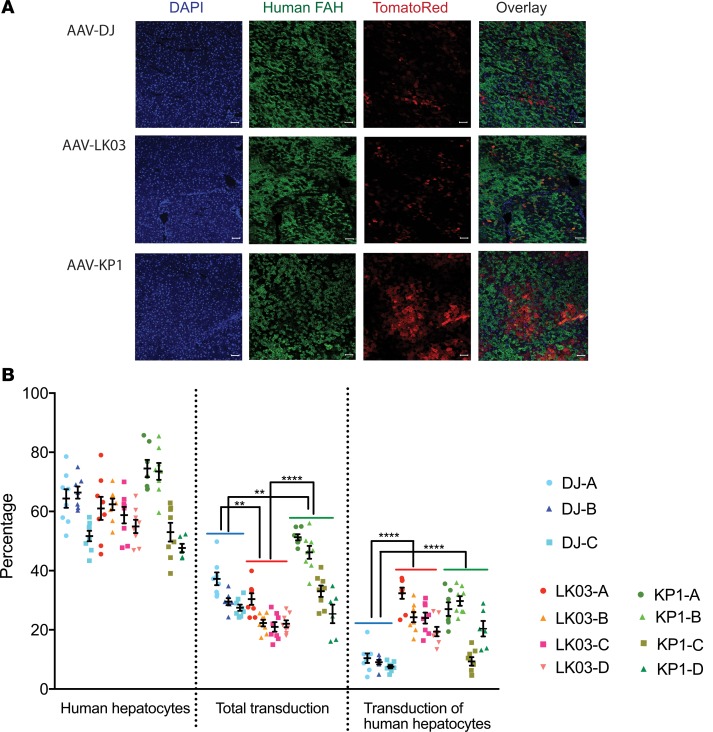
While gene transfer using recombinant adeno-associated viral (rAAV) vectors has shown success in some clinical trials, there remain many tissues that are not well transduced. Because of the recent success in reprogramming islet-derived cells into functional β cells in animal models, we constructed 2 highly complex barcoded replication competent capsid shuffled libraries and selected for high-transducing variants on primary human islets. We describe the generation of a chimeric AAV capsid (AAV-KP1) that facilitates transduction of primary human islet cells and human embryonic stem cell-derived β cells with up to 10-fold higher efficiency compared with previously studied best-in-class AAV vectors. Remarkably, this chimeric capsid also enabled transduction of both mouse and human hepatocytes at very high levels in a humanized chimeric mouse model, thus providing a versatile vector that has the potential to be used in both preclinical testing and human clinical trials for liver-based diseases and diabetes.

Keywords: Diabetes; Embryonic stem cells; Gene therapy; Therapeutics.


Conflict of interest statement

Conflict of interest: KP and MAK are named on patent applications for AAV variants used in this paper. MAK has equity interests in LogicBio Therapeutics. MG has equity interests in Yecuris Corp., Ambys Medicines, and LogicBio Therapeutics. MH owns stock in Encellin and Viacyte Inc., receives research support from Eli Lily, and holds roles as consultant and member of the scientific advisory board for Semma Therapeutics and Encellin.

Figures

Figure 1
Figure 1. Evaluation of parental capsids for islet tropism.
(A) Dissociated islet cells were transduced with different vectors that had been packaged with AAV2, AAV3B, DJ, and LK03 capsids at a MOI of 1,000, and transduction efficiency was determined by flow cytometry 48 hours after transduction. Each rAAV was tested once. (B) Parental contribution in the 18-parent pool as analyzed using high-throughput sequencing of the barcodes. (C) Barcode sequences were amplified from viral genomes after passaging the 18-parent pool on human islets and were analyzed by high-throughput sequencing. Color coding of enriched parental capsids for passaging of the 18-parent pool is identical to that of the input parental pool.
Figure 2
Figure 2. Enrichment of distinct capsids during passaging.
Barcode sequences were amplified from viral genomes after each passage and were analyzed by high-throughput sequencing. Enriched variants are depicted in different colors, while all other variants are shown in gray. Enrichment of AAV capsid variants used for vectorization is indicated (10A1, 10A2, 10A3, 10A4 10A5, 18A1, 18A2).
Figure 3
Figure 3. Rescue of enriched capsid sequences and evaluation of selected capsids for islet transduction.
(A) The forward primer annealed to a sequence in the 3′ end of the rep gene; the reverse primer was specific to the sequence of the right barcode of the variant capsid to be amplified. (B) A self-complementary AAV-expressing GFP was packaged with LK03, as well as 12 capsid sequences, and islet cells were transduced using a low MOI of 1,000. Cells were sorted for GFP expression using FACS 48 hours later. Each rAAV was evaluated once. (C) Dissociated islet cells were transduced with CsCl gradient–purified scCAG-GFP rAAV preparations generated with the 2 best parental capsids, as well as the capsids that were the top transducers in the prescreen. Three different MOIs were used for transduction. Transduction efficiency is depicted both as the percentage of GFP+ cells (left graph) and the median fluorescence intensity within the GFP+ cell population (right graph). Results of a representative experiment that was performed twice are shown.
Figure 4
Figure 4. Analysis of transduction efficiency of the variants.
(A) GFP-expressing rAAV packaged with 2 of the variant capsids, as well as AAV-DJ and AAV-LK03 capsids, were used to transduce intact islets from 2 individual donors (donors A and B) at a MOI of 10,000, and α- and β cell–specific transduction was determined by surface staining followed by flow cytometry. The experiment was performed once. (B) Transduction efficiency of capsid KP1 for human embryonic stem cell–derived β cells. DJ, LK03, and KP1 capsids were used to package a Tomato Red vector, and hESC-derived mature β cells were transduced with the MOIs indicated. Intracellular staining for the β cell marker C-peptide was performed on day 6 after transduction, and cells were analyzed by flow cytometry. Transduction with MOI 100 was performed in a second independent experiment (Supplemental Figure 9); transduction at the other MOIs was performed only once.
Figure 5
Figure 5. Amino acid sequence and structural composition of selected shuffled AAV capsid variants.
(A) Amino acid sequence mapping analysis of parental capsid fragment crossovers in vectorized shuffled capsids. Library parents are depicted in different colors as indicated on the left. Large dots represent 100% parental match (i.e., the position in question matches only 1 parent), and small dots represent more than 1 parental match (i.e., the position matches more than 1 parent) at each position. The solid line for each chimera represents the library parents identified within the sequence between crossovers. A set of thin horizontal parallel lines between crossovers indicates that multiple parents match at an equal probability. A vertical spike indicates a single position switch between parents. VP1, VP2, VP3, and AAP open reading frames are shown below. (B) Amino acid sequence mapping analysis of parental AAP fragment crossovers in vectorized shuffled capsids. (C) The residues different from AAV3B of shuffled variants were 3-dimensionally false-color mapped onto the crystal structure of AAV6 VP3. Light gray residues correspond to AAV3B amino acids, while colored residues indicate surface-exposed amino acids derived from other serotypes. With the exception of AAV3B, color coding is as in A and B. (D) Enrichment scores were calculated for each amino acid position in the sequence of each chimera by comparison of sequences from parental serotypes based on maximum likelihood. Library parents are depicted in different colors as shown.
Figure 6
Figure 6. In vitro transduction experiments using rAAV-FLuc vectors.
(A) Transduction efficiency of the capsids, as well as AAV-DJ and AAV-LK03 capsids, on a variety of human- and nonhuman-derived cell types. Cells were transduced with the different capsid containing rAAVs that were packaging a FLuc expression cassette at a MOI of 1,000 in triplicate (with the exception of islet cells), and cell lysates were analyzed 48 hours after transduction in a luciferase activity assay. For primary human islet cells, results of 1 experiment that had been performed twice are shown. Two-fold dilutions of recombinant FLuc enzyme were used to prepare a standard curve, and raw luminescence units were calculated into luciferase molecules based on the standard curve. (B) Neutralization assay of rAAVs packaged with different capsids using dilutions of 2 different batches of pooled human immunoglobulin (IVIG). Huh-7 cells were transduced at a MOI of 100 with FLuc-expressing rAAVs that had been preincubated with different concentrations of IVIG for 1 hour at 37°C. Luciferase activity in cell lysates was measured 24 hours after transduction. Mean values of 5 replicates (obtained in 2 independent experiments) with SDs are shown for each sample. Experimental values were assessed via 2-way ANOVA using Tukey’s multiple comparisons test. Only statistically significant differences are indicated in the legend below the graph. ***P < 0.001, ****P < 0.0001.
Figure 7
Figure 7. In vivo transduction efficiency of rAAVs packaged with the AAV8 and AAV-DJ capsids.
Balb/C SCID mice were injected via tail vein with 2 × 10¹⁰ vg each FLuc-expressing rAAV, and luciferase expression in the livers was monitored over several weeks using live imaging after i.p injection of luciferin substrate. Four animals were injected for each group, with the exception of the AAV8 group, which contained 3 animals. The mean of each group’s mean ventral radiance is shown for each time point, with SDs indicated. One animal from the AAV8 group was omitted from analysis due to a failed substrate injection. Experimental values were assessed via 2-way ANOVA using Tukey’s multiple comparisons test. Only statistically significant differences are indicated in the legend below the graph. **P < 0.01.
Figure 8
Figure 8. Validation and quantification of human hepatocyte transduction in mice with humanized liver in vivo.
(A) Representative immunofluorescence images from livers of mice injected with ssAAV-Td Tomato Red at 1 × 10¹¹ vg i.v. with varying capsid serotypes (3 mice for DJ; 4 mice each for LK03 and KP1). DAPI (blue), human-specific FAH (green), and Tomato Red (red) on liver sections. Scale bar: 50 μM. (B) Quantification of human hepatocyte repopulation levels, transduction efficiency for all hepatocytes, and transduction efficiency for human hepatocytes only. Each data point represents an area of interest for each mouse. A total of 6–9 areas of interest for each mouse were scanned and analyzed. The mean and SD for each mouse is indicated. Experimental values were assessed via 2-way ANOVA using Tukey’s multiple comparisons test. Only statistically significant differences between the groups are shown in the graphs. **P < 0.01, ****P < 0.000.

Similar articles

Cited by

References

    1. CDC. US Department of Health Human Services. Web Site. https://www.cdc.gov/diabetes/pdfs/data/statistics/national-diabetes-stat... Updated 2017. Accessed October 30, 2019.
    1. Bruni A, Gala-Lopez B, Pepper AR, Abualhassan NS, Shapiro AJ. Islet cell transplantation for the treatment of type 1 diabetes: recent advances and future challenges. Diabetes Metab Syndr Obes. 2014;7:211–223. - PMC - PubMed
    1. Wang X, Meloche M, Verchere CB, Ou D, Mui A, Warnock GL. Improving islet engraftment by gene therapy. J Transplant. 2011;2011:594851. - PMC - PubMed
    1. Zhao C, et al. Overcoming Insulin Insufficiency by Forced Follistatin Expression in β-cells of db/db Mice. Mol Ther. 2015;23(5):866–874. doi: 10.1038/mt.2015.29. - DOI - PMC - PubMed
    1. Mallol C, et al. AAV-mediated pancreatic overexpression of Igf1 counteracts progression to autoimmune diabetes in mice. Mol Metab. 2017;6(7):664–680. doi: 10.1016/j.molmet.2017.05.007. - DOI - PMC - PubMed

Publication types