. 2019 Nov 14;4(22):e129013.
doi: 10.1172/jci.insight.129013.

TSLP protects against liver I/R injury via activation of the PI3K/Akt pathway

Affiliations

TSLP protects against liver I/R injury via activation of the PI3K/Akt pathway

Shilai Li et al. JCI Insight. .

Abstract

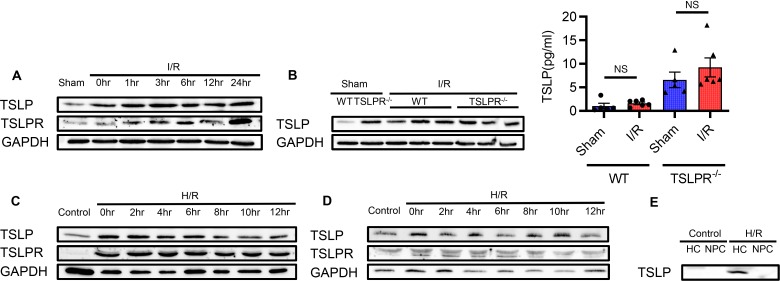
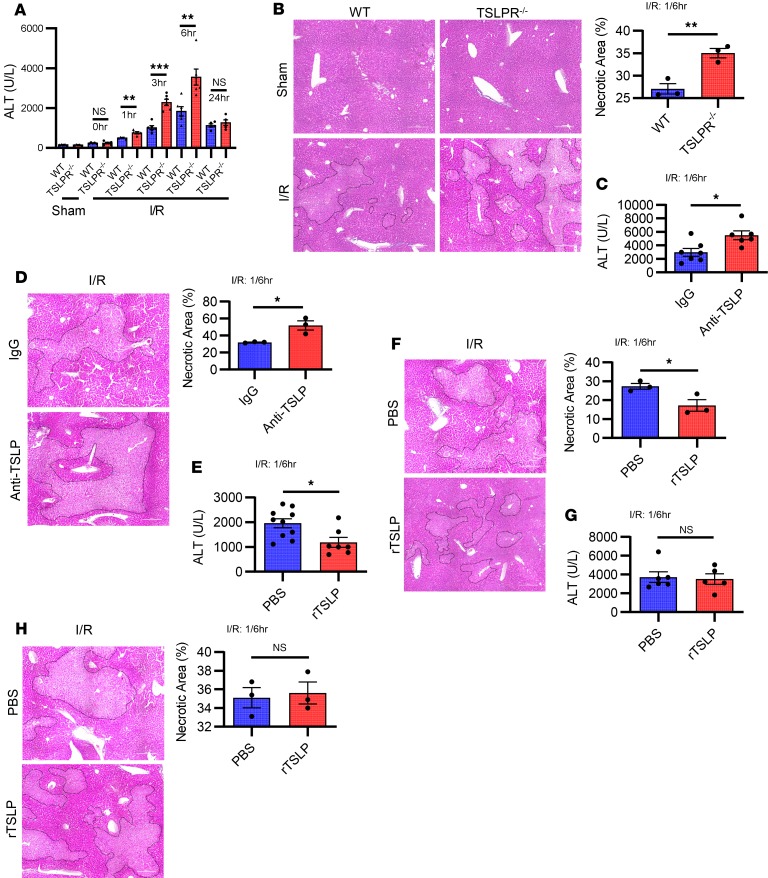
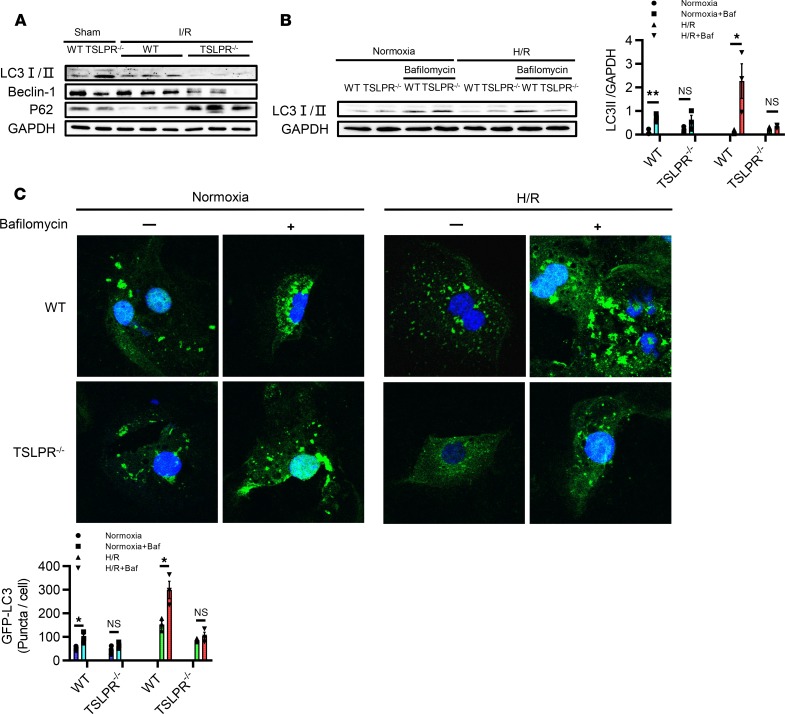
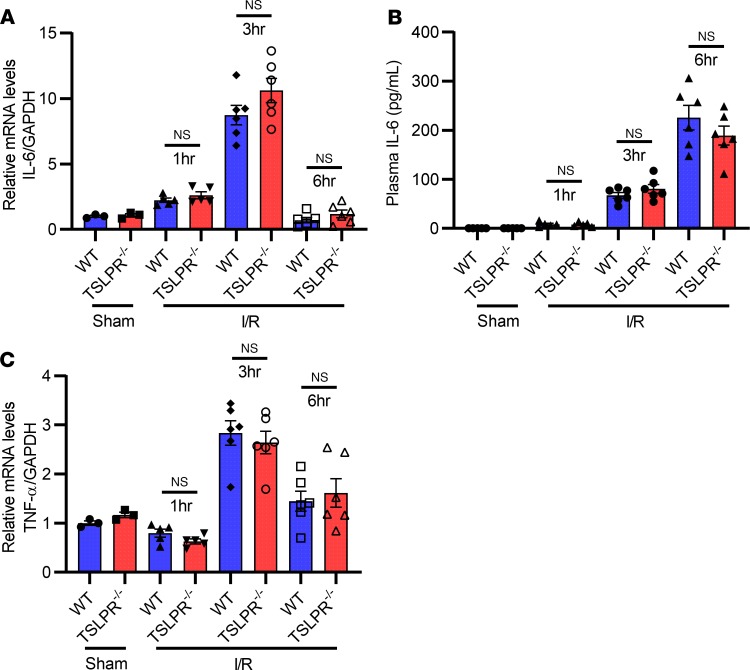
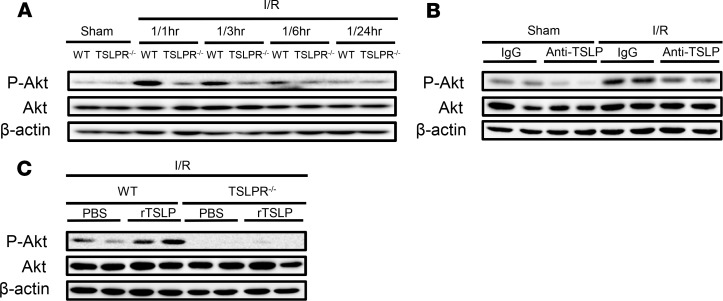
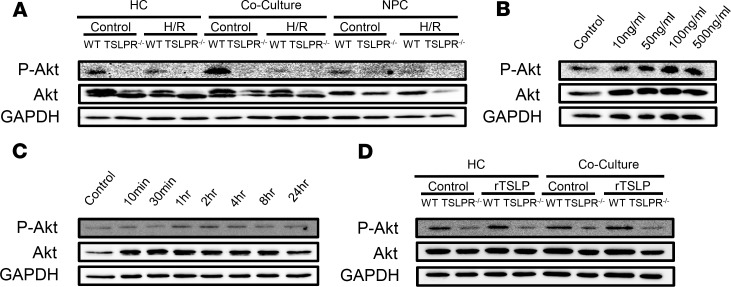
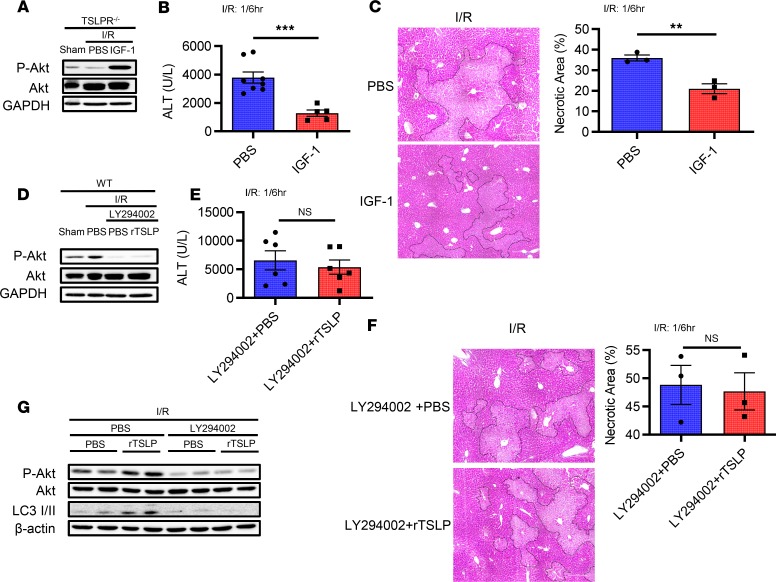
Thymic stromal lymphopoietin (TSLP) is a cytokine mainly released by epithelial cells that plays important roles in inflammation, autoimmune disease, and cancer. While TSLP is expressed in the liver at high levels, the role of TSLP in liver ischemia/reperfusion (I/R) injury remains unknown. Experiments were carried out to determine the role of TSLP in liver I/R injury. Wild-type (WT) and TSLP receptor-knockout (TSLPR-/-) mice were subjected to liver partial warm I/R injury. Liver injury was assessed by measuring serum alanine aminotransferase (ALT) level, necrotic areas by liver histology, hepatocyte death, and local hepatic inflammatory responses. Signal pathways were explored in vivo and in vitro to identify possible mechanisms for TSLP in I/R injury. TSLP and TSLPR protein expression increased during liver I/R in vivo and following hepatocyte hypoxia/reoxygenation in vitro. Deletion of TSLPR or neutralization of TSLP with anti-TSLP antibody exacerbated liver injury in terms of serum ALT levels as well as necrotic areas in liver histology. Administration of exogenous recombinant mouse TSLP to WT mice significantly reduced liver damage compared with controls, but failed to prevent I/R injury in TSLPR-/- mice. TSLP induced autophagy in hepatocytes during liver I/R injury. Mechanistically, Akt was activated in WT mice during liver I/R injury. The opposite results were observed in TSLPR-/- mice. In addition, TSLP could directly induce Akt activation in hepatocytes independent of nonparenchymal cells in vitro. Furthermore, the Akt agonist, insulin-like growth factor-1 (IGF-1), prevented I/R injury in TSLPR-/- mice and an Akt inhibitor, LY294002, blocked the protective effects of TSLP in WT mice subjected to I/R. Our data indicate that TSLP protects against liver I/R injury via activation of the PI3K/Akt pathway. Through this pathway, TSLP induces autophagy in hepatocytes. Thus, TSLP is a potent inhibitor of stress-induced hepatocyte necrosis.

Keywords: Apoptosis; Hepatology.


Conflict of interest statement

Conflict of interest: The authors have declared that no conflict of interest exists.

Figures

Figure 1
Figure 1. TSLP and TSLPR protein expression increase after liver I/R injury in vivo and H/R in vitro.
(A) TSLP and TSLPR protein expression in liver from WT mice in sham surgery (Sham) or ischemia/reperfusion (I/R; ischemia for 1 hour, reperfusion for 0, 1, 3, 6, 12, or 24 hours) groups were assessed with Western blot. GAPDH served as a loading control. (B) TSLP protein expression of WT and TSLPR–/– mice was assessed in liver (by Western blot) and serum (by ELISA, right) after liver I/R injury (I: 1 hour; R: 6 hours). All data are shown as the mean ± SEM. n = 5 in sham groups, n = 6 in liver I/R groups. NS, no significance. (C and D) TSLP and TSLPR protein expression in primary WT hepatocytes (C) and nonparenchymal cells (D) subjected to hypoxia for 10 hours (1% oxygen) and then reoxygenation for different time points (0, 2, 4, 6, 8, 10, and 12 hours) (H/R). (E) Primary WT hepatocytes (HC) and nonparenchymal cells (NPC) were cultured either in normal oxygen (control group) or in hypoxia for 10 hours (1% oxygen) and then reoxygenation for 8 hours (H/R group). TSLP protein levels in supernatant were assessed with Western blot. For Western blot results, figures are representative of data from multiple mice per experimental group or 3 independent in vitro experiments. ELISA data were assessed by unpaired, 2-tailed Student’s t test (B).
Figure 2
Figure 2. TSLP signaling protects against liver I/R injury.
(A) Serum ALT levels of WT and TSLPR–/– mice after sham surgery or liver I/R injury (I: 1 hour; R: 0, 1, 3, 6, or 24 hours). **P < 0.01, ***P < 0.001. n = 5 in sham groups, n = 5 in liver I/R groups (I: 1 hour; R: 0, 1, or 24 hours), n = 6 in liver I/R groups (I: 1 hour; R: 3 or 6 hours). (B) Representative H&E staining images (×20) and necrotic areas of ischemic liver lobes of WT and TSLPR–/– mice at 6 hours after reperfusion or sham controls. Dotted lines indicate measured areas of necrosis, quantified in the bar graph. **P < 0.01. n = 5 in sham groups, n = 6 in liver I/R groups. (C) Serum ALT levels of WT mice after liver I/R injury with IgG or anti-TSLP antibody treatment (100 μg/mouse, i.p. immediately after reperfusion). *P < 0.05. (D) Representative H&E staining images (×20) and necrotic areas of ischemic liver lobes of WT mice at 6 hours after reperfusion with IgG or anti-TSLP antibody treatment. Dotted lines indicate measured areas of necrosis, quantified in the bar graph. *P < 0.05. In C and D, n = 7 in IgG group, n = 6 in anti-TSLP group. (E) Serum ALT levels of WT mice after liver I/R injury with PBS or mouse recombinant TSLP protein (rTSLP) treatment (2 μg/mouse, i.p. immediately after reperfusion). *P < 0.05. (F) Representative H&E staining images (×20) and necrotic areas of ischemic liver lobes of WT mice at 6 hours after reperfusion with PBS or rTSLP protein treatment. Dotted lines indicate measured areas of necrosis, quantified in the bar graph. *P < 0.05. In E and F, n = 10 in PBS group, n = 7 in rTSLP group. (G) Serum ALT levels of TSLPR–/– mice after liver I/R injury with PBS or rTSLP treatment (2 μg/mouse, i.p. immediately after reperfusion). (H) Representative H&E staining images (×20) and necrotic areas of ischemic liver lobes of TSLPR–/– mice at 6 hours after reperfusion with PBS or rTSLP protein treatment. Dotted lines indicate measured areas of necrosis, quantified in the bar graph. In G and H, n = 6 in PBS group, n = 5 in rTSLP group. All data are shown as the mean ± SEM. P values by unpaired, 2-tailed Student’s t test (AH). NS, no significance.
Figure 3
Figure 3. TSLP induces autophagy in vivo and in vitro.
(A) Western blot showing the levels of LC3, Beclin-1, and P62 in liver of WT and TSLPR–/– mice after liver I/R injury (I: 1 hour; R: 6 hours). n = 5 in sham groups, n = 6 in liver I/R groups. (B) Western blot showing the levels of LC3 in whole-cell lysates from WT and TSLPR–/– hepatocytes subjected to normoxia or H/R (H: 10 hours; R: 8 hours) with/without bafilomycin A1 (50 nM). Volume of LC3 II bands measured by ImageJ software and represented in bar graph relative to GAPDH loading control. Images are representative of data from at least 3 independent in vitro experiments. **P < 0.01, *P < 0.05. (C) Confocal microscopy images of WT and TSLPR–/– hepatocytes overexpressing GFP-LC3 (green) and Hoechst nuclear stain (blue) and subjected to normoxia or H/R (H: 10 hours; R: 8 hours) and with/without 60-minute bafilomycin A1 (50 nM) treatment (original magnification, ×40). GFP-LC3 puncta were counted per cell and are represented in the bar graph. *P < 0.05. All data are shown as the mean ± SEM. P values by unpaired, 2-tailed Student’s t test (B and C). For Western blot results, figures are representative of data from multiple mice per experimental group or 3 independent in vitro experiments. NS, no significance.
Figure 4
Figure 4. Hepatoprotective effects of TSLP in liver I/R injury are not mediated by regulating cytokine levels.
(A) Relative mRNA levels of IL-6 were assessed by qRT-PCR in liver tissues from WT mice and TSLPR–/– mice in sham or I/R (I: 1 hour; R: 1, 3, or 6 hours) groups. (B) Plasma IL-6 levels of WT and TSLPR–/– mice after sham surgery or liver I/R injury (I: 1 hour; R: 1, 3, or 6 hours). n = 5 in sham groups, n = 5 in liver I/R groups (I: 1 hour; R: 1 hour), n = 6 in liver I/R groups (I: 1 hour; R: 1, 3, or 6 hours). (C) Relative mRNA levels of TNF-α were assessed by qRT-PCR in liver tissues from WT mice and TSLPR–/– mice in sham or I/R (I: 1 hour; R: 1, 3, or 6 hours) groups. In A and C, GAPDH served as a control. Results are expressed as the relative fold increase from 3 experiments compared with control. All data are shown as the mean ± SEM. P values by unpaired, 2-tailed Student’s t test (AC). NS, no significance.
Figure 5
Figure 5. TSLP activates the PI3K/Akt pathway in liver I/R injury.
(A) Western blot showing the levels of total and phosphorylated Akt in liver of WT and TSLPR–/– mice after liver I/R injury. (B and C) Western blots showing the levels of total and phosphorylated Akt in liver of WT and TSLPR–/– mice after liver I/R injury with different treatments: IgG (100 μg/mouse), anti-TSLP (100 μg/mouse), PBS, and rTSLP (2 μg/mouse) were administered i.p. immediately after reperfusion. Each lane represents a separate animal. The blots shown are representative of 3 experiments with similar results.
Figure 6
Figure 6. TSLP induces Akt phosphorylation in vitro.
(A) Western blot showing the levels of total and phosphorylated Akt in primary WT and TSLPR–/– hepatocytes (HC) or nonparenchymal cells (NPC) subjected to control or hypoxia for 10 hours (1% oxygen) and then reoxygenation for 8 hours (H/R). For coculture group, HC and NPC were cultured together and then subjected to control or H/R. (B) Western blot showing the levels of total and phosphorylated Akt in primary WT HC after receiving different doses of rTSLP (10 ng/mL, 50 ng/mL, 100 ng/mL, and 500 ng/mL) treatment for 2 hours. (C) Western blot showing the levels of total and phosphorylated Akt in primary WT HC after receiving rTSLP (100 ng/mL) treatment at different time points (10 minutes, 30 minutes, 1 hour, 2 hours, 4 hours, 8 hours, and 24 hours). (D) Western blot showing the levels of total and phosphorylated Akt in primary WT or TSLPR–/– HC and HC cocultured with NPC after receiving rTSLP (100 ng/mL) treatment for 2 hours. The blots shown are representative of 3 experiments with similar results.
Figure 7
Figure 7. TSLP protects against liver I/R injury via PI3K/Akt pathway.
(A) Western blot showing the levels of total and phosphorylated Akt in liver of TSLPR–/– mice after liver I/R injury (I: 1 hour; R: 6 hours) with PBS or Akt agonist insulin-like growth factor-1 (IGF-1) (2 doses, 100 μg/kg/dose, subcutaneous injection, one dose starting immediately before surgical procedure, another dose starting immediately after reperfusion) treatment. (B) Serum ALT levels of TSLPR–/– mice after liver I/R injury with PBS or IGF-1 treatment. ***P < 0.001. (C) Representative H&E staining images (×20) and necrotic areas of ischemic liver lobes of TSLPR–/– mice at 6 hours after reperfusion with PBS or IGF-1 treatment. Dotted lines indicate measured areas of necrosis, quantified in the bar graph. **P < 0.01. In AC, n = 8 in PBS group, n = 5 in IGF-1 group. (D) Western blot showing the levels of total and phosphorylated Akt in liver of WT mice after liver I/R injury with PBS or LY294002 plus PBS or LY294002 plus rTSLP treatment (LY294002 [0.5 mg/kg] was administered i.p. 30 minutes before surgery; PBS and rTSLP [2 μg/mouse] were administered i.p. immediately after reperfusion). (E) Serum ALT levels of WT mice after liver I/R injury with LY294002 plus PBS or LY294002 plus rTSLP treatment. (F) Representative H&E staining images (×20) and necrotic areas of ischemic liver lobes of WT mice at 6 hours after reperfusion with LY294002 plus PBS or LY294002 plus rTSLP treatment. Dotted lines indicate measured areas of necrosis, quantified in on the bar graph. In DF, n = 6 per group. (G) Western blot showing the levels of total Akt, phosphorylated Akt, and LC3 in liver of WT mice after liver I/R injury with PBS or LY294002 plus PBS or rTSLP treatment. The Western blots shown are representative of 3 experiments with similar results. All data are shown as the mean ± SEM. P values by unpaired, 2-tailed Student’s t test (B, C, E, and F). NS, no significance.

References

    1. Nastos C, et al. Global consequences of liver ischemia/reperfusion injury. Oxid Med Cell Longev. 2014;2014:906965. - PMC - PubMed
    1. van Riel WG, van Golen RF, Reiniers MJ, Heger M, van Gulik TM. How much ischemia can the liver tolerate during resection? Hepatobiliary Surg Nutr. 2016;5(1):58–71. - PMC - PubMed
    1. Peralta C, Jiménez-Castro MB, Gracia-Sancho J. Hepatic ischemia and reperfusion injury: effects on the liver sinusoidal milieu. J Hepatol. 2013;59(5):1094–1106. doi: 10.1016/j.jhep.2013.06.017. - DOI - PubMed
    1. Leonard WJ. TSLP: finally in the limelight. Nat Immunol. 2002;3(7):605–607. doi: 10.1038/ni0702-605. - DOI - PubMed
    1. Ziegler SF, Roan F, Bell BD, Stoklasek TA, Kitajima M, Han H. The biology of thymic stromal lymphopoietin (TSLP) Adv Pharmacol. 2013;66:129–155. doi: 10.1016/B978-0-12-404717-4.00004-4. - DOI - PMC - PubMed

Publication types

MeSH terms