. 2019 Nov 13;10(1):5139.
doi: 10.1038/s41467-019-12926-8.

Rapid evolution and biogeographic spread in a colorectal cancer

Affiliations

Rapid evolution and biogeographic spread in a colorectal cancer

Joao M Alves et al. Nat Commun. .

Abstract

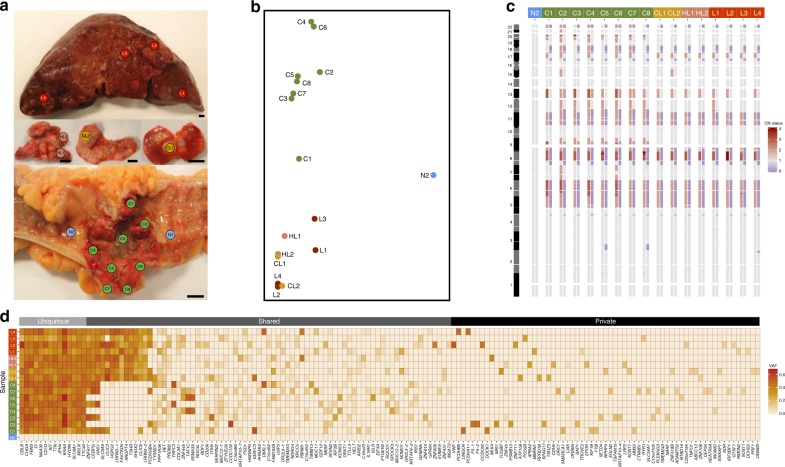
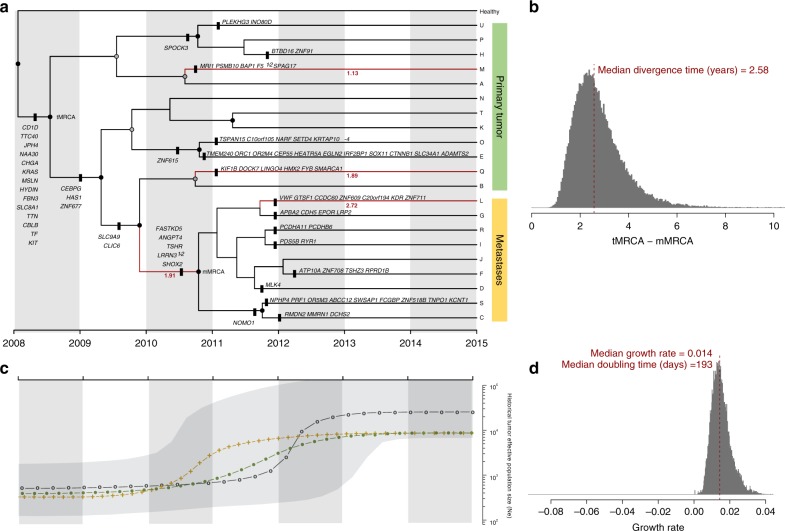
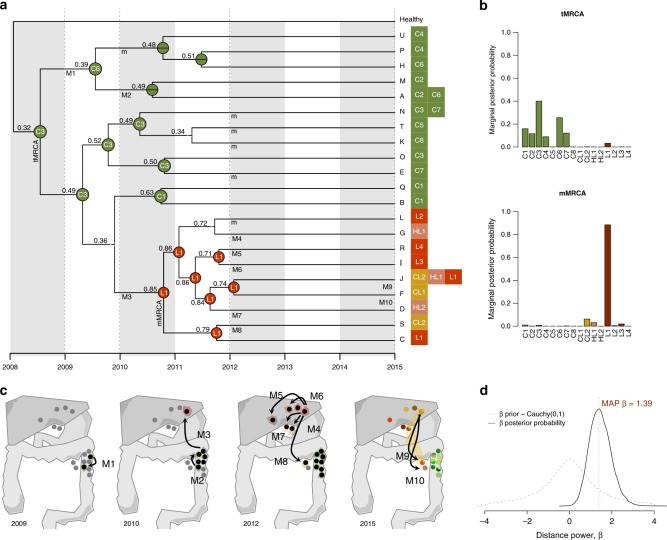
How and when tumoral clones start spreading to surrounding and distant tissues is currently unclear. Here we leveraged a model-based evolutionary framework to investigate the demographic and biogeographic history of a colorectal cancer. Our analyses strongly support an early monoclonal metastatic colonization, followed by a rapid population expansion at both primary and secondary sites. Moreover, we infer a hematogenous metastatic spread under positive selection, plus the return of some tumoral cells from the liver back to the colon lymph nodes. This study illustrates how sophisticated techniques typical of organismal evolution can provide a detailed, quantitative picture of the complex tumoral dynamics over time and space.


Conflict of interest statement

The authors declare no competing interests.

Figures

Fig. 1
Fig. 1
Genomic profiles of bulk tumor samples. a Multiregional sampling scheme. A total of 18 samples were collected, including two samples from healthy tissue (in blue), eight from the primary tumor (green), two from proximal colonic lymph nodes (gold), two from distal hepatic lymph nodes (salmon), and four from liver metastasis (red). Scale bar: 1 cm. b Principal component analysis (PCA) with variant allele frequencies (VAF) for all 475 somatic mutations detected. Each circle corresponds to a given sample, with colors highlighting the anatomical regions. c Heatmap depicting genome-wide allele-specific copy-number status (from 0 in blue to 4 in red) of healthy and tumor samples. Sample IDs are shown at the top. d Heatmap with the observed allele frequencies (from 0 in white to 0.65 in red) of somatic mutations identified in the sequenced samples. Here only the non-synonymous mutations are shown (n = 156), sorted according to their mean VAF across all tumor samples. Gene names are displayed at the bottom of the map. Each row represents a single sample
Fig. 2
Fig. 2
Phylogenetic and demographic reconstruction over time. a Maximum clade credibility (MCC) tree resulting from the BEAST analyses using the CloneFinder-derived clones. Tree nodes with posterior probability values >0.99 and >0.50 are indicated with black and gray solid circles, respectively. Clone IDs (A–U) are shown at the tips of the tree. The x-axis is scaled to years (assuming one generation every 4 days; see Methods). Only non-synonymous mutations are shown. Tree branches showing a dN/dS ratio >1 are highlighted in red together with the corresponding dN/dS value. b Posterior probability distribution of the relative divergence time in years of mMRCA in relation to the tMRCA (tMRCA minus mMRCA). The dashed red line depicts the median age estimate of the mMRCA. c Bayesian Skyline Plot analysis. The y-axis is in log scale. The black dotted line represents the historical effective population size of the entire cancer cell population (Ne). The gray shading illustrates the 95% HPD interval. Green and golden dotted lines correspond to the effective population sizes of the primary and metastatic populations, respectively. d Histogram illustrating the growth rate per generation of the tumor. The population doubling time is shown in days
Fig. 3
Fig. 3
Inferred biogeographic history. a Biogeographic reconstruction from BayArea, describing the geographical range (i.e., the set of occupied locations) of the ancestral clones. At each tree node, the range with the highest posterior probability is depicted. The sample ID is shown for those ancestral nodes whose inferred area ranges are restricted to a single location. The locations where the extant clones (A–U) were sampled are shown next to the tips. Migration events are depicted in the panel below represented by an uppercase “M” and numbered (M1–M10). A lowercase “m” indicates the remaining migrations inferred. b Marginal posterior probabilities for the occupancy at single locations for the tumoral (tMRCA) and metastatic (mMRCA) ancestral clones. c Schematic representation of the clonal dynamics in anatomical space over four time points. From 2009 to 2012, samples where BayArea inferred the presence of tumor clones are highlighted in black. Colored areas surrounding samples anatomical location represent the inferred spatial distribution of the clonal populations. Arrows highlight the inferred migration events. d Comparison of the distance-dependent/independent dispersal models. The dashed gray line corresponds to the prior distribution for the distance power parameter, β~Cauchy(0,1). The solid black line indicates the posterior distribution obtained. The vertical dashed red line indicates the maximum a posteriori estimate of β

References

    1. Nowell P. The clonal evolution of tumor cell populations. Science. 1976;194:23–28. doi: 10.1126/science.959840. - DOI - PubMed
    1. Gerlinger M, et al. Intratumor heterogeneity and branched evolution revealed by multiregion sequencing. N. Engl. J. Med. 2012;366:883–892. doi: 10.1056/NEJMoa1113205. - DOI - PMC - PubMed
    1. Sottoriva A, et al. A Big Bang model of human colorectal tumor growth. Nat. Genet. 2015;47:209–216. doi: 10.1038/ng.3214. - DOI - PMC - PubMed
    1. Gerlinger M, et al. Genomic architecture and evolution of clear cell renal cell carcinomas defined by multiregion sequencing. Nat. Genet. 2014;46:225–233. doi: 10.1038/ng.2891. - DOI - PMC - PubMed
    1. Naxerova K, et al. Origins of lymphatic and distant metastases in human colorectal cancer. Science. 2017;357:55–60. doi: 10.1126/science.aai8515. - DOI - PMC - PubMed

Publication types