Meta-Analysis
. 2019 Nov 13;10(1):5142.
doi: 10.1038/s41467-019-13164-8.

A meta-analysis of global fungal distribution reveals climate-driven patterns

Affiliations
Meta-Analysis

A meta-analysis of global fungal distribution reveals climate-driven patterns

Tomáš Větrovský et al. Nat Commun. .

Abstract

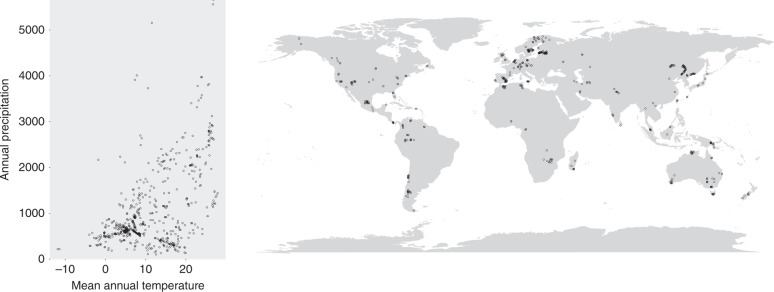
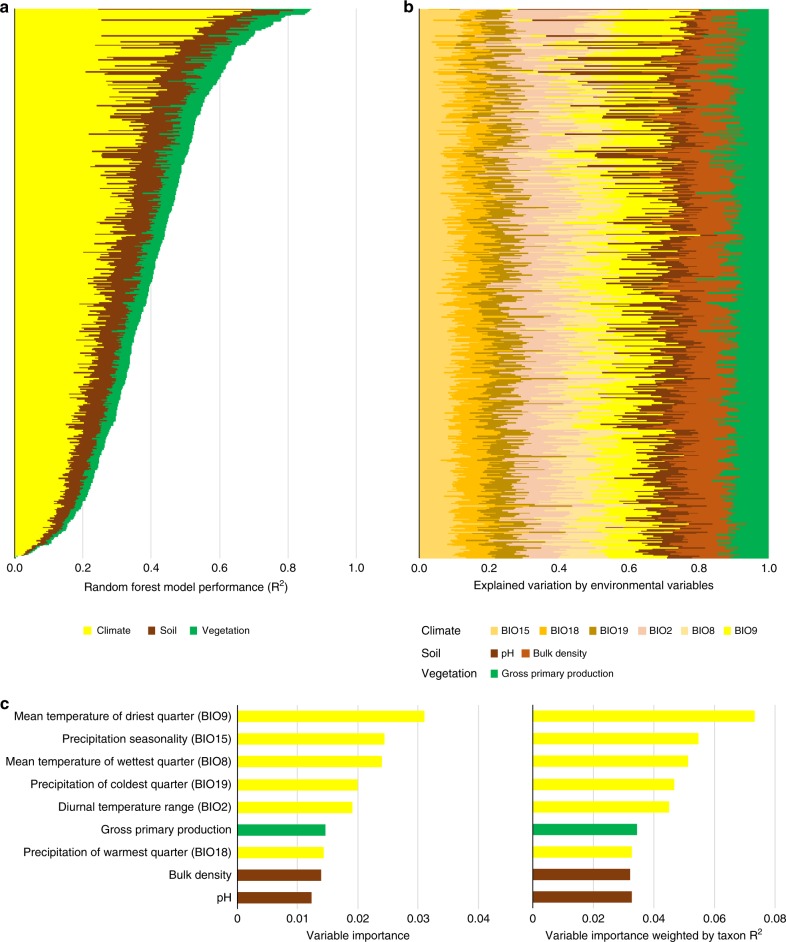
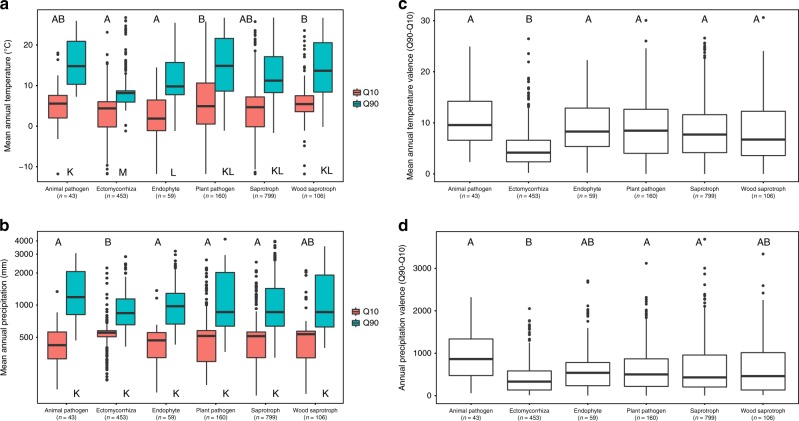
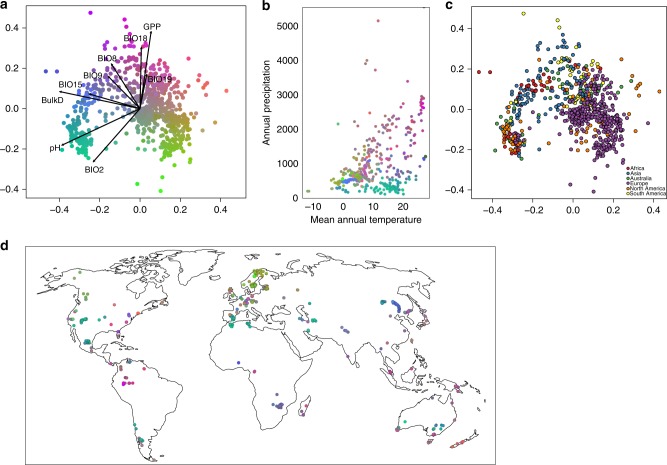
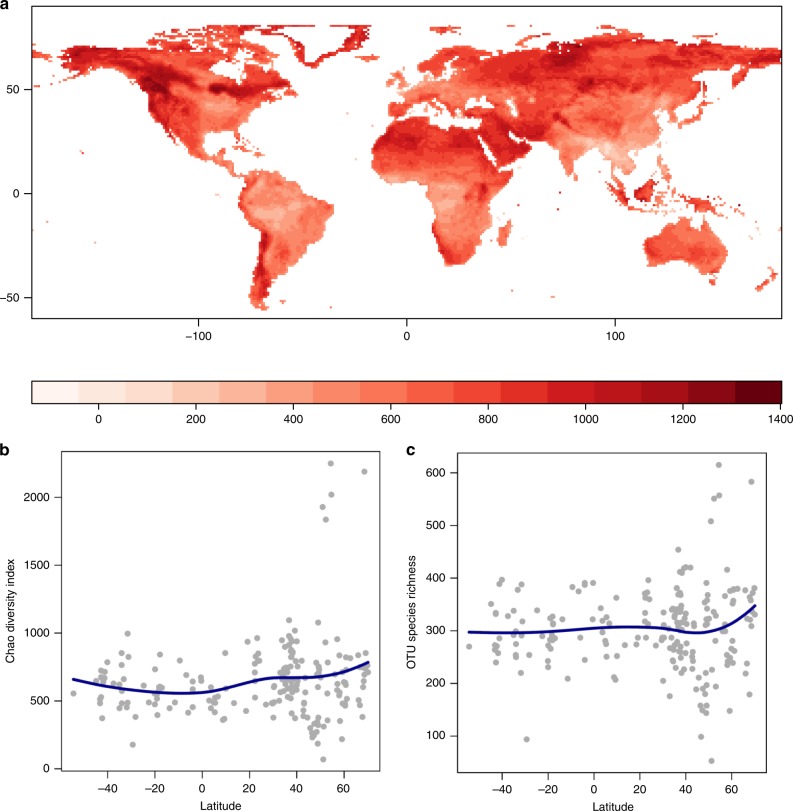
The evolutionary and environmental factors that shape fungal biogeography are incompletely understood. Here, we assemble a large dataset consisting of previously generated mycobiome data linked to specific geographical locations across the world. We use this dataset to describe the distribution of fungal taxa and to look for correlations with different environmental factors such as climate, soil and vegetation variables. Our meta-study identifies climate as an important driver of different aspects of fungal biogeography, including the global distribution of common fungi as well as the composition and diversity of fungal communities. In our analysis, fungal diversity is concentrated at high latitudes, in contrast with the opposite pattern previously shown for plants and other organisms. Mycorrhizal fungi appear to have narrower climatic tolerances than pathogenic fungi. We speculate that climate change could affect ecosystem functioning because of the narrow climatic tolerances of key fungal taxa.


Conflict of interest statement

The authors declare no competing interests.

Figures

Fig. 1
Fig. 1
Mean annual temperature and annual precipitation of the analysed samples and their geographic distributions
Fig. 2
Fig. 2
Environmental variables explaining the global distribution of the most frequent fungal taxa. a Random forest model performance for 457 fungal taxa where out-of-bag R2 > 0. b Contribution of climatic, soil and vegetation variable categories to the variation explained by the complete random forest model for each fungal taxon. c Importance of individual environmental variables across models for all fungal taxa showing raw variable importance and variable importance weighted by out-of-bag R2 for each taxon
Fig. 3
Fig. 3
Climatic determinants of ecological guilds of fungi. a The first and ninth deciles of sample mean annual temperature and b annual precipitation for SHs belonging to selected ecological guilds with occurrence in >10 samples. c Ecological variance of mean annual temperature and d annual precipitation of these SHs expressed as the difference between the ninth and tenth deciles. The boxes marked with different letters are significantly different at the p < 0.05 according to Kruskal–Wallis with post hoc Nemenyi tests. In boxplots, middle line represents median, upper and bottom horizontal lines represent third and first quartile, whiskers represent maximum and minimum values below the upper and lower fence and points represent outliers
Fig. 4
Fig. 4
Variation in community composition of fungal SH is driven by climate, but only weakly structured by dispersal. a Three-dimensional non-metric multidimensional scaling of fungal community composition based on Bray–Curtis dissimilarities (stress = 0.13). The figure shows the first two ordination axes, but the third ordination axis is captured through the rgb colour coding of the samples. All environmental variables used in the random forest models are passively projected onto the ordination space. b Mean annual temperatures and annual precipitation of all analysed samples coloured as in panel (a). c The same ordination as in (a), but with samples coloured according to the continents, suggests relatively weak geographic patterns in the data. d Geographic distribution of the samples. The samples are coloured as in panel a; the more similar the colour is, the more similar the community composition of the samples
Fig. 5
Fig. 5
Inferred patterns of fungal species diversity predicted by the best-subset GLM. a The Chao index of the OTU diversity projection (model R2 = 17.2%); b latitudinal gradient fitted by the means of the non-parametric smoothing of the Chao index; c latitudinal gradient fitted by the means of the non-parametric smoothing of the OTU richness

References

    1. Peay KG, Kennedy PG, Talbot JM. Dimensions of biodiversity in the Earth mycobiome. Nat. Rev. Microbiol. 2016;14:434–447. doi: 10.1038/nrmicro.2016.59. - DOI - PubMed
    1. Amundson R, et al. Soil and human security in the 21st century. Science. 2015;348:1261071. doi: 10.1126/science.1261071. - DOI - PubMed
    1. Crowther TW, et al. Quantifying global soil carbon losses in response to warming. Nature. 2016;540:104–108. doi: 10.1038/nature20150. - DOI - PubMed
    1. Wall DH, Nielsen UN, Six J. Soil biodiversity and human health. Nature. 2015;528:69–76. doi: 10.1038/nature15744. - DOI - PubMed
    1. Hillebrand H. On the generality of the latitudinal diversity gradient. Am. Nat. 2004;163:192–211. doi: 10.1086/381004. - DOI - PubMed

Publication types