. 2019 Nov 13;10(1):5143.
doi: 10.1038/s41467-019-13161-x.

Clonal selection confers distinct evolutionary trajectories in BRAF-driven cancers

Affiliations

Clonal selection confers distinct evolutionary trajectories in BRAF-driven cancers

Priyanka Gopal et al. Nat Commun. .

Abstract

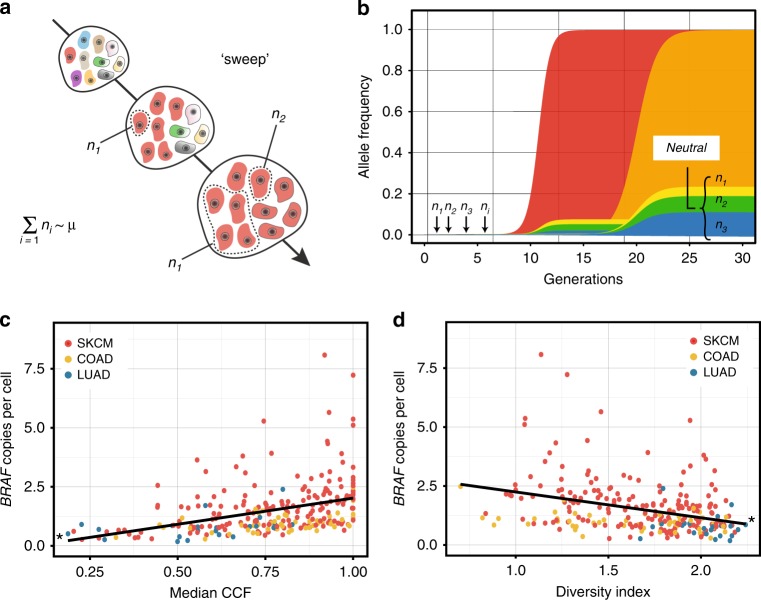
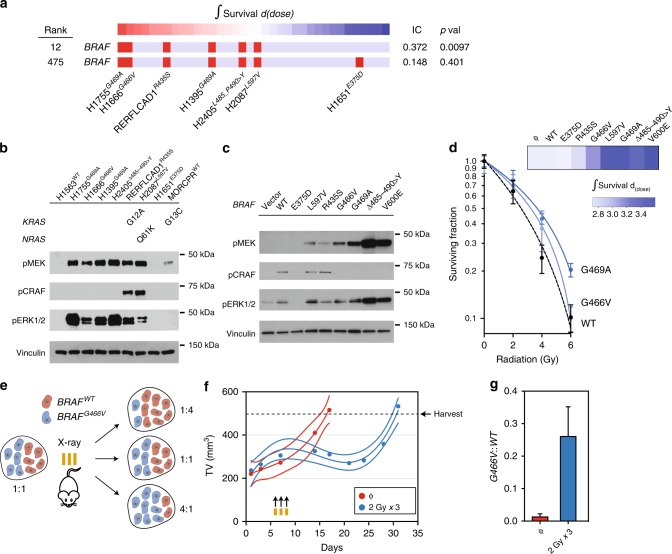
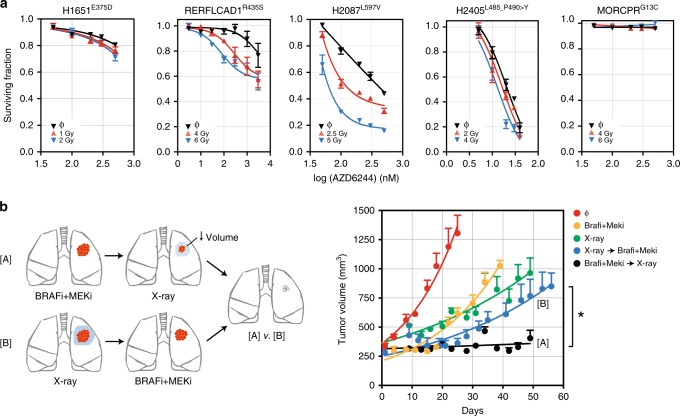
Molecular determinants governing the evolution of tumor subclones toward phylogenetic branches or fixation remain unknown. Using sequencing data, we model the propagation and selection of clones expressing distinct categories of BRAF mutations to estimate their evolutionary trajectories. We show that strongly activating BRAF mutations demonstrate hard sweep dynamics, whereas mutations with less pronounced activation of the BRAF signaling pathway confer soft sweeps or are subclonal. We use clonal reconstructions to estimate the strength of "driver" selection in individual tumors. Using tumors cells and human-derived murine xenografts, we show that tumor sweep dynamics can significantly affect responses to targeted inhibitors of BRAF/MEK or DNA damaging agents. Our study uncovers patterns of distinct BRAF clonal evolutionary dynamics and nominates therapeutic strategies based on the identity of the BRAF mutation and its clonal composition.


Conflict of interest statement

M.E.A. receives grant support, travel support, and honoraria from Bayer AG and receives grant support from Siemens Medical Solutions, USA in subject matter or material not directly related to this work. The other authors disclose no potential conflicts of interest.

Figures

Fig. 1
Fig. 1
The landscape of genetic drivers in BRAF features distinct variants. a The size of the circle corresponds to the number of variants at that amino acid position. Variants that occupied a unique position are annotated. The vast majority of BRAF variants were found once in a single cancer type. b, c Secondary (non-V600) variant frequency peaks occur in residues that comprise the A-loop, the P-loop and residues critical for Mg+2 chelation. The catalytic D576 (C-loop), which is in a cleft between the N- and C-lobes, is shown. d The relative proportion of the 10 most frequent variants in the four most common cancer types are shown. e Clock plot of BRAF signature score in BEAS-2B cells expressing vector control (ϕ), wild-type (WT) or 35 BRAF variants. Red and blue represents cells with the most and least BRAF activity, respectively. f BEAS-2B cells stably infected with vector alone (ϕ) or vector expressing BRAF alleles were injected into the flanks of NSG mice and monitored for growth. The association between the BRAF signature score and the time for tumor volume to reach 1 cm3 is shown in the inset. Tumor volume is expressed as the mean ± s.d. of at least six independent biological replicates
Fig. 2
Fig. 2
Measuring BRAF-variant fitness in sequencing data. a Subclones with low or high fitness advantages achieve fixation at distinct rates when under selection. Tumor and subclone ages were 100 and five generations, respectively. b Allelic fractions for mutations in three representative tumors from TCGA were rescaled to estimates of cancer cell fraction (CCF) by correcting for sample purity and local copy-number. The position of the BRAF-variant CCF is designated in red. c The relative frequency of BRAF-variant CCF values across cancer type is shown. SKCM was further stratified by the hyperactivating mutations V600 and K601. d Proportion of tumors with estimated subclonal BRAF-drivers across cancer types. e The clonal evolutionary structure of each tumor is depicted in the form of a rooted tree. The tree with the lowest normalized log likelihood value (“best tree”)”) is shown for representative tumors from each cancer type. Cancer types are organized by color: LUAD (blue), COAD (yellow) and SKCM (red). The root node represents the clonal fraction and branched nodes represent subclones. Node size reflects the number of mutations that constitute the (sub)clone. Arrows indicate the position of the BRAF variant(s) in the tree. f Box-plot (median, inter-quartile range, and minimum/maximum) of linearity and branched indices for evaluable tumors across the designated cancer types are shown. Only primary (non-metastatic) tumors were evaluated. The P-value of Welch’s t-test comparing SKCM to LUAD was <0.05 and <0.01 for linearity and branching, respectively
Fig. 3
Fig. 3
BRAF mutation is frequently followed by variant-selective amplification in SKCM. a Co-occurring (blue) and mutually exclusive (red) copy number and other mutation events with BRAF mutations. P-values were calculated using the pairwise Fisher’s exact test. b Violin plot of BRAF mRNA organized by putative copy number alteration frequency estimated by GISTIC. The horizontal line connects median values of mRNA expression in each group. c The proportion of tumors with copy gains organized by BRAF genotype and cancer type. The P-value of the binomial test was <0.05. Confidence intervals were calculated by the Clopper and Pearson exact test. d GISTIC analysis of copy-number changes in each cancer type. FDR values account for multiple-hypothesis testing. The significance threshold is indicated by the green line. The locations of the peak regions are indicated to the right of each panel. Chromosome positions are indicated along the y-axis with centromere positions indicated by dotted lines. The blue band delimits chromosome 7. The arrowhead indicates the position of focal amplification at 7q34 is SKCM. e Probability density function of BRAF VAF in LUAD, COAD, or SKCM. The mean is indicated in dashed line. The P-value of Welch’s t-test comparing the mean of SKCM to LUAD or COAD were <0.0001. f The dependence of VAF on the phylogenetic relationship between a locus-specific somatic copy-number gain (SCNA) and single-nucleotide variant (SNV). g Scatter plot and linear regression (dashed line) of cVAF and absolute copy-number stratified by cancer type. The slope is non-zero ( P < 0.0001). h Allelic fractions were reinterpreted as average variant copies per cancer cell (or multiplicity). Box-plots show the median, the inter-quartile range, and the minimum/maximum after excluding potential outliers. The P-value of Welch’s t-test comparing the means of SKCM to LUAD or COAD were <0.0001
Fig. 4
Fig. 4
BRAF-variant multiplicity regulates subclonal dynamics. a Schematic of a selective sweep. The subclone under selection is in red. Progression along the arrow represents evolving clonal architecture. The accumulation of the ith passenger alleles associated with the subclone during selection (or hitch-hikers) is shown. μ is the neutral mutation rate. There is decreased genetic diversity as a result of the yielding of tumor subclones to a single clonal cluster if there is a rapid or hard selective sweep. b Modeling of the frequency trajectory of a new adaptive and ith passenger mutation during a selective sweep. Sweep parameters are s = 2.0 (hard) or 1.1 (soft) and μ = 0.001. The linear associations between the BRAF-variant multiplicity and the median c CCF or d genetic diversity across cancer types are shown. The slopes are non-zero (P < 0.0001)
Fig. 5
Fig. 5
BRAF-variant identity and multiplicity regulates tumor responses to targeted therapies. a Cells with higher BRAF variants copies per cell (and higher CCF) were more sensitive to MEK1/2 (AZD6244 or PD318088) or BRAF (PLX-4032) inhibition. AUC, area under the curve. CCF values for individual cells are designated by the heatmap. b NSG mice bearing PDX with the indicated BRAF mutation and copies per cell were treated with dabrafenib (BRAFi) and trametinib (MEKi). Data are expressed as the mean ± s.d. The P-value of the χ2-test between the control and treatment groups was <0.05, <0.001, <0.0001. c Schematic depicting the co-culturing of cells expressing BRAFV600E or BRAFG466V and vector alone. After 48 of Dox-induction, cells were treated with either d dabrafenib (BRAFi) or e trametinib (MEKi). Cellular survival was measured 5 days after drug treatment. Data are expressed as the area under the curve (AUC) and represent the mean ± s.e.m. of at least three independent experiments
Fig. 6
Fig. 6
Hypermorphic BRAF variants confer resistance to genotoxic stress in LUAD. a Association between integral survival and BRAF genotype in 28 LUAD cell lines. Red bar represents mutation. BRAF mutation ranked 12 out of 6743 genomic features after outlier exclusion. The P-values were calculated using the empirical permutation test. b Immunoblot analysis of representative cell lines profiled for radiation sensitivity. c BEAS-2B cells stably infected with vector alone (ϕ) or vector expressing BRAF variants were profiled for RAF-MEK-ERK pathway activity by immunoblot. d BEAS-2B cells in c were treated with ionizing radiation and cell number was determined on days 7–9. Representative curves are shown. Data points represent mean ± s.e.m. The heatmap of integral survival is organized by the order of all of the transduced cells in c. e Schematic depiction of the experimental design used in f. f BEAS-2B cells expressing BRAF G466V or wild-type (WT) were injected into the flank of NSG mice and block randomized into each treatment arm: Mock (ϕ) or X-ray (2 Gy × 3). Tumor volumes were measured at least twice weekly. Data represent the mean. Solid line represents the interpolation of mean using a third order polynomial fit. Dashed lines represent the 95% confidence interval of the polynomial fit. n = 5 independent animals for each condition. g The ratio of G466V to WT was determined in the harvested tumors (at a volume of ~500 mm3) using ddPCR. The proportion in each arm was normalized to the fractional abundance in cells expressing G466V alone. Data are expressed as the mean ± s.e.m. of three independent experiments
Fig. 7
Fig. 7
Optimal therapeutic strategies for categories of hypermorphic BRAF variants in LUAD. a Cells were incubated with AZD6244 for 24 h and treated as control (0 Gy) or with radiation. Survival is measured by proliferation assay. Data points represent mean ± s.e.m. b Schematic depicting sequential treatment strategies for hyperactivating mutations in BRAF. NSG mice bearing LUAD PDX with V600E mutation in the flank were block randomized into one of five treatments arms as shown. Dabrafenib and trametinib were given together for 14 days. Radiation (X-ray) was delivered over three consecutive days to a total dose of 6 Gy. Sequential treatments were given at least 24 h after the completion of the first therapy. Data are expressed as the mean ± s.e.m; n= 5 independent animals for each arm. The P-value of the χ2-test between [A] and [B] was <0.001

References

    1. Chapman PB, et al. Improved survival with vemurafenib in melanoma with BRAF V600E mutation. N. Engl. J. Med. 2011;364:2507–2516. doi: 10.1056/NEJMoa1103782. - DOI - PMC - PubMed
    1. Lynch TJ, et al. Activating mutations in the epidermal growth factor receptor underlying responsiveness of non-small-cell lung cancer to gefitinib. N. Engl. J. Med. 2004;350:2129–2139. doi: 10.1056/NEJMoa040938. - DOI - PubMed
    1. Slamon DJ, et al. Use of chemotherapy plus a monoclonal antibody against HER2 for metastatic breast cancer that overexpresses HER2. N. Engl. J. Med. 2001;344:783–792. doi: 10.1056/NEJM200103153441101. - DOI - PubMed
    1. Hyman DM, et al. HER kinase inhibition in patients with HER2- and HER3-mutant cancers. Nature. 2018;554:189–194. doi: 10.1038/nature25475. - DOI - PMC - PubMed
    1. Hyman DM, et al. Vemurafenib in multiple nonmelanoma cancers with BRAF V600 mutations. N. Engl. J. Med. 2015;373:726–736. doi: 10.1056/NEJMoa1502309. - DOI - PMC - PubMed

Publication types

Substances