. 2019 Nov 13;9(1):16671.
doi: 10.1038/s41598-019-52976-y.

Standardised Framework for Quantitative Analysis of Fibrillation Dynamics

Affiliations

Standardised Framework for Quantitative Analysis of Fibrillation Dynamics

Xinyang Li et al. Sci Rep. .

Abstract

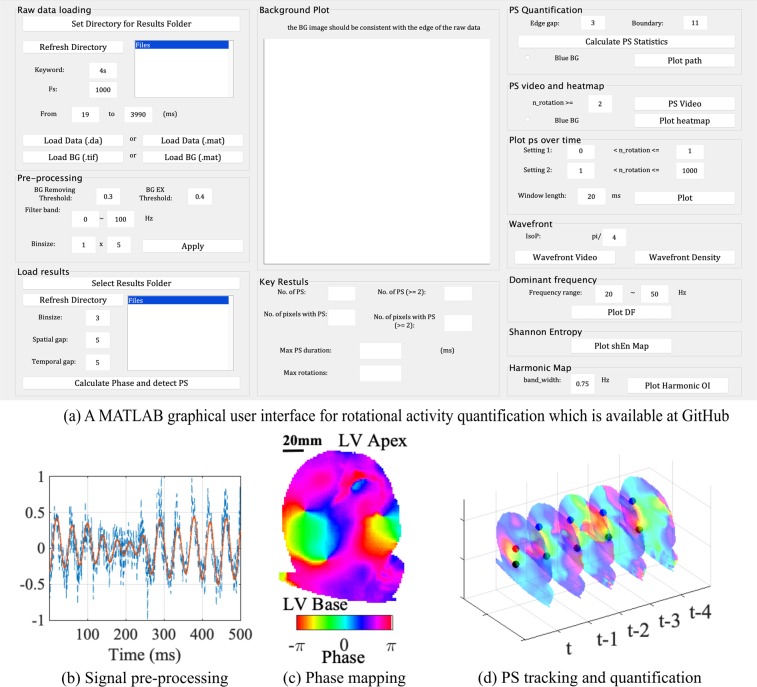
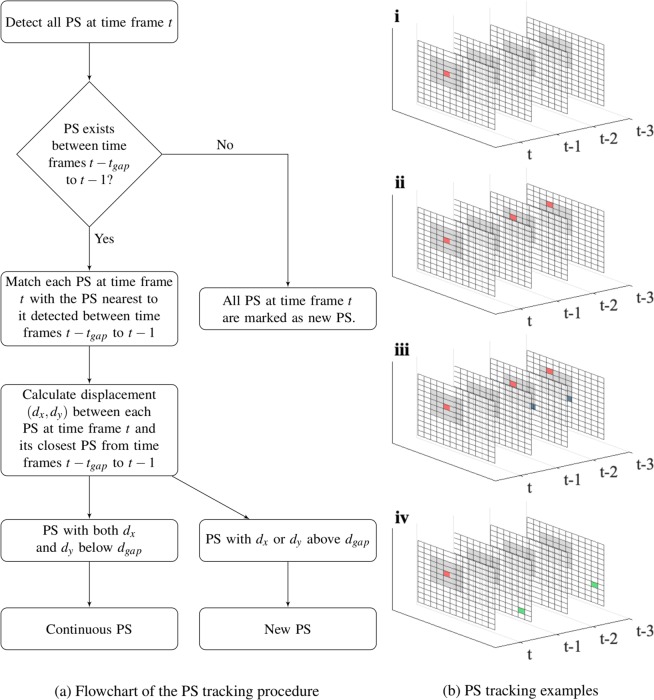
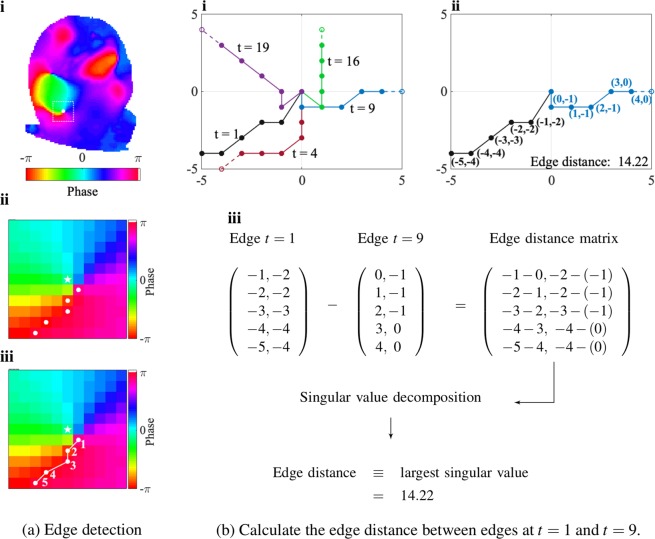
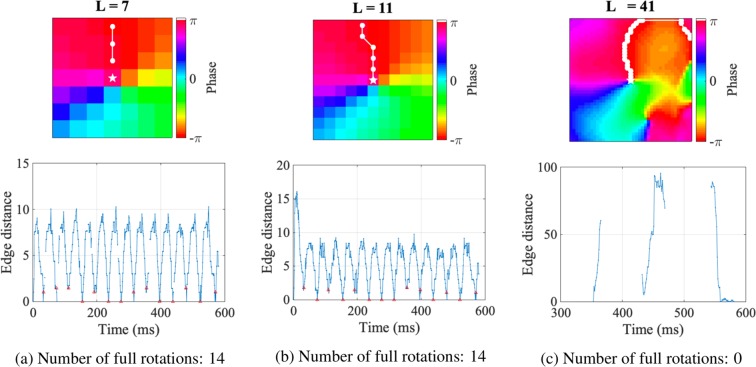
The analysis of complex mechanisms underlying ventricular fibrillation (VF) and atrial fibrillation (AF) requires sophisticated tools for studying spatio-temporal action potential (AP) propagation dynamics. However, fibrillation analysis tools are often custom-made or proprietary, and vary between research groups. With no optimal standardised framework for analysis, results from different studies have led to disparate findings. Given the technical gap, here we present a comprehensive framework and set of principles for quantifying properties of wavefront dynamics in phase-processed data recorded during myocardial fibrillation with potentiometric dyes. Phase transformation of the fibrillatory data is particularly useful for identifying self-perpetuating spiral waves or rotational drivers (RDs) rotating around a phase singularity (PS). RDs have been implicated in sustaining fibrillation, and thus accurate localisation and quantification of RDs is crucial for understanding specific fibrillatory mechanisms. In this work, we assess how variation of analysis parameters and thresholds in the tracking of PSs and quantification of RDs could result in different interpretations of the underlying fibrillation mechanism. These techniques have been described and applied to experimental AF and VF data, and AF simulations, and examples are provided from each of these data sets to demonstrate the range of fibrillatory behaviours and adaptability of these tools. The presented methodologies are available as an open source software and offer an off-the-shelf research toolkit for quantifying and analysing fibrillatory mechanisms.


Conflict of interest statement

The authors declare no competing interests.

Figures

Figure 1
Figure 1
Quantification of rotational activity with fluorescence data. (a) The MATLAB graphical user interface for rotational activity quantification, (b) signal pre-processing, (c) phase mapping, (d) PS tracking and quantification.
Figure 2
Figure 2
PS are tracked over time given pre-set spatial and temporal gaps, i.e., dgap and tgap. (a) shows the PS tracking flow chart. (b) shows four scenarios for tracking, where dgap = 3, tgap = 3, and the PS at t is marked as a red dot. In (b-i), no PS are detected in the last 3 time frames, and so the PS at t is classified as a new PS. In (b-ii), although there is a missing PS detection at t − 1, there is a PS within dgap at t − 2 and t − 3, and so the PS at t is classified as a continuous PS. In (b-iii), there exists more than one PS at t − 1 and t − 2 (in red and blue), and the red PS at t − 1 is spatially closest to the PS at t. In (b-iv), all the PS detected over the last 3 time frames are outside the grey area. Therefore, the PS at t is classified as a new PS.
Figure 3
Figure 3
With edge pixels indexed, edge distances are calculated. In (a)-i to iii, the selected PS is at the center of the white box, which shows the edge detection boundary, and the raw edge pixels are indexed according to their distances to the PS. In (b)-i, the edges at different time frames are truncated to equal length to calculate edge distance. In (b)-ii to -iii, the calculation of distance for t = 1 and t = 9 is shown.
Figure 4
Figure 4
Calculation of the number of full rotations depends on the edge detection boundary L. (ac): Edge distance and edge examples for different L. If L is either too small or too large, the edge distance metric may be discontinuous due to missed edge detections. If L is too large, points far from the PS will be detected as an edge, resulting in incorrect large values in the edge distance in (c).
Figure 5
Figure 5
Key statistics of rotational activities include duration of PS, number of rotations of PS, total number of PS and number of locations with PS. The histograms in (a,b) show that there is a higher incidence of short-lived PS than PS with ≥2 rotations. For the PS with ≥2 rotations, most have less than 20 full rotations, and only 1 exhibits more than 60 rotations, lasting over 2400 ms. (c) Shows the total number of PS, as well as the number of locations with PS as a function of time for the 2 categories of PS. The number of short-lived PS is always less than that the number of PS with over 2 rotations. However, in terms of the number of locations occupied by the PS, these two categories of PS are similar.
Figure 6
Figure 6
Assessing the organisation level of fibrillation quantified by PS/RD heat-maps. (a,b) Heat-maps of an organised and a disorganised example. In both examples, there are a greater number of short-lived PSs with <2 rotations than stable RDs with ≥2 rotations. Imposing a higher rotation threshold for RDs (≥10, ≥20) can help identify the most organised forms of VF, harbouring the most temporo-spatially stable RDs.
Figure 7
Figure 7
PS tracking and quantification methods applied to different AF/VF models. Sub-figures at the top are paths of the rotational activities of the longest duration and the bottom are incidence heat-maps (for RDs with ≥2 rotations) for the corresponding models. (a) Rat VF model 1, Nr = 23 and pD = (8, 7); (b) Rat VF model 2, Nr = 6 and pD = (21, 62); (c) Canine AF model, Nr = 5 and pD = (12, 2); and (d) Simulated canine AF model, Nr = 39 and pD = (5, 12).

References

    1. Lee J, Nam Y, McManus DD, Chon KH. Time-varying coherence function for atrial fibrillation detection. IEEE Transactions on. Biomed. Eng. 2013;60:2783–2793. doi: 10.1109/TBME.2013.2264721. - DOI - PubMed
    1. Gray RA, Pertsov AM, Jalife J. Spatial and temporal organization during cardiac fibrillation. Nature. 1998;392:75. doi: 10.1038/32164. - DOI - PubMed
    1. Pandit SV, Jalife J. Rotors and the dynamics of cardiac fibrillation. Circ. Res. 2013;112:849–862. doi: 10.1161/CIRCRESAHA.111.300158. - DOI - PMC - PubMed
    1. Laughner JI, Ng FS, Sulkin MS, Arthur RM, Efimov IR. Processing and analysis of cardiac optical mapping data obtained with potentiometric dyes. Am. J. Physiol. Circ. Physiol. 2012;303:H753–H765. doi: 10.1152/ajpheart.00404.2012. - DOI - PMC - PubMed
    1. Umapathy K, et al. Phase mapping of cardiac fibrillation. Circ. Arrhythmia Electrophysiol. 2010;3:105–114. doi: 10.1161/CIRCEP.110.853804. - DOI - PubMed

Publication types

MeSH terms