. 2019 Nov 13;9(1):16689.
doi: 10.1038/s41598-019-53167-5.

A detailed characterization of complex networks using Information Theory

Affiliations

A detailed characterization of complex networks using Information Theory

Cristopher G S Freitas et al. Sci Rep. .

Erratum in

Abstract

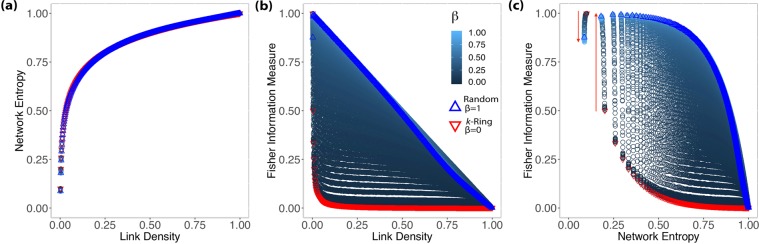
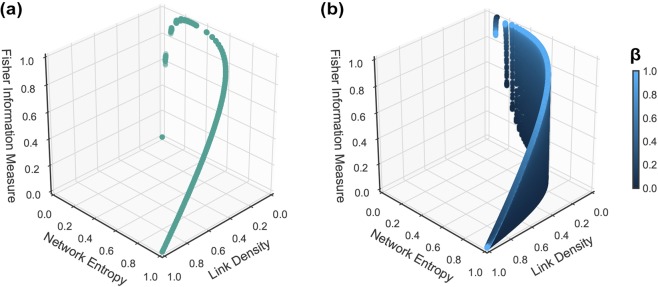
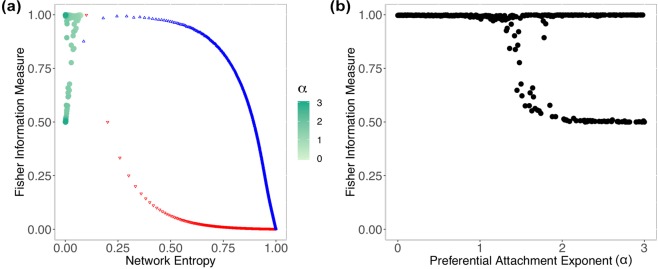
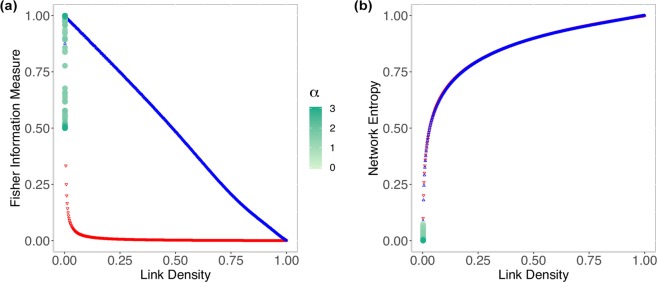
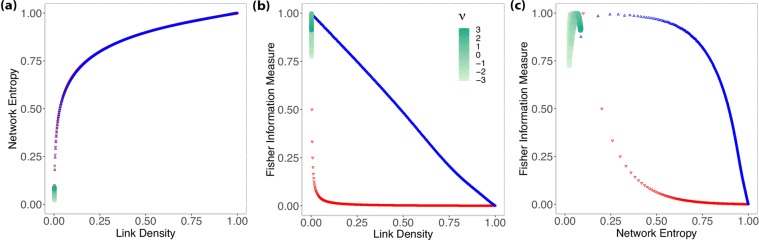
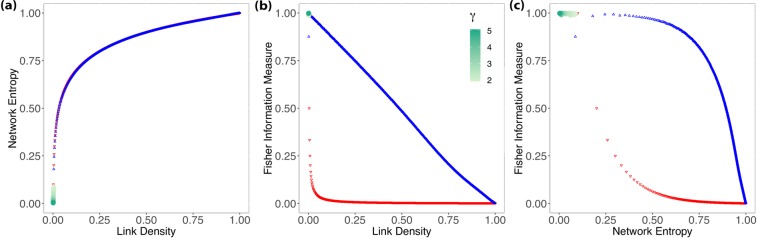
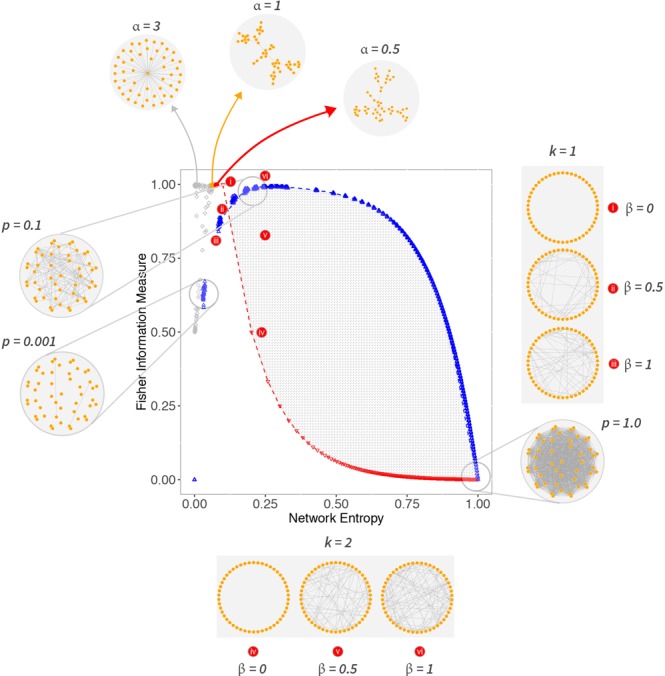
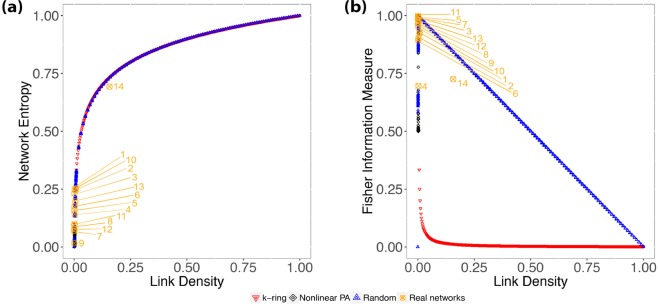
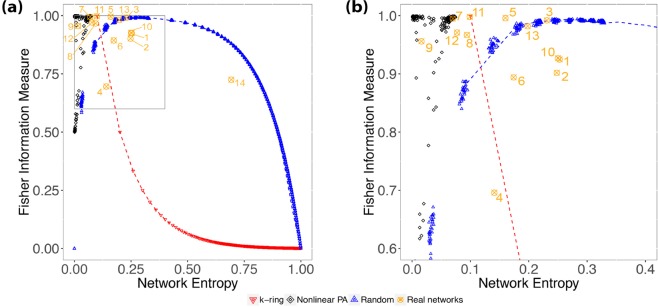
Understanding the structure and the dynamics of networks is of paramount importance for many scientific fields that rely on network science. Complex network theory provides a variety of features that help in the evaluation of network behavior. However, such analysis can be confusing and misleading as there are many intrinsic properties for each network metric. Alternatively, Information Theory methods have gained the spotlight because of their ability to create a quantitative and robust characterization of such networks. In this work, we use two Information Theory quantifiers, namely Network Entropy and Network Fisher Information Measure, to analyzing those networks. Our approach detects non-trivial characteristics of complex networks such as the transition present in the Watts-Strogatz model from k-ring to random graphs; the phase transition from a disconnected to an almost surely connected network when we increase the linking probability of Erdős-Rényi model; distinct phases of scale-free networks when considering a non-linear preferential attachment, fitness, and aging features alongside the configuration model with a pure power-law degree distribution. Finally, we analyze the numerical results for real networks, contrasting our findings with traditional complex network methods. In conclusion, we present an efficient method that ignites the debate on network characterization.


Conflict of interest statement

The authors declare no competing interests.

Figures

Figure 1
Figure 1
Results showing the relationship of Shannon Entropy and Fisher Information Measure with link density (a,b), and between Fisher Information Measure and Shannon Entropy (c) for 50 independent Erdős-Rényi networks. The dark-green circles corresponds to N = 50; the light-green squares to N = 1000; and the orange crosses to N = 10000.
Figure 2
Figure 2
Results showing the relationship between Shannon Entropy and Fisher Information Measure with link density (a,b), and between Fisher Information Measure and Shannon Entropy for Watts-Strogatz networks (c). We restricted the analysis to N = 1000, k{1,2,3,,499,500} and β{0,0.001,0.002,,0.99,1}; the downward red triangles correspond to k-rings (GN,k with β = 0); the upwards blue triangles are random graphs (GN,k with β = 1). The blue gradient from dark to light corresponds to rewiring probability β: the intensity of the blue color is inversely proportional to the value of β. The red arrows (c) identify the change of regime.
Figure 3
Figure 3
Relationship among the Network Entropy, Fisher Information Measure and link density for Erdős-Rényi (a) and Watts-Strogatz (b) networks in the ××ξ space.
Figure 4
Figure 4
(a) Shows the results for Barabási-Albert networks using a non-linear preferential attachment with N = 1000 and α[0,3]. For the sake of visualization, we plot the red downward triangles representing GWS with β = 0, i.e., k-ring graphs; and blue upward triangles representing GWS with β = 1, i.e., random graphs. (b) Shows how changing α causes disturbances in the Fisher Information Measure, when evaluating the Barabási-Albert model with non-linear PA.
Figure 5
Figure 5
(a) Shows the relationship between link density and Fisher Information Measure for Barabási-Albert networks using a non-linear preferential attachment; the gradient indicates how the preferential attachment exponent α changes. (b) Shows the relationship between the Network Entropy and link density, where ξ=0.002 for any α. To help the visualization of the region where Barabási-Albert networks stand in relation to the other synthetic networks, we plot the red downward triangles representing GWS with β = 0, i.e., k-ring graphs, and blue upward triangles representing GWS with β = 1, i.e., random graphs.
Figure 6
Figure 6
These results show the relationship between Shannon Entropy and Fisher Information Measure with link density (a,b), and between Fisher Information Measure and Shannon Entropy (c) for Biaconi-Barabási (Fitness model). Black points indicate the 30 networks with N = 1000 generated using a uniform distribution for the fitness scores of each node.
Figure 7
Figure 7
These results show the relationship between Shannon Entropy and Fisher Information Measure with link density (a,b), and between Fisher Information Measure and Shannon Entropy (c) for the Aging model. The gradient indicates the aging exponent ν[3,3] and how its growth controls the network scaling regimes.
Figure 8
Figure 8
These results show the relationship of Shannon Entropy and Fisher Information Measure with link density (a,b), and between Fisher Information Measure and Shannon Entropy (c) for the configuration model with a degree distribution following a pure power-law P(k)~kγ. The gradient indicates the degree exponent γ[2,5] and how it controls the network scaling regimes.
Figure 9
Figure 9
An overview of the most significant results for network models discussed in earlier sections. All the topologies presented have N = 50, and they are only a guide to understanding our proposal. Networks with labels p indicate ER networks; WS graphs are indexed by β and k; and α is the parameter for networks with a nonlinear preferential attachment model; other network growth models discussed in this work (e.g., fitness model) fall together with the Barabási-Albert model with nonlinear preferential attachment.
Figure 10
Figure 10
(a) Shows the relationship between link density and Network Entropy for real networks (Table 1), while (b) shows the relationship between link density and Fisher Information Measure. For the sake of visualization, we plot the red downward triangles representing GWS with β = 0, i.e., k-ring graphs, and blue upward triangles representing GWS with β = 1, i.e., random graphs.
Figure 11
Figure 11
(a) Shows the relationship between Fisher Information Measure and Shannon Entropy for the real world networks. Blue upward triangles represent the ER graphs; the dashed-blue line indicates the upper limit of the small-world region delimited by graphs GWS with β = 1; the downward red triangles represent k-ring graphs, as the dashed-red line indicates a “rough” lower limit for the small-world region. (b) Zooms over the black points which represent the networks generated using a non-linear preferential attachment mechanism.

References

    1. Wiedermann M, Donges JF, Kurths J, Donner RV. Mapping and discrimination of networks in the complexityentropy plane. Phys. Rev. E. 2017;96:042304. doi: 10.1103/PhysRevE.96.042304. - DOI - PubMed
    1. Rosso OA, Larrondo H, Martín MT, Plastino A, Fuentes M. Distinguishing noise from chaos. Phys. Rev. Lett. 2007;99:154102. doi: 10.1103/PhysRevLett.99.154102. - DOI - PubMed
    1. Bandt C, Pompe B. Permutation entropy: a natural complexity measure for time series. Phys. Rev. Lett. 2002;88:174102. doi: 10.1103/PhysRevLett.88.174102. - DOI - PubMed
    1. Rosso OA, Olivares F, Plastino A. Noise versus chaos in a causal fisher-shannon plane. Pap. Phys. 2015;7:070006. doi: 10.4279/pip.070006. - DOI
    1. Erdős P, Rényi A. On random graphs. Publ. Math. 1959;6:290–297.

Publication types