. 2020 Feb;39(8):1619-1633.
doi: 10.1038/s41388-019-1097-7. Epub 2019 Nov 13.

Context-dependent activation of SIRT3 is necessary for anchorage-independent survival and metastasis of ovarian cancer cells

Affiliations

Context-dependent activation of SIRT3 is necessary for anchorage-independent survival and metastasis of ovarian cancer cells

Yeon Soo Kim et al. Oncogene. 2020 Feb.

Abstract

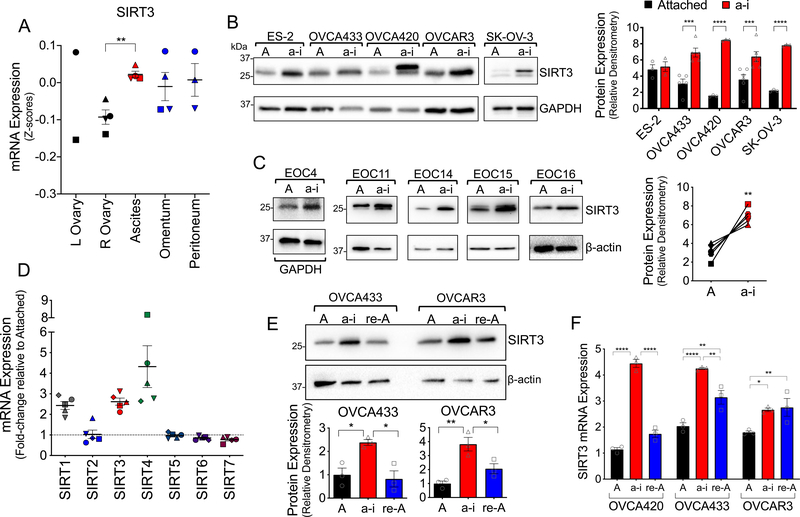
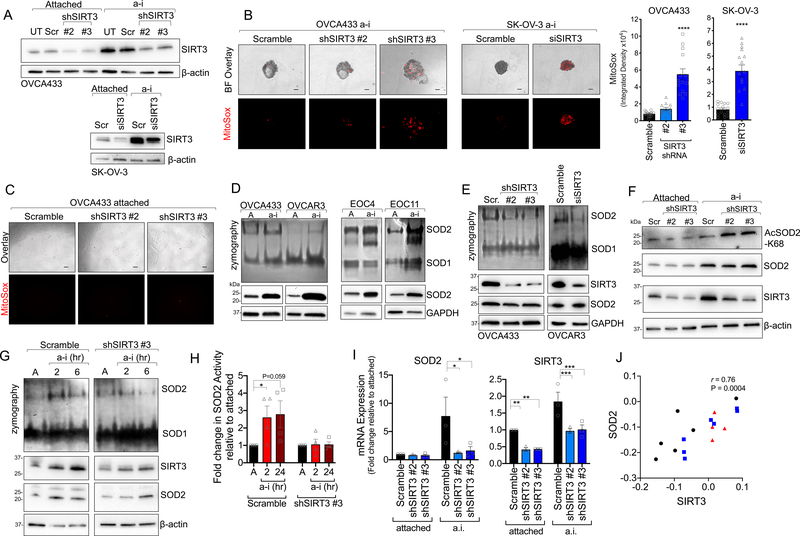
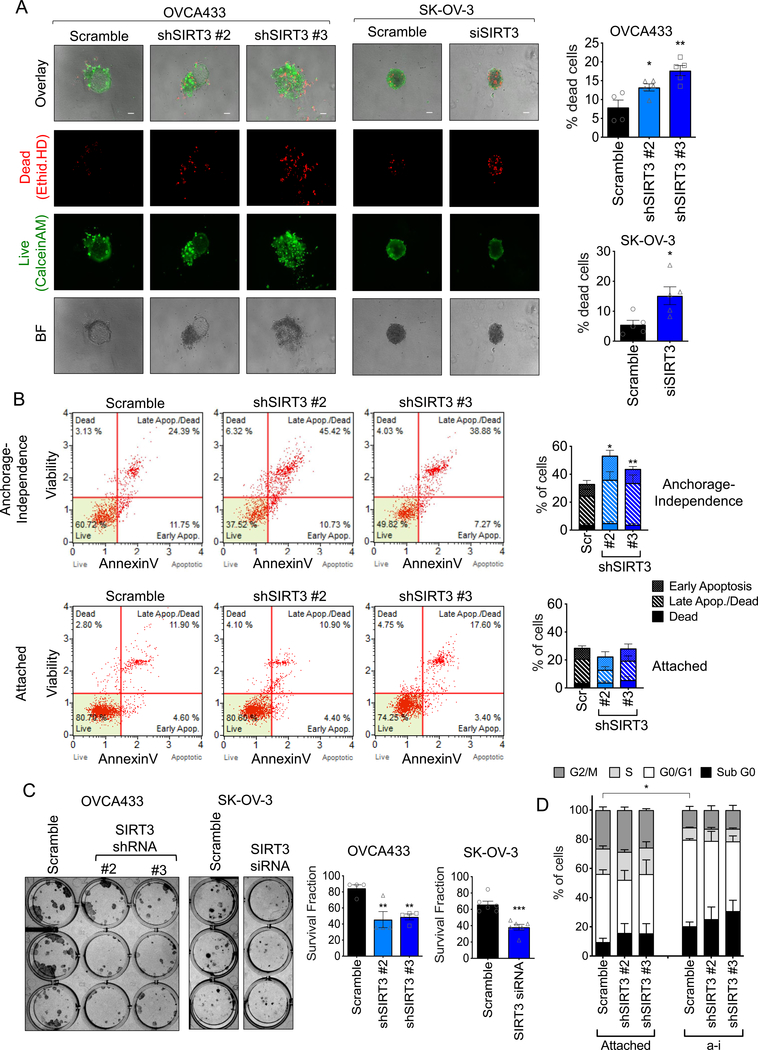
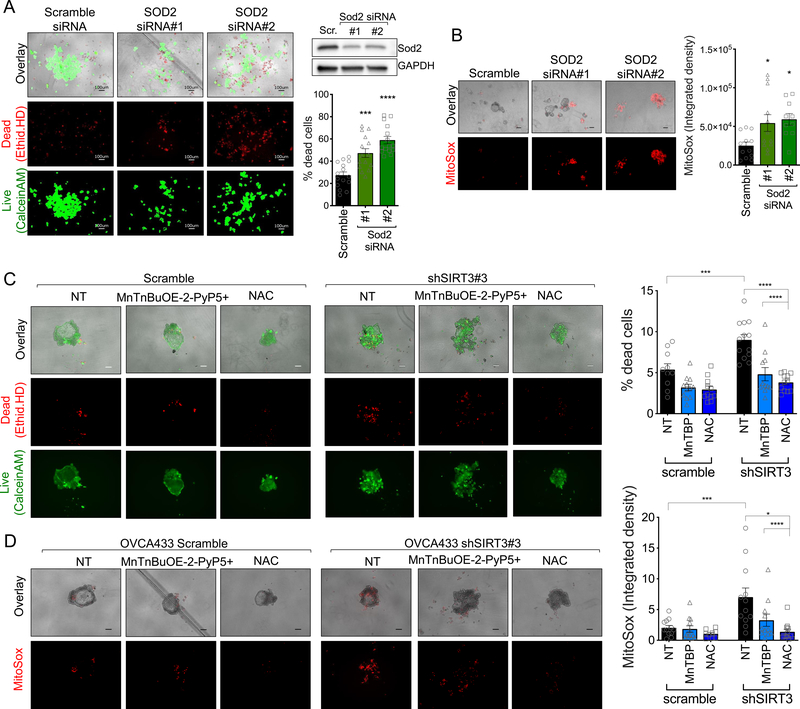
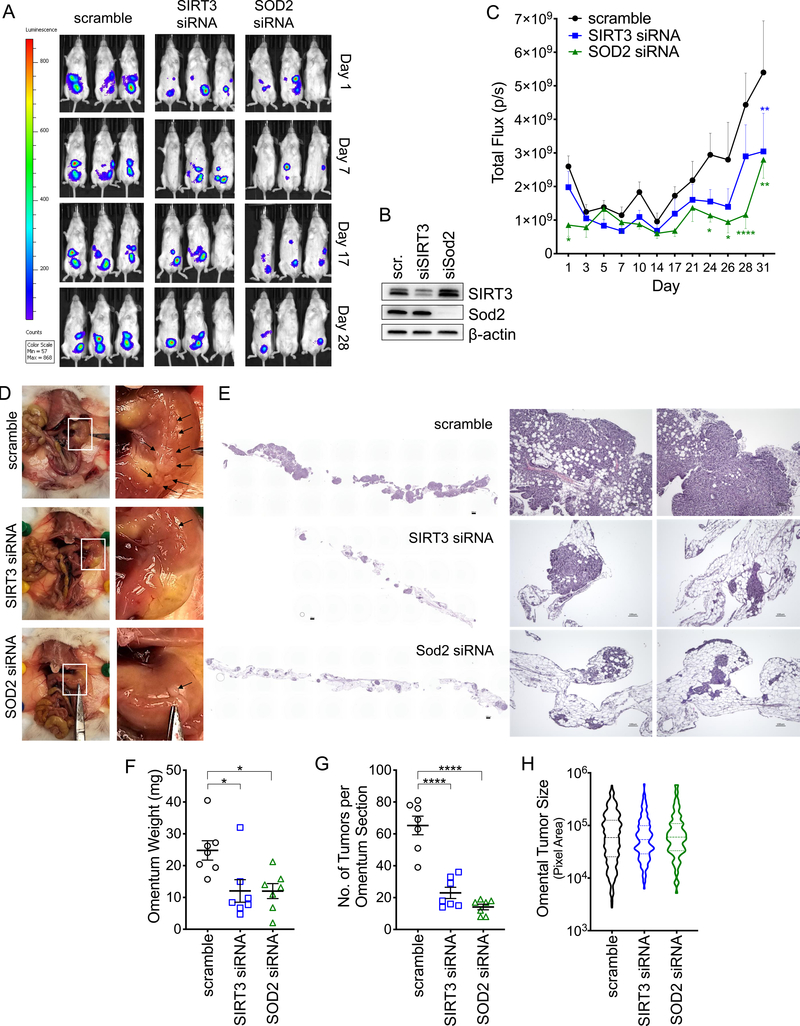
Tumor cells must alter their antioxidant capacity for maximal metastatic potential. Yet the antioxidant adaptations required for ovarian cancer transcoelomic metastasis, which is the passive dissemination of cells in the peritoneal cavity, remain largely unexplored. Somewhat contradicting the need for oxidant scavenging are previous observations that expression of SIRT3, a nutrient stress sensor and regulator of mitochondrial antioxidant defenses, is often suppressed in many primary tumors. We have discovered that this mitochondrial deacetylase is specifically upregulated in a context-dependent manner in cancer cells. SIRT3 activity and expression transiently increased following ovarian cancer cell detachment and in tumor cells derived from malignant ascites of high-grade serous adenocarcinoma patients. Mechanistically, SIRT3 prevents mitochondrial superoxide surges in detached cells by regulating the manganese superoxide dismutase (SOD2). This mitochondrial stress response is under dual regulation by SIRT3. SIRT3 rapidly increases SOD2 activity as an early adaptation to cellular detachment, which is followed by SIRT3-dependent increases in SOD2 mRNA during sustained anchorage-independence. In addition, SIRT3 inhibits glycolytic capacity in anchorage-independent cells thereby contributing to metabolic changes in response to detachment. While manipulation of SIRT3 expression has few deleterious effects on cancer cells in attached conditions, SIRT3 upregulation and SIRT3-mediated oxidant scavenging are required for anoikis resistance in vitro following matrix detachment, and both SIRT3 and SOD2 are necessary for colonization of the peritoneal cavity in vivo. Our results highlight the novel context-specific, pro-metastatic role of SIRT3 in ovarian cancer.


Conflict of interest statement

Conflict of Interest:

The authors declare no competing financial interests in relation to the work described.

Figures

Figure 1:
Figure 1:. Ovarian cancer SIRT3 expression is context-dependent, and increases in response to anchorage-independence.
A. SIRT3 mRNA expression in tumor samples from primary tumors of the ovary, matching ascites, and omental and peritoneal metastatic lesions (Geo:GSE85296, n=4, mean expression at each site per patient shown, repeated measures ANOVA P = 0.047, Dunnett’s multiple comparison test **P = 0.005). B. Ovarian cancer cell lines were cultured in anchorage-independent (a-i) conditions using ultra low attachment (ULA) plates for 72 h, and SIRT3 protein expression compared to cell cultures in attached (A) conditions using western blotting. Densitometry of SIRT3 bands is expressed relative to loading control GAPDH, and levels in a-i compared to attached conditions for each cell line (n=3–6; t-test ***P<0.001, ****P<0.0001). C. Epithelial ovarian cancer cells (EOCs) were derived from ascites of Stage III and IV high grade serous adenocarcinoma patients and cultured in attached or a-i conditions for 72 h. SIRT3 expression was assessed as in B (n=5, paired t-test **P=0.07). D. mRNA levels of sirtuin family members were assessed using U133 microarray after EOCs derived from patient ascites (n=5) were cultured in a-i conditions for 72 h as described in [47]. mRNA levels are expressed relative to cells grown in attached conditions. E. SIRT3 protein expression was assessed by western blotting of lysates from attached cell cultures (A), cells maintained for 24 h in ULA plates (a-i) and 24 hours following re-attachment (re-A). Densitometry of SIRT3 bands is expressed relative to loading control actin and normalized to attached conditions (n=3; one-way ANOVA, Tukey’s multiple comparison test *P<0.05, **P<0.01). F. SIRT3 mRNA expression was assessed by semi-quantitative real time RT-PCR following cell culturing as in E, and expressed relative to OVCA420 in attached conditions (n=3; two-way ANOVA, Tukey’s multiple comparison test *P<0.05, **P<0.001, ****P<0.0001).
Figure 2:
Figure 2:. SIRT3 maintains superoxide (O2.−) scavenging in anchorage-independent conditions by activating SOD2.
A. SIRT3 expression was inhibited using stable shRNA transfection of OVCA433 cells or transient delivery of siRNA in SK-OV-3 (UT, un-transfected; Scr, scramble control). B. SIRT3 knock-down increases oxidation and fluorescence of the mitochondrial O2.− probe MitoSox in ULA cultured OVCA433 (A) and SK-OV-3 (B) ovarian cancer cells. Quantification of MitoSox signal (n=12–14 ± SEM; OVCA433: one-way ANOVA P<0.0001, Tukey’s multiple comparisons test ****P<0.0001, **P=0.001; SK-OV-3: unpaired t-test ****P<0.0001, scale bar = 100μm). C. SIRT3 knock-down has no effect on mitochondrial O2.− in attached culture conditions, as assessed by MitoSox staining. D. Ovarian cancer cell lines and patient ascites-derived epithelial ovarian cancer cells (EOC) were cultured in anchorage-independent (a-i) conditions for 72 h using ultra low attachment (ULA) plates. SOD2 activity was assessed by in gel zymography and compared to cell cultures in attached (A) conditions. E. shRNA and siRNA-mediated SIRT3 knock-down inhibits SOD2 activity in ULA cultured (72 h) ovarian cancer cells, assessed by SOD zymography. F. SIRT3 knock-down increases SOD2 acetylation at lysine 68 in OVCA433 cells cultured in a-i conditions. G. SOD2 activity is induced within 2 h of matrix detachment in a SIRT3-dependent manner. SOD2 activity was assessed by zymography in attached (A) OVCA433 cells and cells cultured for 2 or 6 h in anchorage-independence (a-i). H. SOD2 activity, assessed by an in vitro SOD activity assay, increases in scramble transfected OVCA433 cells cultured for 2 and 24 h in a-i, while SIRT3 knock-down inhibits this a-I induced SOD2 activity (n=4 ± SEM; *P<0.05). I. SIRT3 knock-down decreases SOD2 mRNA levels in a-i. mRNA expression was assessed by semi-quantitative real time RT-PCR following cell culturing in ULA plates for 24 h. Data expressed relative to expression in scramble transfected cells in attached conditions (n=3; two-way ANOVA, Dunnett’s multiple comparison test *P<0.05, **P<0.01, ***P<0.001). J. Positive correlation between SIRT3 and SOD2 mRNA expression in tumor tissues derived from primary ovarian tumors (formula image), ascites (formula image), and peritoneal or omental lesions (formula image; Geo:GSE85296, Pearson correlation).
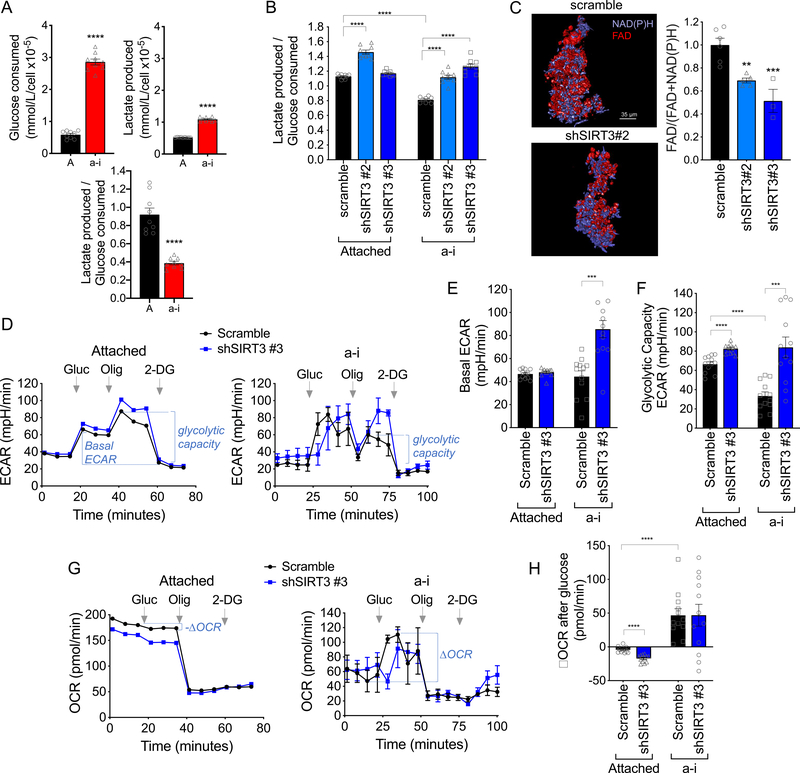
Figure 3:
Figure 3:. SIRT3 suppresses the glycolytic capacity of anchorage-independent (a-i) cells.
A. OVCA433 a-i cultured cells (24 h) consume more glucose per cell compared to attached cells, but produce less lactate relative to glucose consumed (n=9 ± SEM; unpaired t-test ****P<0.0001). B. SIRT3 knock-down shifts OVCA433 cells towards enhanced lactate production relative to glucose consumption (n=9 ± SEM; one-way ANOVA P=0.01, Tukey’s multiple comparisons test ****P<0.0001). C. The optical redox ratio FAD / FAD + NAD(P)H is decreased in a-i conditions following SIRT3 knock-down in OVCA433 (n=3–5; unpaired t-test *P=0.04). D. Extracellular Acidification Rates (ECAR) were measured in attached and a-i OVCA433 cells using a Seahorse XFp extracellular flux analyzer. One representative experiment shown (n=3). 10mM glucose (Gluc), 1 μM Oligomycin A (Oligo) and 50mM 2-Deoxyglucose (2-DG) were added at indicated times. E. & F. SIRT3 knock-down increases basal ECAR/Glycolysis in response to glucose addition (E), and Glycolytic Capacity stimulated by Oligomycin A (F). G. Oxygen Consumption rate (OCR) was monitored simultaneously as in D. H. Attached cells display a decrease in OCR following glucose addition, which is further decreased with SIRT3 knockdown. Conversely, cells in a-i significantly increase their OCR following glucose addition. (E, F & H, n=12; ***P<0.001, *****P<0.0001)
Figure 4:
Figure 4:. SIRT3 expression is required for anchorage-independent ovarian cancer cell survival.
A. SIRT3 knock down increases the dead cell fraction of cells in anchorage-independent (a-i) spheroid aggregates, when cultured in ULA plates for 72 h. Cells were stained with Ethidium homodimer (dead cells) and Calcein AM (live cells) and fractions of live and dead cells quantified (n=4; OVCA433: one-way ANOVA P=0.002, Tukey’s multiple comparison test *P=0.04, **P=0.001; SK-OV-3: unpaired t-test *P=0.019; scale bar = 100μm). B. SIRT3 knock-down increases the apoptotic fraction of cells cultured for 24 h in anchorage-independence, but not in attached conditions. Apoptosis was assessed by Annexin V (n=4–5 experimental replicates; repeated measures ANOVA of total dead cell fraction, a-i: P=0.008, Attached: not significant; Bonferroni’s multiple comparison test *P<0.05, **P<0.01). C. SIRT3 knock-down inhibits single cell clonogenic survival (n=4–6; OVCA433: one-way ANOVA P=0.005, Tukey’s multiple comparison test **P<0.01; SK-OV-3: unpaired t-test *P=0.0004). D. SIRT3 knock-down does not significantly affect cell cycle progression in either attached or a-i cultured OVCA433 cells. (a-i, 24 h, n=3 experimental replicates; Two-way ANOVA, Tukey’s multiple comparisons test *P=0.036, comparison of G0/G1).
Figure 5:
Figure 5:. SOD2 and oxidant scavenging are required for anchorage-independent survival.
A. SOD2 knock-down increases the dead cell fraction of OVCA433 cells in anchorage-independent (a-i) spheroid aggregates, when cultured in ULA plates for 72 h. Cells were stained with Ethidium homodimer (dead cells) and Calcein AM (live cells) and fractions of live and dead cells quantified (n=15; one-way ANOVA P<0.0001, Tukey’s multiple comparison test ***P=0.0003, ****P<0.0001). SOD2 expression was inhibited using siRNA in OVCA433 cells (Scr, scramble control) B. SOD2 knock-down increases oxidation and fluorescence of the mitochondrial O2.− probe MitoSox in ULA cultured OVCA433 cells (n=10–12; one-way ANOVA P=0.01, Tukey’s multiple comparisons test *P<0.05). C. Co-treatment of cells with 10μM MnTnBuOE-2-PyP5+ or 2mM NAC rescues OVCA433 cell viability following siRNA mediated SIRT3 knock-down; and D. results in decreased mitochondrial MitoSox oxidation (72 h a-i; n=12–15; ± SEM; OVCA433: one-way ANOVA P<0.0001, Tukey’s multiple comparisons test ****P<0.0001, **P=0.001; SK-OV-3: unpaired t-test ****P<0.0001).
Figure 6:
Figure 6:. SIRT3 and SOD2 are required for successful metastasis to the omentum.
A. Representative tumor luminescence images of NSG mice injected with SK-OV-3-luciferase cells transfected with either scramble siRNA, siRNA targeting SIRT3 or SOD2. B. Western blot demonstrating knock down of SIRT3 and SOD2 three days after transfection. C. Quantification of whole animal tumor luminescence over time (n=7–8; Mixed-design ANOVA P=0.004, Dunnett’s multiple comparisons test *P < 0.05, **P < 0.01, ****P < 0.0001). D. Assessment of the peritoneal cavity revealed that the majority of SK-OV-3 tumors (black arrows) were localized to the omentum. E. H & E staining demonstrates that SIRT3 and SOD2 knock down abrogate tumor burden in the omentum. F. SIRT3 and SOD2 knock down decreases omental weight and G. number of tumors per longitudinal section of omentum assessed by H & E (One way ANOVA, F: P = 0.01, G: P < 0.0001; Tukey’s multiple comparisons test *P < 0.05, P < 0.0001). H. Variability in individual omental tumor sizes between experimental groups (violin plot, median + interquartile range).

References

    1. Torre LA, Trabert B, DeSantis CE, Miller KD, Samimi G, Runowicz CD et al. Ovarian cancer statistics, 2018. CA Cancer J Clin 2018; 68: 284–296. - PMC - PubMed
    1. Sehouli J, Senyuva F, Fotopoulou C, Neumann U, Denkert C, Werner L et al. Intra-abdominal tumor dissemination pattern and surgical outcome in 214 patients with primary ovarian cancer. J Surg Oncol 2009; 99: 424–427. - PubMed
    1. Tan DS, Agarwal R, Kaye SB. Mechanisms of transcoelomic metastasis in ovarian cancer. The lancet oncology 2006; 7: 925–934. - PubMed
    1. Cai Q, Yan L, Xu Y. Anoikis resistance is a critical feature of highly aggressive ovarian cancer cells. Oncogene 2015; 34: 3315–3324. - PMC - PubMed
    1. Piskounova E, Agathocleous M, Murphy MM, Hu Z, Huddlestun SE, Zhao Z et al. Oxidative stress inhibits distant metastasis by human melanoma cells. Nature 2015; 527: 186–191. - PMC - PubMed

Publication types