. 2019 Nov;575(7783):494-499.
doi: 10.1038/s41586-019-1749-3. Epub 2019 Nov 13.

High-resolution lineage tracking reveals travelling wave of adaptation in laboratory yeast

Affiliations

High-resolution lineage tracking reveals travelling wave of adaptation in laboratory yeast

Alex N Nguyen Ba et al. Nature. 2019 Nov.

Abstract

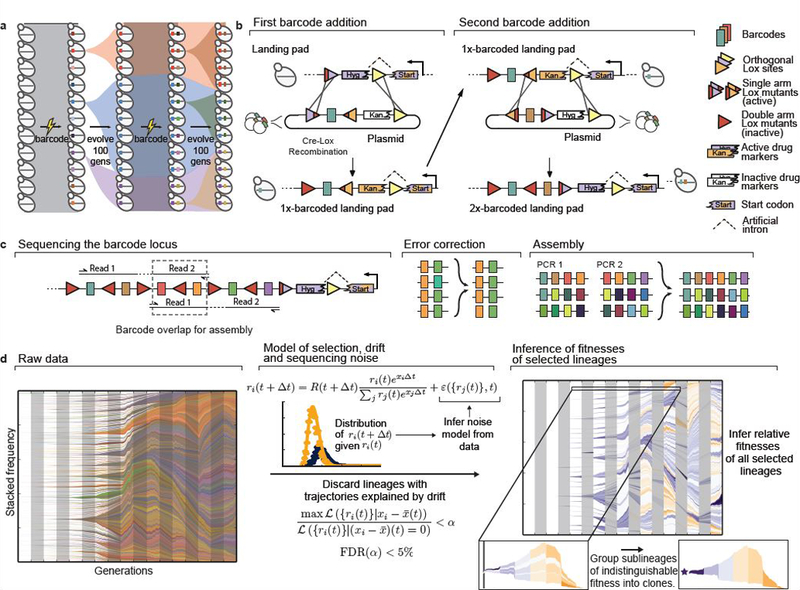
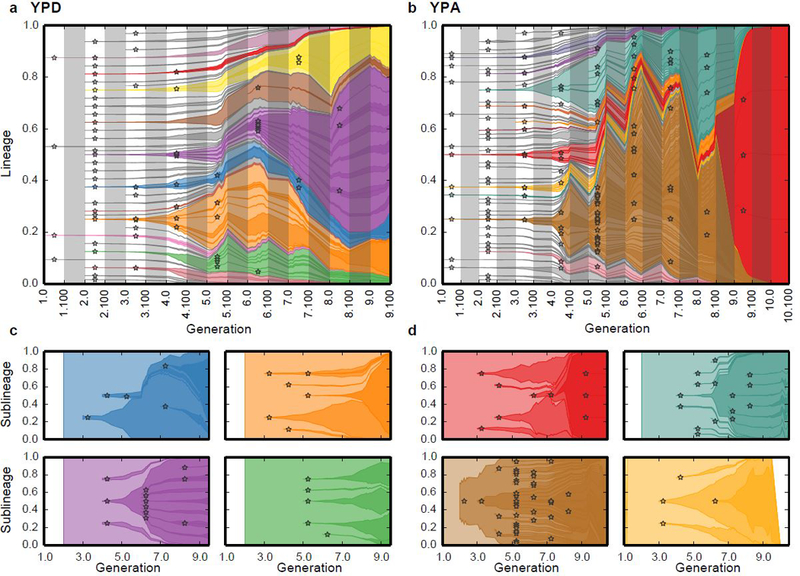
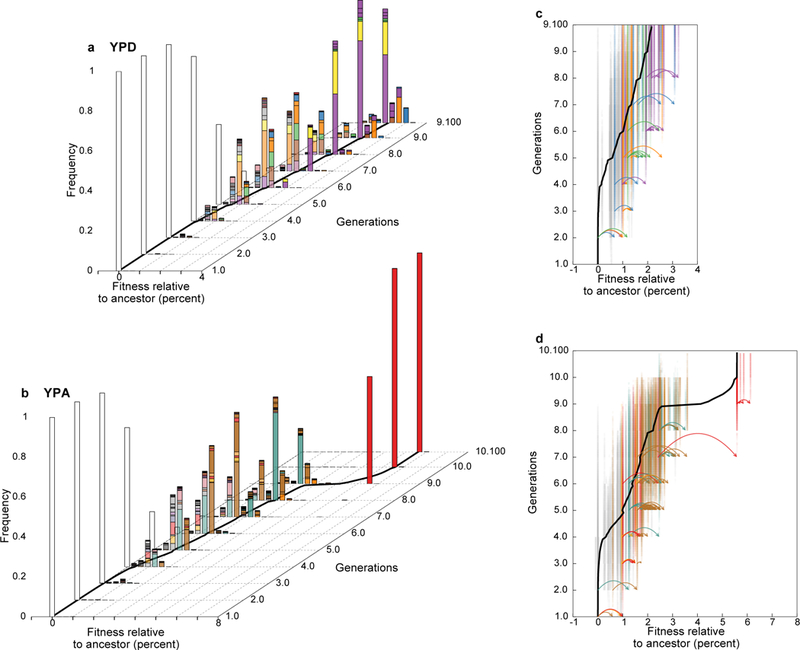
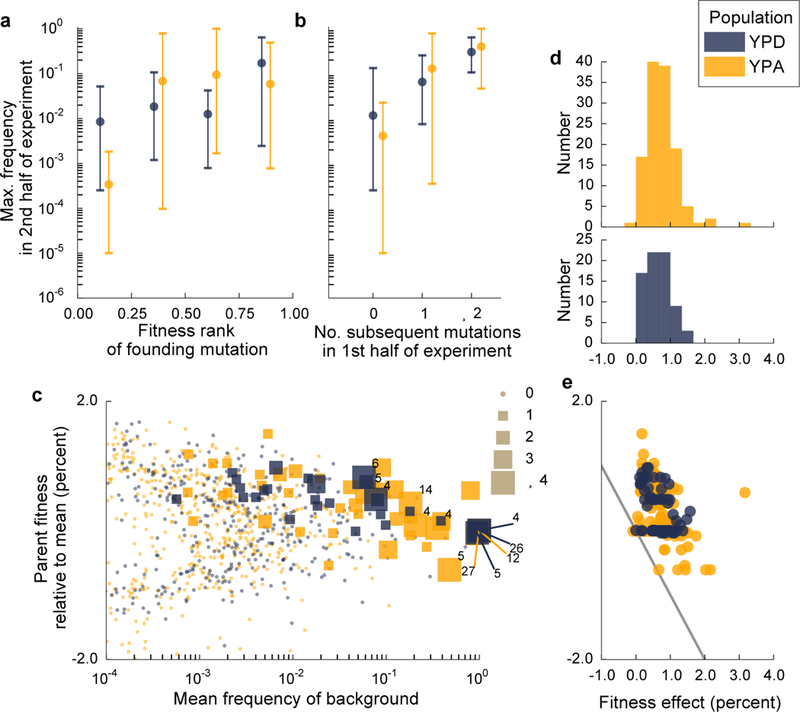
In rapidly adapting asexual populations, including many microbial pathogens and viruses, numerous mutant lineages often compete for dominance within the population1-5. These complex evolutionary dynamics determine the outcomes of adaptation, but have been difficult to observe directly. Previous studies have used whole-genome sequencing to follow molecular adaptation6-10; however, these methods have limited resolution in microbial populations. Here we introduce a renewable barcoding system to observe evolutionary dynamics at high resolution in laboratory budding yeast. We find nested patterns of interference and hitchhiking even at low frequencies. These events are driven by the continuous appearance of new mutations that modify the fates of existing lineages before they reach substantial frequencies. We observe how the distribution of fitness within the population changes over time, and find a travelling wave of adaptation that has been predicted by theory11-17. We show that clonal competition creates a dynamical 'rich-get-richer' effect: fitness advantages that are acquired early in evolution drive clonal expansions, which increase the chances of acquiring future mutations. However, less-fit lineages also routinely leapfrog over strains of higher fitness. Our results demonstrate that this combination of factors, which is not accounted for in existing models of evolutionary dynamics, is critical in determining the rate, predictability and molecular basis of adaptation.


Figures

Extended Data Figure 1:
Extended Data Figure 1:. Allele frequency trajectories in the two populations, as detected from metagenomic sequencing.
In both the YPD (a) and the YPA population (b), full lines denote missense and nonsense mutations, and dotted lines denote synonymous mutations and those falling in intergenic regions. Lines are colored according to the peak time of the trajectory. Note that a frequency of 50% (dotted line) corresponds to a mutation fixing as a heterozygote.
Extended Data Figure 2:
Extended Data Figure 2:. Comparison of inferred and measured population mean fitness trajectories.
All fitness measurements and inferences refer to the evolution environment only. Trajectories have been offset to agree with the fitness assay at timepoint 3.100. Dots denote barcoding intervals. Shaded regions around the trajectories denote estimates of confidence intervals for the inferred mean fitness trajectory, which often does not exceed the width of lines (SI section 6.1). In the case of the YPA population, lighter colors denote mean fitness trajectories over the last two epochs, offset to agree with fitness assays in the last timepoint (see SI section 6.6 for a discussion of potential reasons for these discrepancies).
Extended Data Figure 3:
Extended Data Figure 3:. Predictors of the success of lineages.
Size of each dot denotes the number of later beneficial mutations that occur in the founding clonal background of a lineage (in the first half of the experiment).
Extended Data Figure 4:
Extended Data Figure 4:. Genetic variation through time.
a, Total number of lineages above a threshold frequency (0.01%) through time; bars denote number of new lineages arising in each 100-generation interval. b, Genetic diversity within each population over time, as measured by entropy (SI section 6.4). c, Variance in fitness through time. d, Fitness diversity within each population over time, as measured by fitness entropy. Fitness entropy quantifies how fitness variance is distributed among lineages (SI section 6.4)
Figure 1.
Figure 1.. Renewable barcoding system and lineage dynamics.
a, Experimental design. Diverse DNA barcodes are introduced into an initially clonal population; each barcode labels a small lineage. Every 100 generations, we introduce new diverse barcodes immediately adjacent to existing barcodes, subdividing each lineage into sublineages. b, Renewable barcoding system, using a novel Cre-Lox system consisting of three orthogonal Lox sites (colored triangles), each of which can be modified with two arm disruptions (red shading) that are individually tolerated but jointly inactivating (SI section 1). At each barcode addition, we combine arm disruptions to inactivate the old Lox site, while adding a new orthogonal active Lox site; alternating Lox orientations further limit undesired recombination. Drug markers contain an intron 3’ splice accepting site and must correctly integrate at the landing pad containing the 5’ splice donor to be functional. c, When the barcode locus exceeds the length of an Illumina read, we use custom priming sites to sequence overlapping sets of four consecutive barcodes. After exploiting barcode diversity to identify and correct sequencing errors, we use these overlaps to unambiguously reconstruct the full barcode locus (SI section 2). d, Inference pipeline. At left, raw barcode frequencies over time (left to right, colors chosen at random). For legibility, we only show lineages or sublineages whose frequency exceeds 0.1% in at least one timepoint; combined frequencies of lineages that do not individually reach 0.1% are shown as white space (or the color of the parent when that parent exceeds 0.1% frequency). Center panel summarizes model for identifying selected lineages. Briefly, we use the data to construct a parametric model for the strength of noise from genetic drift and sequencing and discard trajectories explained by noise alone. We then jointly infer fitnesses of all remaining lineages, and group lineages of indistinguishable fitness into clones.
Figure 2.
Figure 2.. Inferred clonal dynamics.
a, b, Muller diagrams showing dynamics of inferred beneficial mutations in YPD (a) and YPA (b) populations. Time is denoted by epoch and generation (e.g. 4.100 refers to the generation 100 of epoch 4). Stars denote establishment epoch of each new beneficial mutation (SI section 5). Color opacity denotes fitness of the corresponding lineage; mutant lineages that did not acquire additional beneficial mutations are grey. Grey bars denote barcoding intervals. c, d, Muller diagrams showing within-lineage dynamics in select lineages in the YPD (c) and YPA (d) populations; colors are consistent with corresponding lineages in (a,b). White space indicates periods during which the select lineage was not observed.
Figure 3.
Figure 3.. Travelling wave dynamics.
a, b Inferred distribution of fitness within the population through time. All fitnesses refer to average across evolution and barcoding conditions (SI section 6.2). Each colored bar denotes the frequency and fitness of a corresponding lineage in Fig. 2. White bar corresponds to the ancestor. Black line denotes inferred population mean fitness. c, d, Genealogical relationships among lineages show frequent leapfrogging events. Each clonal lineage is shown at its corresponding fitness; color opacity indicates lineage frequency. Colors of highlighted lineages shown in Fig. 2c, d are consistent with that figure; all other lineages are grey. Mutational events within highlighted lineages are shown as arrows; each event arises in one clonal lineage and founds a new lineage at a new fitness.
Figure 4.
Figure 4.. Traveling wave dynamics and factors determining the success of mutant lineages.
a, Relationship between initial within-population fitness rank of a mutation arising in the ancestral background and its maximum frequency in the latter half of the experiment (using latter half avoids confounding axes in b; n=35 and n=47 unique lineages in YPD and YPA respectively). Dots represent the mean, and lines show range of maximum frequencies in each founding fitness quantile. b, Relationship between the number of subsequent beneficial mutations landing on the founding clonal background of a lineage (in the first half of the experiment) to its eventual maximum frequency (in the second half of the experiment). c, Effect of lineage frequency and fitness on the likelihood of acquiring additional beneficial mutations. Each point represents the mean frequency and fitness of a lineage in a given 100-generation interval; symbol size denotes how many further beneficial mutations that lineage acquired (numbers indicate lineages that acquire >4). d, Histograms of effect sizes of all inferred mutations. e, Effect sizes of mutations arising on parental backgrounds as a function of mean parental relative fitness in the epoch each mutation arose. Region below grey line corresponds to mutations that would create lineages less fit than the current mean fitness.

References

    1. Gerrish P. & Lenski R The Fate of Competing Beneficial Mutations in an Asexual Population. Genetica 102/103, 127–144 (1998). - PubMed
    1. Desai MM, Fisher DS & Murray AW The Speed of Evolution and Maintenance of Variation in Asexual Populations. Current Biology 17, 385–394 (2007). - PMC - PubMed
    1. Miller CR, Joyce P. & Wichman HA Mutational Effects and Population Dynamics During Viral Adaptation Challenge Current Models. Genetics 187, 185–202 (2011). - PMC - PubMed
    1. de Visser J, Zeyl CW, Gerrish PJ, Blanchard JL & Lenski RE Diminishing returns from mutation supply rate in asexual populations. Science 283, 404–406 (1999). - PubMed
    1. Levy SF et al. Quantitative evolutionary dynamics using high-resolution lineage tracking. Nature 519, 181–186 (2015). - PMC - PubMed

Publication types

LinkOut - more resources