. 2018 Mar:14:286-290.
doi: 10.1038/s41567-017-0002-y.

Cellular packing, mechanical stress and the evolution of multicellularity

Affiliations

Cellular packing, mechanical stress and the evolution of multicellularity

Shane Jacobeen et al. Nat Phys. 2018 Mar.

Abstract

The evolution of multicellularity set the stage for sustained increases in organismal complexity1-5. However, a fundamental aspect of this transition remains largely unknown: how do simple clusters of cells evolve increased size when confronted by forces capable of breaking intracellular bonds? Here we show that multicellular snowflake yeast clusters6-8 fracture due to crowding-induced mechanical stress. Over seven weeks (~291 generations) of daily selection for large size, snowflake clusters evolve to increase their radius 1.7-fold by reducing the accumulation of internal stress. During this period, cells within the clusters evolve to be more elongated, concomitant with a decrease in the cellular volume fraction of the clusters. The associated increase in free space reduces the internal stress caused by cellular growth, thus delaying fracture and increasing cluster size. This work demonstrates how readily natural selection finds simple, physical solutions to spatial constraints that limit the evolution of group size-a fundamental step in the evolution of multicellularity.


Conflict of interest statement

Competing interests The authors declare no competing financial interests.

Figures

Fig. 1|
Fig. 1|. Snowflake yeast evolve larger size.
a, Snowflake yeast form fractal-like branched clusters, imaged via fluorescence microscopy. The numbers indicate the relative generational age of cells in this cluster. b, Bright-field images of snowflake yeast fracturing into two independently viable clusters. c,Over seven weeks (~291 generations) of selection for large size, snowflake yeast clusters increase their average maximum radius by a factor of 1.7. d,Three-dimensional confocal images show that week-8 snowflake yeast (right) contain a greater number of larger, more elongate cells than week-1 (left). The error bars in c denote one standard error of the mean; ****P<0.0001.
Fig. 2|
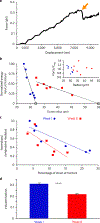
Fig. 2|. Snowflake yeast fracture due to growth-induced mechanical stress.
a, Sample AFM force–displacement scan of an individual cluster. The sharp reduction in force (arrow) is indicative of a fracturing event. b, Normalized energy input versus cluster radius for week 1 (blue) and week 8 (red) clusters, with linear extrapolations to the point of zero energy input marked—these extrapolated sizes correspond to expected spontaneous fracture sizes, and are in agreement with independent measurements thereof. Energy input normalized by the maximum measured value. The inset shows force at fracture, normalized by the average. c, Normalized compressive modulus versus percentage of strain at fracture for week-1 (blue) and week-8 (red) clusters. Compressive modulus normalized by the maximum measured value. d, Mean experimentally measured volume fraction for week-1 (blue) and week-8 (red) clusters. Error bars indicate standard error of the mean; ****P< 0.0001.
Fig. 3|
Fig. 3|. Snowflake yeast evolve to mitigate mechanical stresses by increasing volume fraction.
a, Experimentally measured fraction of cells with aspect ratio below α for week-1 (blue) and week-8 (red) genotypes. b, Volume fraction from experiment versus volume fraction from simulation. Week-4 (yellow circle) and week-6 (green circle) samples are included as well. Linear fit slope = 0.998, r2 = 0.94; error bars indicate standard error. c, Visual comparison of a confocal image of a snowflake (top) and a simulation-generated snowflake (bottom). d, The simulation (continuous lines, averaged over 100 unique trials) accurately predicts the number of cells in a cluster observed in experiments (circles, each symbol is a measurement from a different cluster) as a function of radius for both genotypes. e, Simulated energy input required to fracture versus cluster radius. The critical energy threshold was selected using the experimental value for week-8 spontaneous fracture size. Yellow diamonds show the experimentally measured spontaneous fracture size; error bars indicate standard error.

References

    1. Buchanan M Simple yet successful. Nat. Phys 13, 720 (2017).
    1. Transtrum MK et al. Perspective: sloppiness and emergent theories in physics, biology, and beyond. J. Chem. Phys 143, 010901 (2015). - PubMed
    1. Mattingly HH, Transtrum MK, Abbott MC & Machta BB Rational ignorance: simpler models learn more information from finite data. Preprint at https://arxiv.org/abs/1705.01166 (2017). - PMC - PubMed
    1. Szathmary E & Smith JM The major evolutionary transitions. Nature 374, 227–232 (1995). - PubMed
    1. Kirk DL A twelve-step program for evolving multicellularity and a division of labor. Bioessays 27, 299–310 (2005). - PubMed