. 2020 Jan;93(1105):20181019.
doi: 10.1259/bjr.20181019. Epub 2019 Nov 28.

Potential for dose reduction in CT emphysema densitometry with post-scan noise reduction: a phantom study

Affiliations

Potential for dose reduction in CT emphysema densitometry with post-scan noise reduction: a phantom study

Hendrik Joost Wisselink et al. Br J Radiol. 2020 Jan.

Abstract

Objective: The aim of this phantom study was to investigate the effect of scan parameters and noise suppression techniques on the minimum radiation dose for acceptable image quality for CT emphysema densitometry.

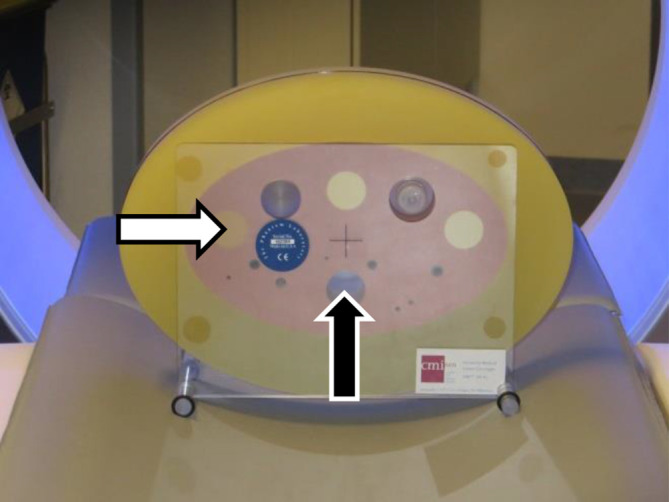
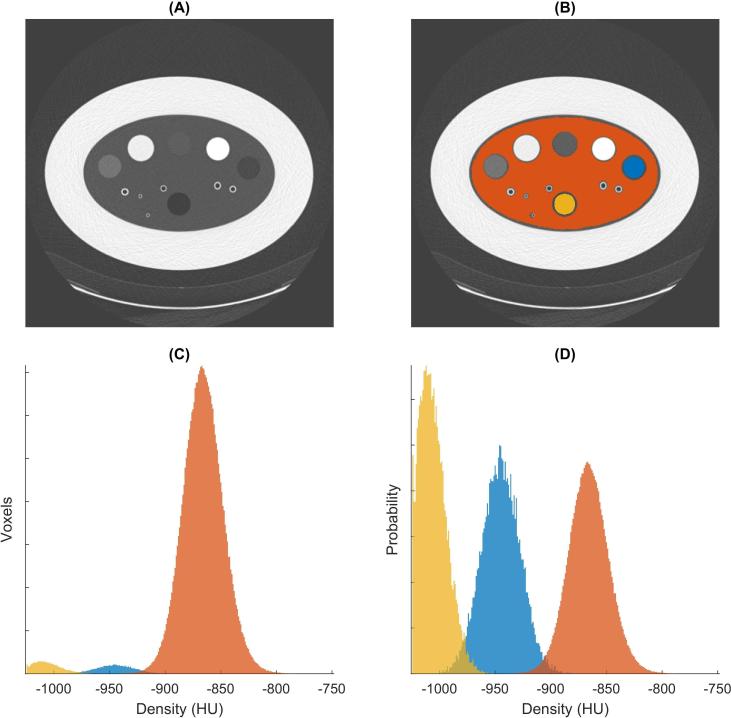
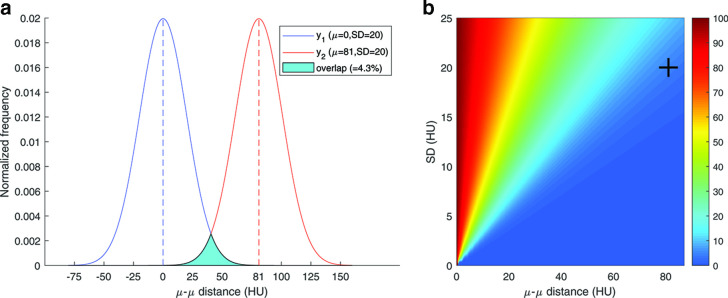
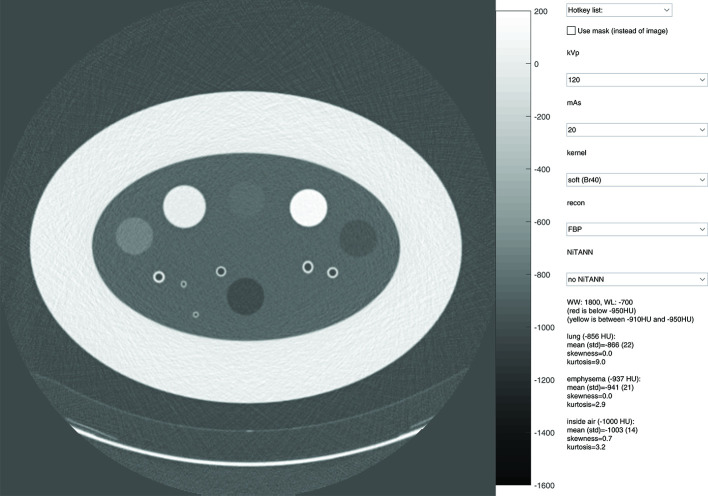
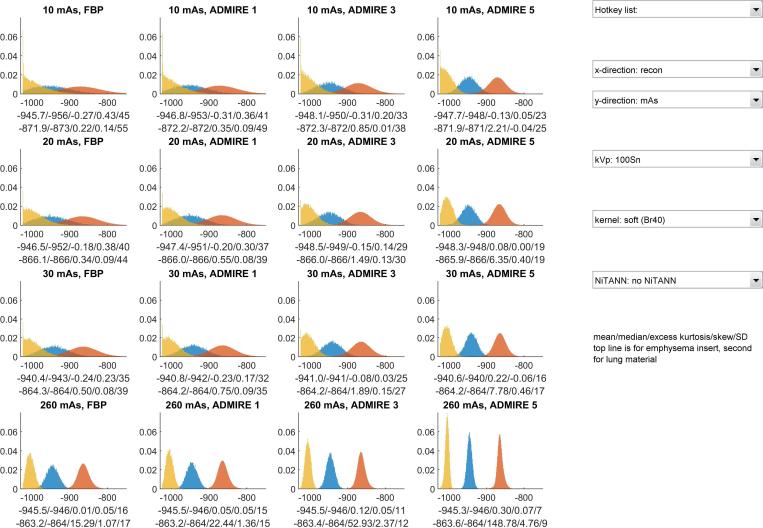
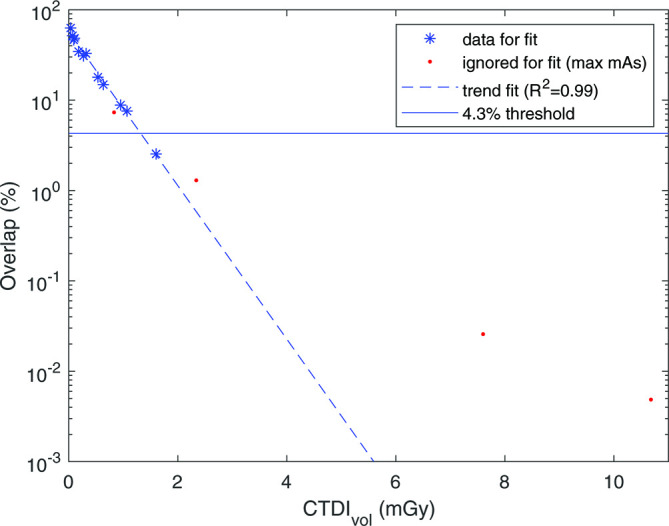
Methods: The COPDGene phantom was scanned on a third generation dual-source CT system with 16 scan setups (CTDIvol 0.035-10.680 mGy). Images were reconstructed at 1.0/0.7 mm slice thickness/increment, with three kernels (one soft, two hard), filtered backprojection and three grades of third-generation iterative reconstruction (IR). Additionally, deep learning-based noise suppression software was applied. Main outcomes: overlap in area of the normalized histograms of CT density for the emphysema insert and lung material, and the radiation dose required for a maximum of 4.3% overlap (defined as acceptable image quality).

Results: In total, 384 scan reconstructions were analyzed. Decreasing radiation dose resulted in an exponential increase of the overlap in normalized histograms of CT density. The overlap was 11-91% for the lowest dose setting (CTDIvol 0.035mGy). The soft kernel reconstruction showed less histogram overlap than hard filter kernels. IR and noise suppression also reduced overlap. Using intermediate grade IR plus noise suppression software allowed for 85% radiation dose reduction while maintaining acceptable image quality.

Conclusion: CT density histogram overlap can quantify the degree of discernibility of emphysema and healthy lung tissue. Noise suppression software, IR, and soft reconstruction kernels substantially decrease the dose required for acceptable image quality.

Advances in knowledge: Noise suppression software, IR, and soft reconstruction kernels allow radiation dose reduction by 85% while still allowing differentiation between emphysema and normal lung tissue.


Figures

Figure 1.
Figure 1.
COPDGene phantom (CTP698). Materials used in this study: lung-like material (pink material surrounding the inserts), emphysema-like insert (left-most larger insert, white arrow), and air hole (hole in the lower center, black arrow)
Figure 2.
Figure 2.
Steps of calculating overlap in density distributions. (A) Transverse CT image (120 kVp, 20 mAs, Br40, FBP, no NiTANN applied), (B) shows the same CT image with the LabelMap overlay (lung-like material in orange, air insert in yellow, emphysema-like insert in blue). (C) CT density histogram for voxels with lung, air and emphysema, same color scheme as in (B). (D) Normalized histograms (i.e. the total area of each histogram was made the same). The overlap between emphysema and lung (blue and orange) was 2.5% in this case. FBP, filtered backprojection; NiTANN, non-iterative technique artificial neural network.
Figure 3.
Figure 3.
Results of overlap simulation. (A) Simulated overlap percentage calculation was based on two normal distributions with equal SD and a specific distance between their means. The image shows the overlap as the filled cyan area. In this example the separation is 81 HU (mean difference between emphysema insert and lung material) and SD is 20 HU (upper limit suggested by the QIBA) (B) Three-dimensional plot that shows the histogram overlap for each combination of SD and µ–µ distance. The crosshair marks the case of the A part. SD, standard deviation; HU, Hounsfield unit; QIBA, quantitative imagingbiomarker alliance.
Figure 4.
Figure 4.
Layout of the user interface used to assess the visual differences caused by changing acquisition parameters and post-filtering parameters. The top drop-down menu can be used to change several parameters at once. The check box can be used to switch between normal view and mask view. In the mask view, voxels with a density below −950 HU are marked red, and all voxels with a density between −910 and −950 HU are marked yellow. The window level setting is adjusted by dragging, and the setting is shown in the text area. HU, Hounsfield unit.
Figure 5.
Figure 5.
Lay out of the user interface used to view the histogram characteristics. The "x-direction" drop-down menu controls which parameter is varied between columns, the "y-direction" drop-down menu controls which parameter is varied between rows. The colours of each histogram correspond to the material: yellow is for the air inside the phantom, blue is for the emphysema insert, orange is for the lung material. The shown histograms are normalized, meaning that their total area is 1.
Figure 6.
Figure 6.
Percentage of overlap between the CT density histograms of lung material and emphysema insert plotted against the CTDIvol (for this example, data from the Br40, FBP, no NiTANN scan was used). Maximum mAs setting for each kV was ignored for the fit. Fit parameters and R2 were calculated with the log of the overlap. CTDIvol, volumetric CT dose index; FBP, filtered backprojection; NiTANN, non-iterative technique artificial neural network.
Figure 7.
Figure 7.
Example slices for different settings (shown at WW:1800 WL:−700). (a) is an 86% lower dose than (b), with ADMIRE three and NiTANN to reduce noise. (c) is 120 kVp,20 mAs with a soft kernel, (d) is with a hard kernel. ADMIRE, ADvanced Model Iterative REconstruction; NiTANN, non-iterative technique artificial neural network; WL, window level; WW, window width.
Figure 8.
Figure 8.
Difference between median HU of each insert and true value (see Newell et al), points shown here are from the 30 mAs scans. To prevent mixing of effects in this example, no ADMIRE or NiTANN data was used. HU, Hounsfield unit; FBP, filteredbackprojection; ADMIRE, ADvanced Model Iterative Reconstruction; NiTANN, non-iterative technique artificial neural network.
Figure 9.
Figure 9.
(A) Measured standard deviation of air and water plotted against CTDIvol (data used as example: Br40, FBP, no NiTANN). The threshold is 20 HU (QIBA threshold for air and water inserts). (B) All trend lines for soft kernel (different ADMIRE levels and with/without NiTANN). R2 values of the fits range: 0.96–0.99 (median 0.98). ADMIRE, ADvanced Model IterativeREconstruction; CTDIvol, Computer TomographyDose Index (volumetric); FBP, filtered backprojection; HU, Hounsfield Unit; NiTANN, non-iterative technique artificial neural network; QIBA, quantitativeimaging biomarkers alliance.
Figure 10.
Figure 10.
Effect of ADMIRE and NiTANN on SD of the density distribution of air insert (upper left), emphysema material (upper right), lung material (lower left) and water (lower right). Only soft kernel scans were used for these plots; hard kernels showed similar results, but with a wider range of SD values. The black line shows the equality line, so SD values to the right of the line are lower in the processed scan than in the unprocessed scan. ADMIRE, ADvanced Model Iterative Reconstruction; NiTANN, non-iterative technique artificial neural network; SD, standard deviation.

References

    1. Moran AE, Forouzanfar MH, Roth GA, Mensah GA, Ezzati M, Murray CJL, et al. Temporal trends in ischemic heart disease mortality in 21 world regions, 1980 to 2010: the global burden of disease 2010 study. Circulation 2014; 129: 1483–92. doi: 10.1161/CIRCULATIONAHA.113.004042 - DOI - PMC - PubMed
    1. Torre LA, Bray F, Siegel RL, Ferlay J, Lortet-Tieulent J, Jemal A. Global cancer statistics, 2012. CA Cancer J Clin 2015; 65: 87–108. doi: 10.3322/caac.21262 - DOI - PubMed
    1. Burney PGJ, Patel J, Newson R, Minelli C, Naghavi M. Global and regional trends in COPD mortality, 1990-2010. Eur Respir J 2015; 45: 1239–47. doi: 10.1183/09031936.00142414 - DOI - PMC - PubMed
    1. Stone IS, Barnes NC, Petersen SE. Chronic obstructive pulmonary disease: a modifiable risk factor for cardiovascular disease? Heart 2012; 98: 1055–62. doi: 10.1136/heartjnl-2012-301759 - DOI - PubMed
    1. Aberle DR, Adams AM, Berg CD, Black WC, Clapp JD, Fagerstrom RM, et al. Reduced lung-cancer mortality with low-dose computed tomographic screening. N Engl J Med 2011; 365: 395–409. doi: 10.1056/NEJMoa1102873 - DOI - PMC - PubMed

MeSH terms