. 2019 Nov 12;24(22):4085.
doi: 10.3390/molecules24224085.

Investigation of Molecular Details of Keap1-Nrf2 Inhibitors Using Molecular Dynamics and Umbrella Sampling Techniques

Affiliations

Investigation of Molecular Details of Keap1-Nrf2 Inhibitors Using Molecular Dynamics and Umbrella Sampling Techniques

Ashwini Machhindra Londhe et al. Molecules. .

Abstract

In this study, we investigate the atomistic details of Keap1-Nrf2 inhibitors by in-depth modeling techniques, including molecular dynamics (MD) simulations, and the path-based free energy method of umbrella sampling (US). The protein-protein interaction (PPI) of Keap1-Nrf2 is implicated in several neurodegenerative diseases like cancer, diabetes, and cardiomyopathy. A better understanding of the five sub-pocket binding sites for Nrf2 (ETGE and DLG motifs) inside the Kelch domain would expedite the inhibitor design process. We selected four protein-ligand complexes with distinct co-crystal ligands and binding occupancies inside the Nrf2 binding site. We performed 100 ns of MD simulation for each complex and analyzed the trajectories. From the results, it is evident that one ligand (1VV) has flipped inside the binding pocket, whereas the remaining three were stable. We found that Coulombic (Arg483, Arg415, Ser363, Ser508, and Ser602) and Lennard-Jones (Tyr525, Tyr334, and Tyr572) interactions played a significant role in complex stability. The obtained binding free energy values from US simulations were consistent with the potencies of simulated ligands. US simulation highlight the importance of basic and aromatic residues in the binding pocket. A detailed description of the dissociation process brings valuable insight into the interaction of the four selected protein-ligand complexes, which could help in the future to design more potent PPI inhibitors.

Keywords: Keap1-NRF2 inhibitors; MD simulations; PPI inhibition; US simulation; binding free energy; molecular modeling.


Conflict of interest statement

The authors declare no conflict of interest.

Figures

Figure 1
Figure 1
Co-crystal ligand structures of 5FNU, 4XMB, 5CGJ, and 4L7B.
Figure 2
Figure 2
System prepared for molecular dynamics simulation. Protein–ligand complex kept at the center of the box. The 20 Å box is solvated and neutralized with sodium and chloride ions, shown as blue and pink spheres. Water shown in transparent surface representation. The protein is shown in green-colored cartoon representation and the ligand with red-colored stick format.
Figure 3
Figure 3
RMSD of ligand and protein backbone obtained from 50 MD simulation. RMSD of 5FNU_L6I, 4XMB_41P, 5CGJ_51M, and 4L7B_1VV shown. RMSD of protein backbone shown in black color. RMSD of L6I, 41P, 51M and 1VV ligands are shown in cyan, magenta, green, and purple respectively.
Figure 4
Figure 4
RMSD of ligand and protein backbone obtained from 100 ns MD simulation. RMSD of 5FNU_L6I, 4XMB_41P, 5CGJ_51M, and 4L7B_1VV shown. RMSD of protein backbone shown in black. RMSD of L6I, 41P, 51M and 1VV ligands shown in cyan, magenta, green, and purple respectively.
Figure 5
Figure 5
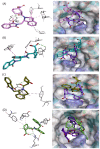
1VV ligand flipped and change orientation during MD simulation. Ligand–protein interactions at 15 ns (A), 35 ns (B), 45 ns (C), and 70 ns (D) shown by pink, cyan, deep olive, and green respectively. Overlapped co-crystal ligand orientation shown in purple.
Figure 6
Figure 6
Assessment of number of H-bonds during 50 ns MD simulations.
Figure 7
Figure 7
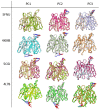
Principal component analysis. Eigenvectors from 50 ns MD trajectories depicting the movement of Cα atoms in four crystal structures. The initial position of the protein backbone shown in wheat, gray-white, pink, and green for 5FNU, 4XMB, 5CGJ, and 4L7B, respectively. The movements of flexible parts of the protein shown with arrows with red heads and blue tails.
Figure 8
Figure 8
Free energy landscapes of four crystal structures during 50 ns MD simulation. 2D and 3D graphs projected on the first two principal components (PC1 + PC2). Blue spots indicate the energy minima.
Figure 9
Figure 9
Umbrella sampling system and snapshots of the center-of-mass-pulling. (A) US system constructed using a box with a z-axis 12 nm in length. To pull the ligand in the z-axis direction, the z-axis was elongated. The protein is shown in yellow and the ligand in cyan. Sodium and chloride ions are shown as purple and green spheres respectively. The solvent is shown in surface representation. (B) Snapshots of the center-of-mass-pulling simulation. Protein is shown in magenta cartoon representation and ligands in stick format.
Figure 10
Figure 10
Unbinding pathway for L6I (5FNU) ligand. PMF graph obtained from US simulation of L6I shown in the right side. 1a’, 1b’, 1c’, 1d’ and 1e’ are the energy minima’s and 1f’ is the equilibrium stage obtained during the US. L6I ligand shown in cyan-color stick format. The protein is shown as solid ribbon and binding site residues in yellow color stick format. Interactions such as H-bonds, electrostatic, π–π stacking, π–σ, π–sulfur, and π–alkyl/alkyl are shown in green, orange, dark pink, purple, yellow, and light pink, respectively.
Figure 11
Figure 11
Unbinding pathway for 41P (4XMB) ligand. PMF graph obtained from US simulation of 41P shown in the right side. 2a’, 2b’, 2c’, 2d’ and 2e’ are the energy minima’s and 2f’ is the equilibrium stage obtained during the US. 41P ligand shown in magenta stick format. Protein shown as transparent ribbon and binding site residues in green stick format. Interactions such as H-bonds, electrostatic, π–π stacking, π–σ, π–sulfur, and π–alkyl/alkyl are shown in green, orange, dark pink, purple, yellow and light pink, respectively.
Figure 12
Figure 12
Unbinding pathway for 51M (5CGJ) ligand. PMF graph obtained from US simulation of 51M shown at the center. 3a’, 3b’, 3c’, and 3d’ are the energy minima’s and 3f’ is the equilibrium stage obtained during the US. 51M ligand shown in green stick format. The protein shown as transparent ribbon and binding site residues in purple stick format. Interactions such as H-bonds, electrostatic, π–π stacking, π–σ, π–sulfur, and π–alkyl/alkyl are shown in green, orange, dark pink, purple, yellow, and light pink, respectively.
Figure 13
Figure 13
Unbinding pathway for 1VV (4L7B) ligand. PMF graph obtained from US simulation of 1VV shown in the left side. 4a’, 4b’, and 4c’ are the energy minima’s and 4d’ is the equilibrium stage obtained during the US. 1VV ligand shown in purple stick format. The protein shown as transparent ribbon and binding site residues in red stick format. Interactions such as H-bonds, electrostatic, π–π stacking, π–σ, π–sulfur, and π–alkyl/alkyl are shown in green, orange, dark pink, purple, yellow, and light pink, respectively.

References

    1. Marcotte D., Zeng W., Hus J.C., McKenzie A., Hession C., Jin P., Bergeron C., Lugovskoy A., Enyedy I., Cuervo H., et al. Small molecules inhibit the interaction of Nrf2 and the Keap1 Kelch domain through a non-covalent mechanism. Bioorgan. Med. Chem. 2013;21:4011–4019. doi: 10.1016/j.bmc.2013.04.019. - DOI - PubMed
    1. Bertrand H.C., Schaap M., Baird L., Georgakopoulos N.D., Fowkes A., Thiollier C., Kachi H., Dinkova-Kostova A.T., Wells G. Design, synthesis, and evaluation of triazole derivatives that induce Nrf2 dependent gene products and inhibit the Keap1–Nrf2 protein–protein interaction. J. Med. Chem. 2015;58:7186–7194. doi: 10.1021/acs.jmedchem.5b00602. - DOI - PubMed
    1. Jiang Z.Y., Lu M.C., Xu L.L., Yang T.T., Xi M.Y., Xu X.L., Guo X.K., Zhang X.J., You Q.D., Sun H.P. Discovery of potent Keap1–Nrf2 protein–protein interaction inhibitor based on molecular binding determinants analysis. J. Med. Chem. 2014;57:2736–2745. doi: 10.1021/jm5000529. - DOI - PubMed
    1. Zhuang C., Narayanapillai S., Zhang W., Sham Y.Y., Xing C. Rapid identification of Keap1–Nrf2 small-molecule inhibitors through structure-based virtual screening and hit-based substructure search. J. Med. Chem. 2014;57:1121–1126. doi: 10.1021/jm4017174. - DOI - PubMed
    1. Yasuda D., Nakajima M., Yuasa A., Obata R., Takahashi K., Ohe T., Ichimura Y., Komatsu M., Yamamoto M., Imamura R., et al. Synthesis of Keap1-phosphorylated p62 and Keap1-Nrf2 protein-protein interaction inhibitors and their inhibitory activity. Bioorganic Med. Chem. Lett. 2016;26:5956–5959. doi: 10.1016/j.bmcl.2016.10.083. - DOI - PubMed

MeSH terms

LinkOut - more resources