Comparative Study
. 2019 Nov 14;20(1):236.
doi: 10.1186/s13059-019-1851-8.

Differential co-expression-based detection of conditional relationships in transcriptional data: comparative analysis and application to breast cancer

Affiliations
Comparative Study

Differential co-expression-based detection of conditional relationships in transcriptional data: comparative analysis and application to breast cancer

Dharmesh D Bhuva et al. Genome Biol. .

Abstract

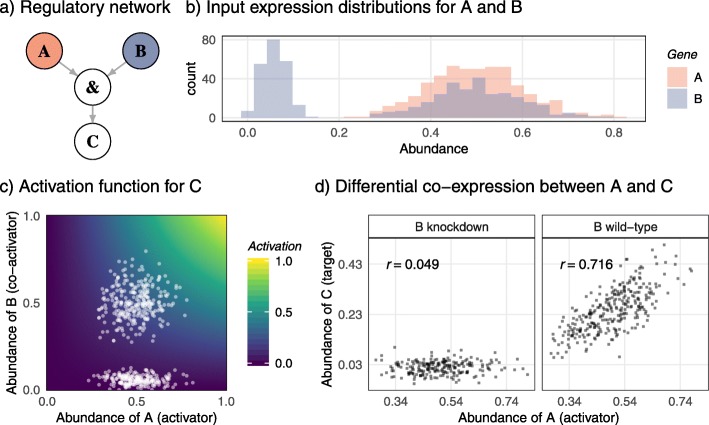
Background: Elucidation of regulatory networks, including identification of regulatory mechanisms specific to a given biological context, is a key aim in systems biology. This has motivated the move from co-expression to differential co-expression analysis and numerous methods have been developed subsequently to address this task; however, evaluation of methods and interpretation of the resulting networks has been hindered by the lack of known context-specific regulatory interactions.

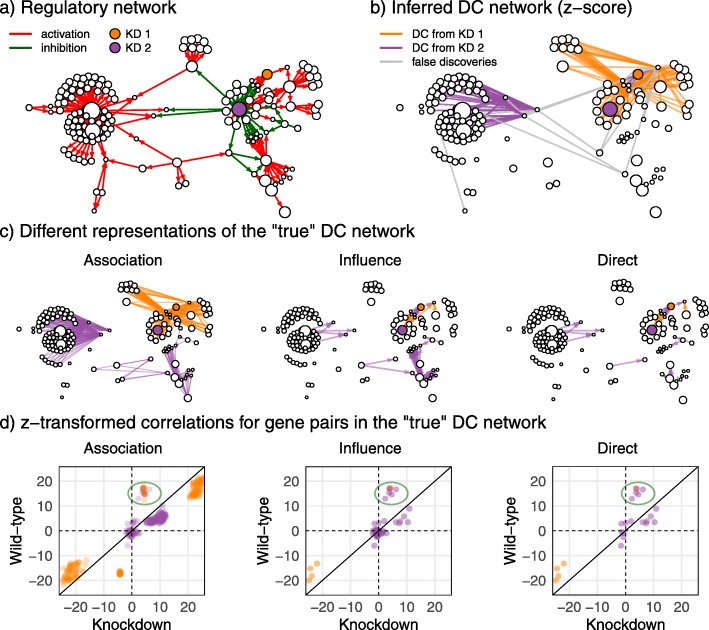
Results: In this study, we develop a simulator based on dynamical systems modelling capable of simulating differential co-expression patterns. With the simulator and an evaluation framework, we benchmark and characterise the performance of inference methods. Defining three different levels of "true" networks for each simulation, we show that accurate inference of causation is difficult for all methods, compared to inference of associations. We show that a z-score-based method has the best general performance. Further, analysis of simulation parameters reveals five network and simulation properties that explained the performance of methods. The evaluation framework and inference methods used in this study are available in the dcanr R/Bioconductor package.

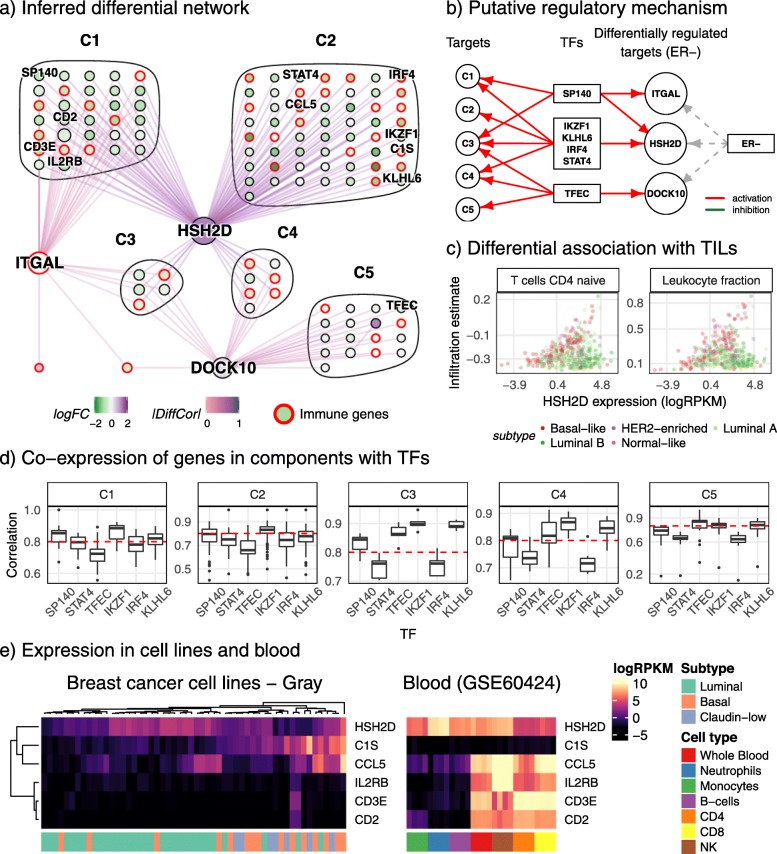
Conclusions: Our analysis of networks inferred from simulated data show that hub nodes are more likely to be differentially regulated targets than transcription factors. Based on this observation, we propose an interpretation of the inferred differential network that can reconstruct a putative causal network.

Keywords: Breast cancer; Differential co-expression; Differential networks; Gene regulation; Immune infiltration; Systems modelling.


Conflict of interest statement

The authors declare that they have no competing interests.

Figures

Fig. 1
Fig. 1
A simple regulatory network demonstrating differential co-expression. a Schematic of the regulatory network. Genes A and B are input genes and co-activate gene C. b Histograms showing the distribution of expression values for A and B across 500 simulated expression profiles. Gene A is always wildtype whereas gene B is knocked down in about half of the samples. c Scatterplot of expression values for A and B. Background shading shows the activation function generated by A and B used to model regulation of C. d Scatterplots of expression values for A and C, knockdown of B (left panel) and B wildtype samples (right panel). Gene A is highly correlated with C (r = 0.716) when B is at wildtype expression levels but uncorrelated with C (r = 0.049) when B is knocked down
Fig. 2
Fig. 2
Differential co-expression analysis of an example network with 150 genes and 500 samples. a The regulatory network used to simulate the data and the two knockdown genes (KDs) (orange and purple nodes). b A differential co-expression (DC) network inferred from the simulated data using the z-score method. Interactions shown have significantly different correlations between knockdown and wildtype states (FDR < 0.1). Correct predictions for each knockdown as per the “true” differential association network are coloured respectively with false positives in grey. c Three representations of the true co-expression network obtained from a perturbation analysis of the regulatory network. Direct differential interactions are a subset of differential influences which are in turn a subset of differential associations. d Empirical z-transformed correlations for each interaction in the respective “true” networks. The association network shows a similar correlation profile to the direct and influence networks but with added points, as shown for example by the circled points
Fig. 3
Fig. 3
Most methods tend to infer the association DC network. Performance of 11 DC inference methods and 2 co-expression methods (highlighted in grey) across 812 different simulations with approximately 500 observations sampled. Performance is quantified using the F1 score and is computed for the three different representations of DC networks: direct, influence, and association. Methods are sorted based on the sum of their F1 scores across all simulations and truth networks. For co-expression methods, the difference of co-expression networks generated separately in each condition was taken as the DC network
Fig. 4
Fig. 4
A DC sub-network in ER tumours is associated with lymphocyte infiltration. a The DC sub-network with candidate differentially regulated targets DOCK10, HSH2D, and ITGAL, and TFs TFEC, SP140, IKZF1, KLHL6, IRF4, and STAT4. Nodes are coloured based on log fold-change conditioned on ER status and edges coloured based on differences in correlations. Genes are clustered based on the target they are differentially co-expressed with. b A putative regulatory mechanism proposed from the DC network with insights gained from simulations. Dashed lines indicate a potentially indirect yet causal interaction. c Differential association of HSH2D with tumour-infiltrating lymphocytes (TILs) with infiltration estimated from a naïve T cell signature using singscore (left), and from H&E-stained slides (Saltz. Gupta, et al.). Associations indicate that HSH2D is a marker of lymphocyte infiltration specific to basal-like tumours. d correlations of genes in clusters C1-C5 with all transcription factors. The red line indicates a correlation of 0.8, showing stronger co-expression with TFs in the same cluster. e Expression of selected genes in cancer cell lines annotated with cancer sub-type and blood data annotated with immune cell type. Genes in the DC network have high expression in blood and are rarely expressed in cell lines

References

    1. Khatri P, Sirota M, Butte AJ. Ten years of pathway analysis: current approaches and outstanding challenges. PLoS Comput Biol. 2012;8:e1002375. doi: 10.1371/journal.pcbi.1002375. - DOI - PMC - PubMed
    1. Subramanian A, Tamayo P, Mootha VK, Mukherjee S, Ebert BL, Gillette MA, Paulovich A, Pomeroy SL, Golub TR, Lander ES, Mesirov JP. Gene set enrichment analysis: a knowledge-based approach for interpreting genome-wide expression profiles. Proc Natl Acad Sci U S A. 2005;102:15545–15550. doi: 10.1073/pnas.0506580102. - DOI - PMC - PubMed
    1. Wu D, Lim E, Vaillant F, Asselin-Labat ML, Visvader JE, Smyth GK. ROAST: rotation gene set tests for complex microarray experiments. Bioinformatics. 2010;26:2176–2182. doi: 10.1093/bioinformatics/btq401. - DOI - PMC - PubMed
    1. Zhang B, Horvath S. A general framework for weighted gene co-expression network analysis. Stat Appl Genet Mol Biol. 2005;4:Article17. doi: 10.2202/1544-6115.1128. - DOI - PubMed
    1. Fuller TF, Ghazalpour A, Aten JE, Drake TA, Lusis AJ, Horvath S. Weighted gene coexpression network analysis strategies applied to mouse weight. Mamm Genome. 2007;18:463–472. doi: 10.1007/s00335-007-9043-3. - DOI - PMC - PubMed

Publication types

LinkOut - more resources