. 2019 Dec;40(12):2146-2153.
doi: 10.3174/ajnr.A6306. Epub 2019 Nov 14.

Topological Alterations of the Structural Brain Connectivity Network in Children with Juvenile Neuronal Ceroid Lipofuscinosis

Affiliations

Topological Alterations of the Structural Brain Connectivity Network in Children with Juvenile Neuronal Ceroid Lipofuscinosis

T Roine et al. AJNR Am J Neuroradiol. 2019 Dec.

Abstract

Background and purpose: We used diffusion MR imaging to investigate the structural brain connectivity networks in juvenile neuronal ceroid lipofuscinosis, a neurodegenerative lysosomal storage disease of childhood. Although changes in conventional MR imaging are typically not visually apparent in children aged <10 years, we previously found significant microstructural abnormalities by using diffusion MR imaging. Therefore, we hypothesized that the structural connectivity networks would also be affected in the disease.

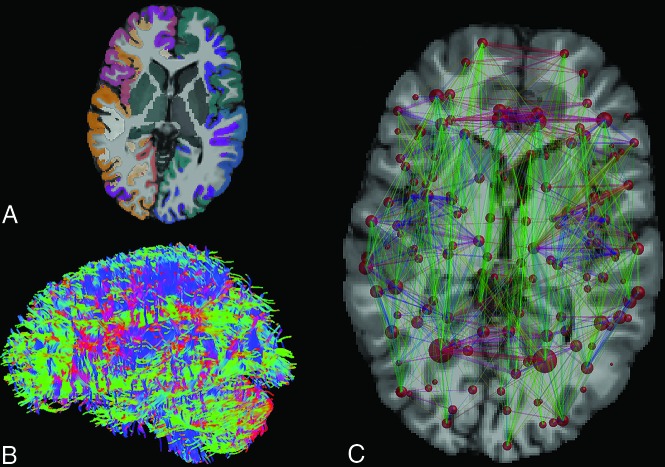
Materials and methods: We acquired diffusion MR imaging data from 14 children with juvenile neuronal ceroid lipofuscinosis (mean ± SD age, 9.6 ± 3.4 years; 10 boys) and 14 control subjects (mean ± SD age, 11.2 ± 2.3 years; 7 boys). A follow-up MR imaging was performed for 12 of the patients (mean ± SD age, 11.4 ± 3.2 years; 8 boys). We used graph theoretical analysis to investigate the global and local properties of the structural brain connectivity networks reconstructed with constrained spherical deconvolution-based whole-brain probabilistic tractography.

Results: We found significantly increased characteristic path length (P = .003) and decreased degree (P = .003), which indicated decreased network integration and centrality in children with juvenile neuronal ceroid lipofuscinosis. The findings were similar for the follow-up MR imaging, and there were no significant differences between the two acquisitions of the patients. In addition, we found that the disease severity correlated negatively (P < .007) with integration, segregation, centrality, and small-worldness of the networks. Moreover, we found significantly (P < .0003) decreased local efficiency in the left supramarginal gyrus and temporal plane, and decreased strength in the right lingual gyrus.

Conclusions: We found significant global and local network alterations in juvenile neuronal ceroid lipofuscinosis that correlated with the disease severity and in areas related to the symptomatology.


Figures

Fig 1.
Fig 1.
Reconstruction of the structural brain connectivity networks. A, Cortical and subcortical parcellation of the T1WI results in 164 gray matter regions. B, Whole-brain probabilistic streamlines tractography based on the corrected DWI can be used to reconstruct structural connectivity pathways of the brain. C, The structural brain connectivity network, in which the nodes represent the gray matter areas and the edges are weighted by the number of streamlines that connect the nodes. The size of the nodes corresponds to the volume of the gray matter area. The width of the edges corresponds to the number of streamlines, and the color of the edges corresponds to the direction of the connection (red: left-right, green: anterior-posterior, blue: superior-inferior).
Fig 2.
Fig 2.
Scatterplots and the fitted lines, describing the correlation between the global network properties and UPDRS Part III: motor examination scores. Statistically significant (Bonferroni corrected) correlation coefficients (c) are marked with an asterisk.
Fig 3.
Fig 3.
Local differences in betweenness centrality, local efficiency, and strength between the second acquisition of the patients with CLN3 and the control subjects. The size of the nodes illustrates the volume of the gray matter region, and the color indicates the statistical significance of the differences (P values). Significant differences (P < .0003) after a Bonferroni correction for multiple comparisons are highlighted with red circles. Local efficiency was decreased in the left supramarginal gyrus and the left temporal plane, and strength was decreased in the right lingual gyrus.

References

    1. Tournier JD, Mori S, Leemans A.. Diffusion tensor imaging and beyond. Magn Reson Med 2011;65:1532–56 10.1002/mrm.22924 - DOI - PMC - PubMed
    1. Smith SM, Jenkinson M, Johansen-Berg H.. Tract-based spatial statistics: voxelwise analysis of multi-subject diffusion data. Neuroimage 2006;31:1487–505 10.1016/j.neuroimage.2006.02.024 - DOI - PubMed
    1. Jones DK, Knösche TR, Turner R.. White matter integrity, fiber count, and other fallacies: The do’s and don’ts of diffusion MRI. Neuroimage 2013;73:239–54 10.1016/j.neuroimage.2012.06.081 - DOI - PubMed
    1. Bach M, Laun FB, Leemans A, et al. . Methodological considerations on tract-based spatial statistics (TBSS). Neuroimage 2014;100:358–69 10.1016/j.neuroimage.2014.06.021 - DOI - PubMed
    1. Hagmann P, Cammoun L, Gigandet X, et al. . Mapping the structural core of human cerebral cortex. PLoS Biol 2008;6:e159 10.1371/journal.pbio.0060159 - DOI - PMC - PubMed

Publication types

LinkOut - more resources