. 2019 Dec 12;222(Pt 24):jeb211920.
doi: 10.1242/jeb.211920.

Disparate responses to salinity across species and organizational levels in anchialine shrimps

Affiliations

Disparate responses to salinity across species and organizational levels in anchialine shrimps

Justin C Havird et al. J Exp Biol. .

Abstract

Environmentally induced plasticity in gene expression is one of the underlying mechanisms of adaptation to habitats with variable environments. For example, euryhaline crustaceans show predictable changes in the expression of ion-transporter genes during salinity transfers, although studies have typically been limited to specific genes, taxa and ecosystems of interest. Here, we investigated responses to salinity change at multiple organizational levels in five species of shrimp representing at least three independent invasions of the anchialine ecosystem, defined as habitats with marine and freshwater influences with spatial and temporal fluctuations in salinity. Although all five species were generally strong osmoregulators, salinity-induced changes in gill physiology and gene expression were highly species specific. While some species exhibited patterns similar to those of previously studied euryhaline crustaceans, instances of distinct and atypical patterns were recovered from closely related species. Species-specific patterns were found when examining: (1) numbers and identities of differentially expressed genes, (2) salinity-induced expression of genes predicted a priori to play a role in osmoregulation, and (3) salinity-induced expression of orthologs shared among all species. Notably, ion transport genes were unchanged in the atyid Halocaridina rubra while genes normally associated with vision and light perception were among those most highly upregulated. Potential reasons for species-specific patterns are discussed, including variation among anchialine habitats in salinity regimes and divergent evolution in anchialine taxa. Underexplored mechanisms of osmoregulation in crustaceans revealed here by the application of transcriptomic approaches to ecologically and taxonomically understudied systems are also explored.

Keywords: Acclimation; Atyidae; Euryhalinity; RNA-Seq.


Conflict of interest statement

Competing interestsThe authors declare no competing or financial interests.

Figures

Fig. 1.
Fig. 1.
Inferred evolutionary relationships among the anchialine shrimp species examined here. Anchialine taxa are in red. The five study species are pictured along with their sampling locations in the Hawaiian Islands or Okinawa, Japan. Yellow and blue shading indicate clades with freshwater and marine ancestries, respectively. See figshare dataset (see ‘Data availability’ section, below) for details on phylogenetic inference.
Fig. 2.
Fig. 2.
AgNO3 staining of ion-transporting epithelia in the gills of the study species. (A) Halocaridina rubra (n=10, data taken from Havird et al., 2014c). (B) Halocaridinides trigonophthalma (n=6 and 4 at 2‰ and 32‰). (C) Caridina rubella (n=5). (D) Metabetaeus minutus (n=3 and 4 at 4‰ and 32‰). Both left and right gills were used. Lowercase letters indicate significant groupings among gills (ANOVA with Tukey post hoc analysis at P<0.05) while asterisks indicate significant differences between salinities for specific gills (Student's unpaired t-test at P<0.05). Error bars show ±s.e.m.
Fig. 3.
Fig. 3.
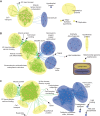
Gene-set enrichment networks between different time points after salinity transfer for gill tissue of Halocaridina rubra. Differentially expressed genes (DEGs) were identified following transfer from 32‰ to 15‰ at (A) 3 h, (B) 8 h and (C) 48 h after transfer (using DESeq) and enriched biological themes via gene ontology terms and functionally related gene groups were visualized using DAVID. Each node depicts a gene set, with sizes corresponding to the number of DEGs either upregulated (inner circle) or downregulated (outer circle) in a gene set after transfer. Nodes with high interconnectivity between biological themes are labeled. Enrichment significance as upregulated or downregulated is displayed as red color intensity of the inner or outer circles in each node, respectively. Green and blue edges represent upregulation and downregulation, with edge size indicating the number of genes that overlap between the connected nodes. Clusters of nodes with related functions are manually labeled, with upregulated and downregulated clusters highlighted in yellow and purple, respectively.
Fig. 4.
Fig. 4.
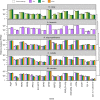
Salinity-induced gene expression values for specific genes of interest shared by the anchialine shrimp species examined here. Gene expression was measured via TMM (trimmed mean of M-values)-normalized FPKM (fragments per kilobase of transcript per million mapped reads). Categories of genes (left to right): ion transporters, stress-related and OXPHOS subunits. Note that for C. rubella, 32‰ was investigated instead of 45‰. Shading used for H. rubra indicates that only 15‰ was investigated, but at three time points (3, 8 and 48 h are indicated with light to dark shading). Error bars show ±s.e.m. For additional statistical analyses, see Fig. S6 of figshare dataset (see ‘Data availability’ section, below).
Fig. 5.
Fig. 5.
Between-group analyses of 631 shared orthologs for the anchialine shrimp species examined here. (A) Samples from all treatments and species mapped onto the first two principal components from the between-group analyses (BGA). Points represent biological replicates. Solid lines connect samples from the same treatment. Treatments are represented by different colors. (B) Direction of change in ortholog expression during salinity transfer. Arrows connect the center of each ‘reference salinity’ ellipse (shown with black points) to the center of the ‘treatment’ ellipses in A. Lengths of arrows are relevant within a species, but not among species. Green arrows indicate high to low salinity transfers; blue arrows indicate the opposite direction.

References

    1. Anders S. and Huber W. (2010). Differential expression analysis for sequence count data. Genome Biol. 11, R106 10.1186/gb-2010-11-10-r106 - DOI - PMC - PubMed
    1. Anker A. (2010). Metabetaeus Borradaile, 1899 revisited, with description of a new marine species from French Polynesia (Crustacea: Decapoda: Alpheidae). Zootaxa 2552, 37-54. 10.11646/zootaxa.2552.1.2 - DOI
    1. Cameron J. N. (1978). NaCl balance in blue crabs, Callinectes sapidus, in fresh water. J. Comp. Physiol. B Biochem. Syst. Environ. Physiol. 123, 127-135. 10.1007/BF00687840 - DOI
    1. Chen K., Li E. C., Gan L., Wang X. D., Xu C., Lin H. Z., Qin J. G. and Chen L. Q. (2014). Growth and lipid metabolism of the pacific white shrimp Litopenaeus vannamei at different salinities. J. Shellfish Res. 33, 825-832. 10.2983/035.033.0317 - DOI
    1. Chen K., Li E. C., Li T. Y., Xu C., Wang X. D., Lin H. Z., Qin J. G. and Chen L. Q. (2015). Transcriptome and molecular pathway analysis of the hepatopancreas in the pacific white shrimp Litopenaeus vannamei under chronic low-salinity stress. PLoS ONE 10, e0131503 10.1371/journal.pone.0131503 - DOI - PMC - PubMed

Publication types