. 2020 Jan 6;219(1):e201907210.
doi: 10.1083/jcb.201907210.

Cryo-EM structure of the complete and ligand-saturated insulin receptor ectodomain

Affiliations

Cryo-EM structure of the complete and ligand-saturated insulin receptor ectodomain

Theresia Gutmann et al. J Cell Biol. .

Abstract

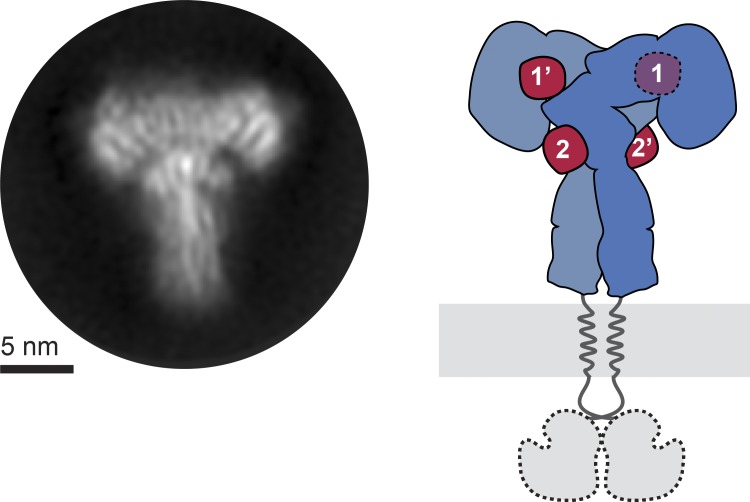
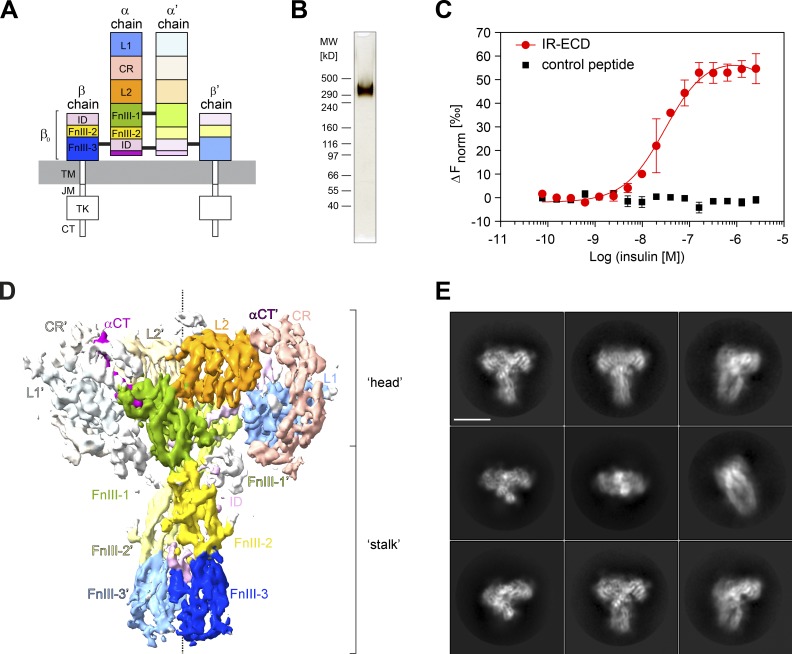
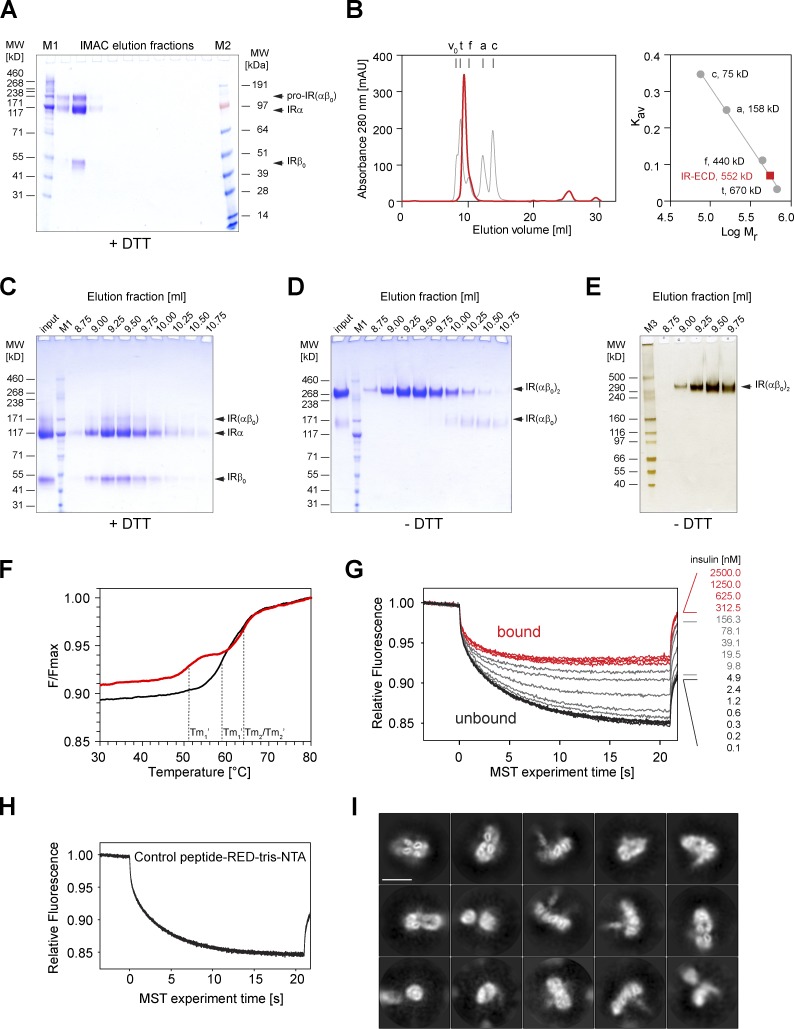
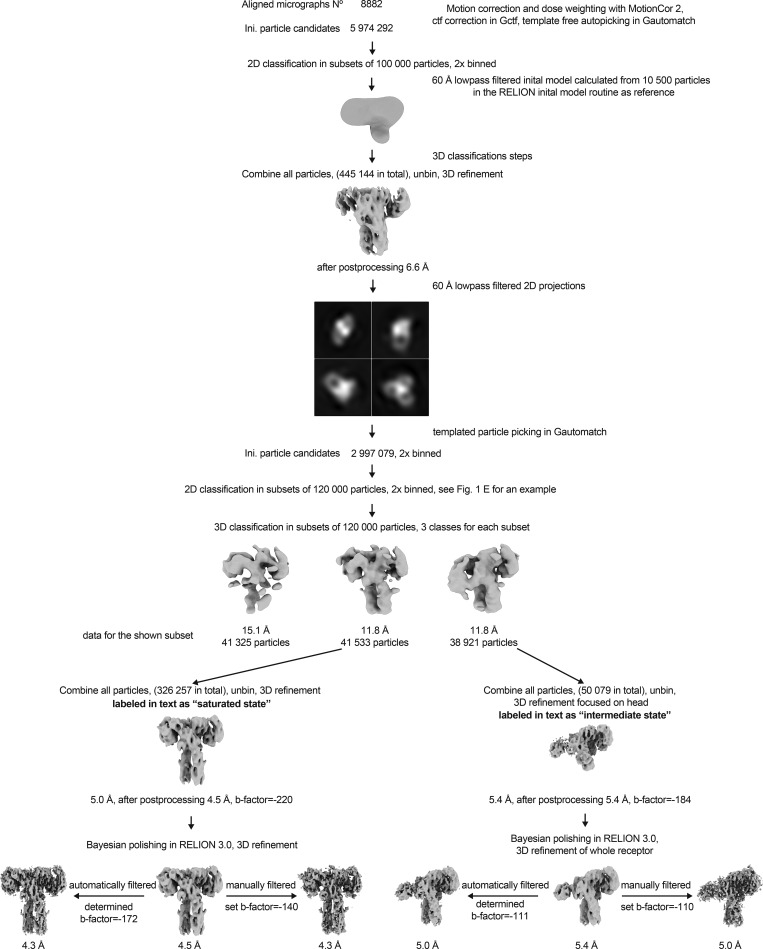
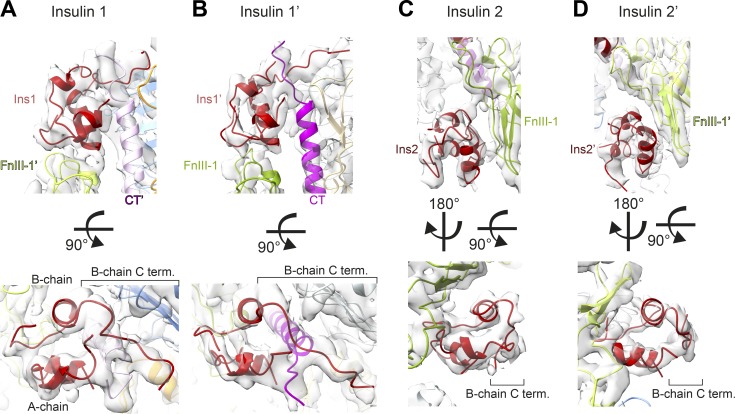
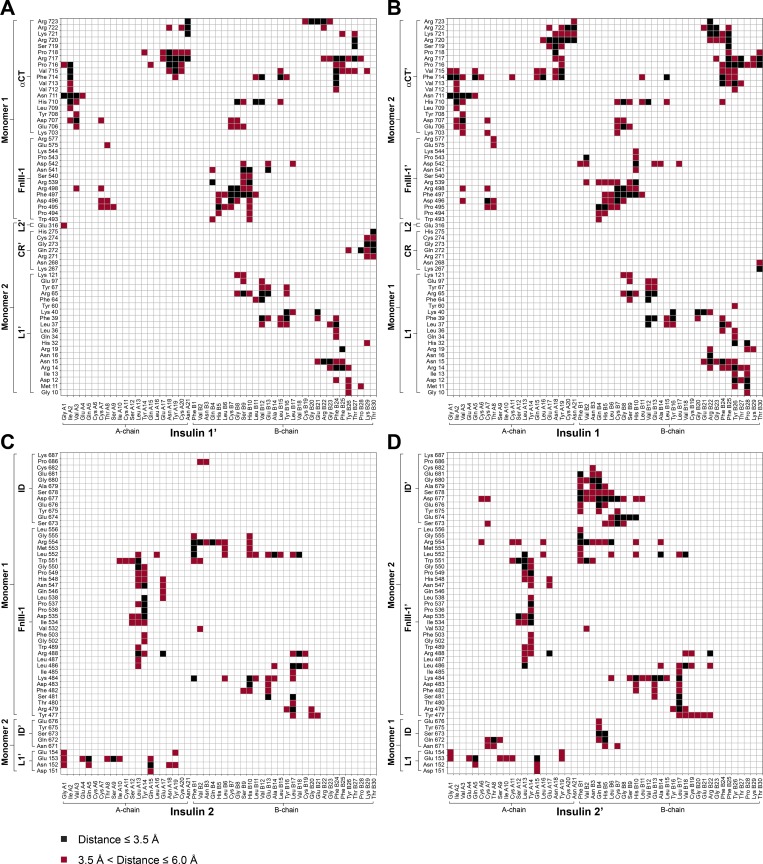
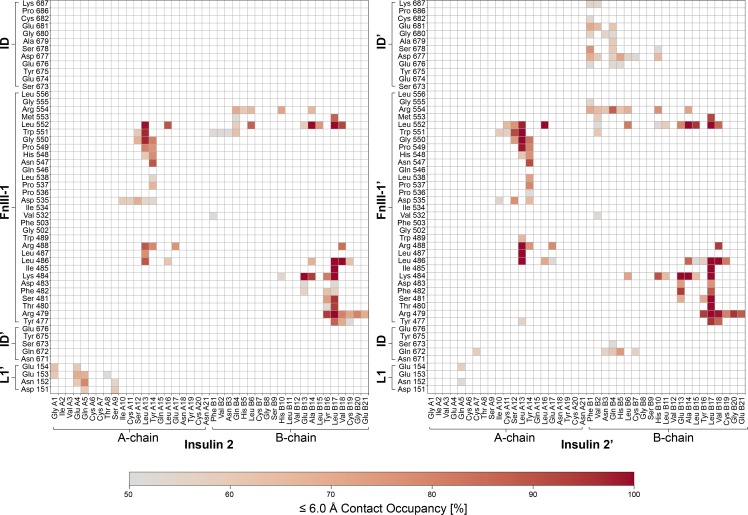
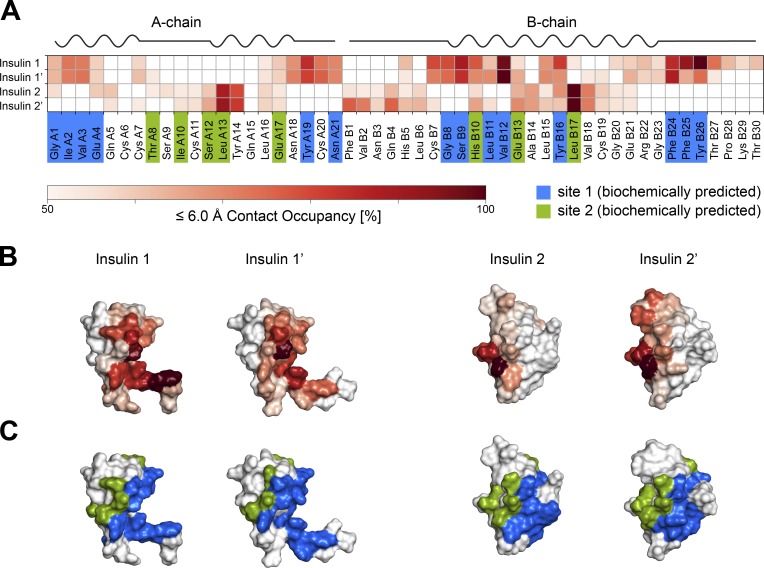
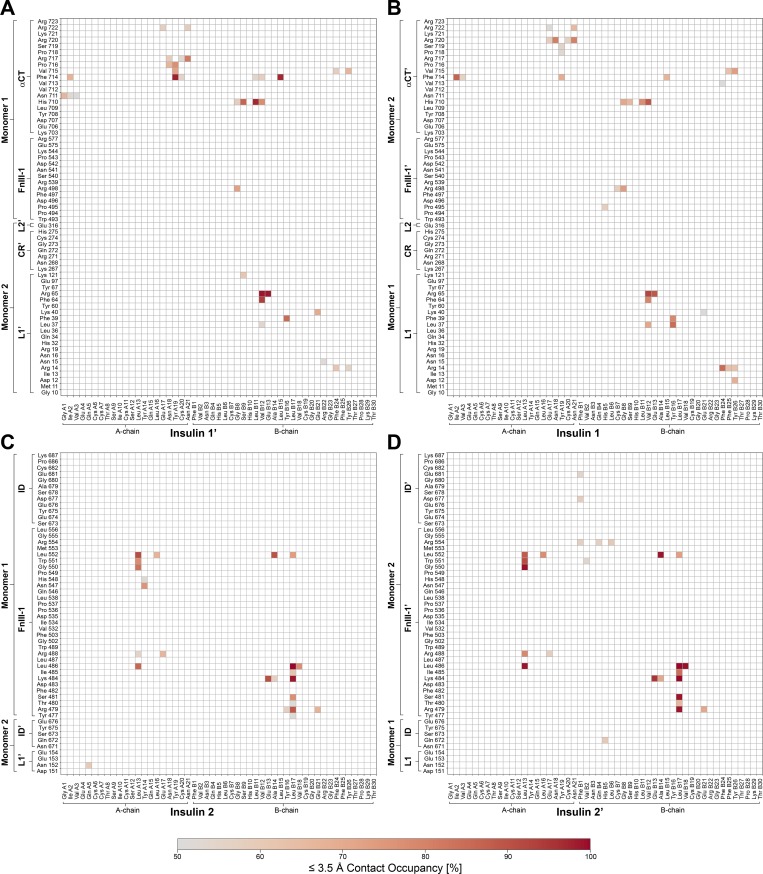
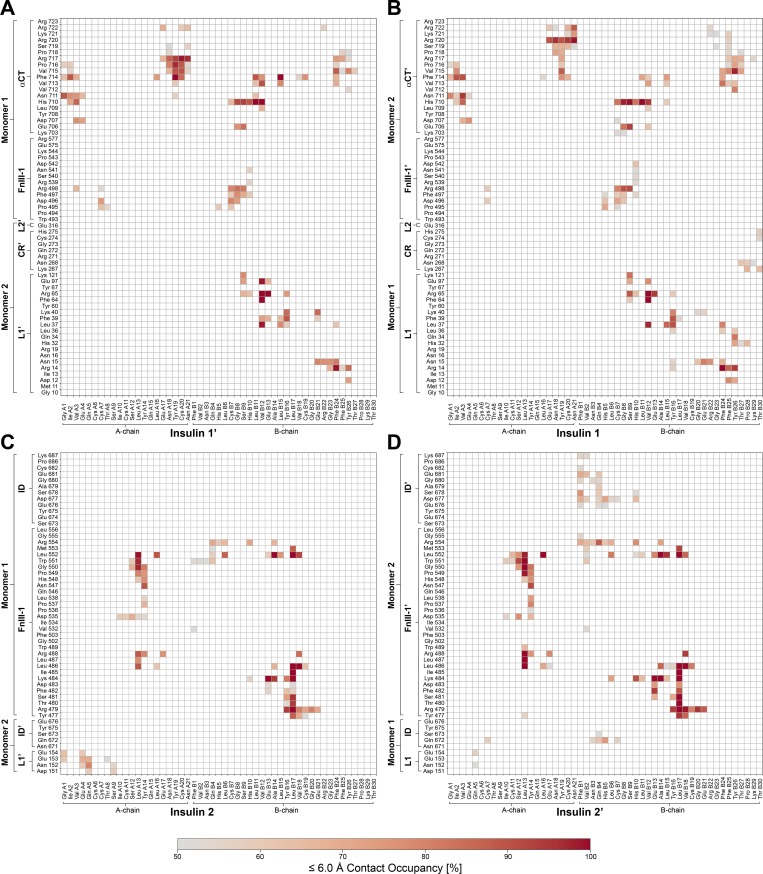
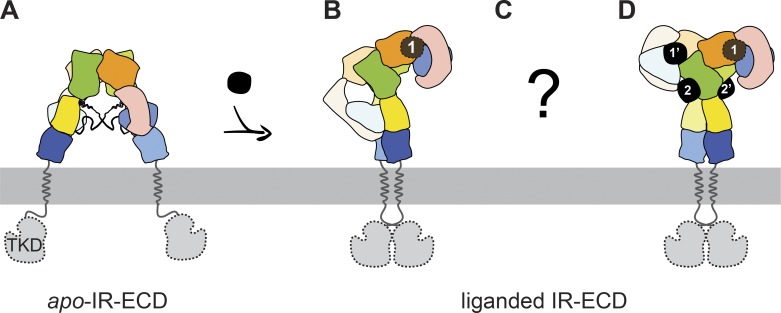
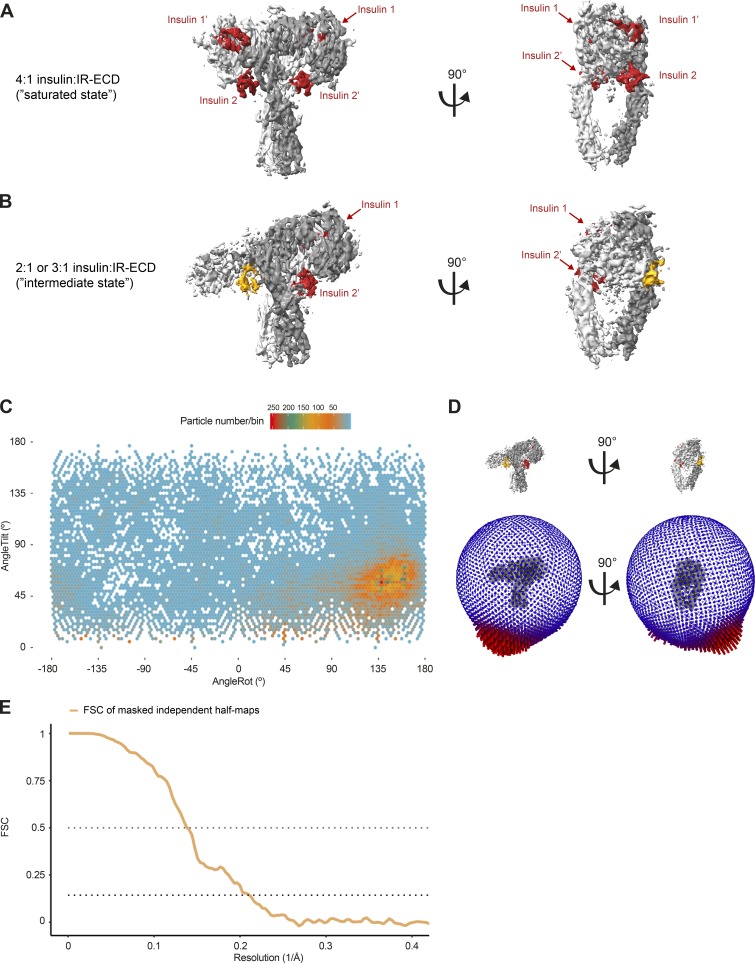
Glucose homeostasis and growth essentially depend on the hormone insulin engaging its receptor. Despite biochemical and structural advances, a fundamental contradiction has persisted in the current understanding of insulin ligand-receptor interactions. While biochemistry predicts two distinct insulin binding sites, 1 and 2, recent structural analyses have resolved only site 1. Using a combined approach of cryo-EM and atomistic molecular dynamics simulation, we present the structure of the entire dimeric insulin receptor ectodomain saturated with four insulin molecules. Complementing the previously described insulin-site 1 interaction, we present the first view of insulin bound to the discrete insulin receptor site 2. Insulin binding stabilizes the receptor ectodomain in a T-shaped conformation wherein the membrane-proximal domains converge and contact each other. These findings expand the current models of insulin binding to its receptor and of its regulation. In summary, we provide the structural basis for a comprehensive description of ligand-receptor interactions that ultimately will inform new approaches to structure-based drug design.


Figures

None
Graphical abstract
Figure 1.
Figure 1.
IR-ECD purification and cryo-EM. (A) Scheme of IR domain architecture. L1 and L2, leucine-rich repeat domains 1 and 2; CR, cysteine-rich domain; FnIII-1, -2, -3, fibronectin type-III domains 1, 2, 3; TM, transmembrane; JM, juxtamembrane; TK, tyrosine kinase domain; CT, C-terminal tail. The α C-terminal regions (αCT and αCT′) are drawn in purple. Black lines indicate intersubunit disulfide bonds. A prime (′) denotes the chain, domain, or residue within the second protomer. (B) Purified dimeric IR-ECD (IR(αβ0)2) migrates as a single band with an apparent molecular weight of 351 kD on a nonreducing 3–8% Tris-acetate SDS-PAGE gel as visualized by silver staining. (C) Equilibrium binding to native human insulin in solution was assessed by MST of IR-ECD after Tris-NTA-RED labeling. An 8xHis-tagged control peptide served as negative control to rule out unspecific binding or interference with the Tris-NTA-RED dye (Fig. S1 H). The normalized fluorescence difference (ΔFnorm) is plotted against ligand concentration. Error bars display standard deviations; n = 3. (D) Front view of the IR-ECD cryo-EM density map saturated with insulin ligands at 4.3 Å estimated nominal global resolution. Subdomains are colored as in A. (E) Representative 2D class averages of particles contributing to the reconstruction in D of the IR-ECD exposed to human insulin. Scale bar, 10 nm.
Figure S1.
Figure S1.
Purification and biochemical characterization of IR-ECD. (A) Coomassie G-250 Brilliant Blue–stained 4–12% Bis-Tris gel run in MOPS buffer of the IMAC elution fractions under reducing conditions. (B) The peak fraction containing IR-ECD was further purified by size exclusion chromatography on a Superdex 200 Increase 10/300 GL column. The void volume (v0) and elution volumes of the standards bovine thyroid thyroglobulin (t), horse spleen ferritin (f), rabbit muscle aldolase (a), and egg white conalbumin (c) are indicated. The partition coefficient (Kav) is plotted against the logarithm of molecular weight for standards (right) to determine the IR-ECD apparent molecular weight, which is considerably larger than in denaturing SDS-PAGE, presumably due to its elongated shape in solution. (C and D) Samples of eluted fractions were analyzed by SDS-PAGE on 3–8% Tris-Acetate gels under reducing (C) and nonreducing (D) conditions, stained with Coomassie G-250 BrilliantBlue. (E) Silver-stained 3–8% Tris-Acetate SDS-PAGE gel corresponding to the single lane shown in Fig. 1 B. The apparent molecular weight was estimated to be 351 kD for IR-ECD (IR(αβ0)2), 120–130 kD for the α subunit (IRα), and 50–54 kD for the extracellular IR β (IRβ0) subunit as estimated with HiMark unstained protein standards (M3). Other markers used here were HiMark prestained protein standard (M1) and SeeBlue Plus2 prestained protein standard (M2). (F) Thermal unfolding of IR-ECD was assessed in the absence (black) or presence (red) of 50 µM human insulin by recording intrinsic tryptophan autofluorescence ratios at 350 and 330 nm. The plot shows temperature-dependent normalized tryptophan autofluorescence. The melting temperatures in the absence of insulin (Tm1, Tm2) and in the presence of insulin (Tm1′, Tm2′) are indicated. (G) Representative MST traces of 10 nM IR-ECD (labeled with RED-Tris-NTA) after exposure to insulin. Native insulin at concentrations from 2.5 µM to 76 pM was titrated against 10 nM soluble RED-Tris-NTA–labeled IR-ECD. The corresponding dose–response curve is plotted in Fig. 1 C. (H) To rule out nonspecific interactions or interference with the labeling strategy, MST traces of a synthetic control peptide labeled with RED-Tris-NTA were recorded after exposure to insulin (same concentrations as in G) and confirmed not to interact with insulin at concentrations ≤2.5 µM. (I) 2D class averages of the apo-IR-ECD obtained by cryo-EM. Scale bar, 10 nm.
Figure S2.
Figure S2.
Overview of the cryo-EM data processing scheme. Particle sorting and classification scheme used for 3D reconstruction of the insulin–IR-ECD complex. The individual nominal global resolutions are quoted as good proxies for translational and rotational accuracy of reconstructions as well as for the level of detail observed in individual maps. Ini, initial.
Figure S3.
Figure S3.
Single-particle cryo-EM analysis of the insulin–IR-ECD complex. (A) Representative micrographs of the insulin–IR-ECD dataset. The scale bar in the cryo-EM micrograph corresponds to 100 Å, and the green circles (260-Å diameter) indicate particles contributing to the final reconstruction with a nominal global resolution of 4.3 Å (see Fig. S2). (B) Reference-free 2D class averages of the insulin–IR-ECD complex from an initial 2D classification run (see Fig. S2 for details). Some structural heterogeneity is apparent, especially in the stalk region. (C) Angular distribution of particles contributing to insulin–IR-ECD complex reconstruction. Tilt and rotation angles were plotted against each other for the final 4.3-Å 3D reconstruction. The color of each sampling bin indicates the number of particles in the respective bin. (D) In the spherical angular distribution representation, blue denotes fewer, and red more, particles (326,257 particles in total). (E) FSC of masked independent half-maps and of map-versus-model of the final insulin–IR-ECD reconstructions used for modeling and structure interpretation (see Fig. S2 for details). The nominal global resolution of the full insulin–IR-ECD complex was determined to be 4.3 Å according to the 0.143 cutoff criterion (Rosenthal and Henderson, 2003). Map-to-model correlation showed agreement at the 0.5 cutoff criterion to 4.6 Å. (F) Map of the insulin–IR-ECD complex colored according to local resolution estimate. The central parts of the head are resolved at higher resolution, whereas distal parts of the stalks are resolved at lower resolution.
Figure 2.
Figure 2.
Cryo-EM structure of the ligand-saturated IR-ECD. (A and B) Orthogonal views of the cryo-EM map and structure of the IR-ECD dimer complex. (C) Close-up of the membrane-proximal FnIII-3 domains. The color code for the individual domains in all panels is as in Fig. 1; the four insulin moieties are depicted in red.
Figure S4.
Figure S4.
Structural asymmetries in the cryo-EM structure and MD simulations of the ligand-saturated IR-ECD. (A) Asymmetries depicted in our cryo-EM structure. The panel on the left shows the two superimposed IR monomers. Monomer 1 domains are colored as in Fig. 1, and monomer 2 is colored in gray. The corresponding per-residue plot of the backbone RMSD between the two monomers is shown on the right. Individual domains are separated by dashed bold lines. (B) Backbone RMSD measured for IR residues averaged from 10 MD simulations. Red and blue lines indicate monomer 1 and 2, respectively. RMSDs were calculated over 500 ns with respect to the starting MD model. (C) Time-dependent backbone RMSD for the four bound insulins determined from 10 MD simulation repeats (R1–R10). RMSDs were calculated with respect to the initial MD model. (D) RMSD determined for insulin residues calculated with respect to the initial MD model and averaged over 10 MD simulation runs. (E) To monitor the B-chain C terminus dynamics, we recorded the distance between residues in the B-chain α helix and residues within the B-chain C terminus as indicated above with dashed lines. Cryo-EM structures of insulin 1 in the open conformation (left) and insulin 2 in the closed conformation (right) are displayed in cartoon representation. See Table S4 for the corresponding distance measurements from the cryo-EM structure and from MD simulations. Standard error of the mean for B and D are indicated as shadows.
Figure 3.
Figure 3.
MD simulations of insulin-saturated IR-ECD and interactions of membrane-proximal domains. (A) Orthogonal views of the complete insulin–IR-ECD starting model used for MD simulations in surface representation. One monomer is color-coded as in Fig. 1 with carbohydrates in purple and the insulin moieties in red. The second monomer is depicted in white. The disordered ID and C-terminal linker plus tag are shown in cartoon style colored in light violet and dark gray, respectively. (B) Contact map calculated from our cryo-EM structure showing interactions between ID/FnIII-3 domains of both monomers with contact cutoffs set to ≤3.5 Å (black) and ≤6 Å (red). (C) Contact occupancies calculated from MD simulations with the cutoff at 6 Å. Only contacts of ≥50% occupancy are displayed.
Figure 4.
Figure 4.
Binding sites and conformations of insulins bound to IR-ECD. (A–D) The cryo-EM density map and structure in close-up views of the four insulins and their receptor binding sites are displayed: insulin 1 (A), insulin 1′ (B), insulin 2 (C), and insulin 2′ (D). Insulin structures are aligned below for comparison illustrating the open conformation of site-1-bound insulins with a detached C-terminal B-chain segment in contrast to the closed conformation at site 2. Individual domains in all panels are colored as in Figs. 1 and 2.
Figure S5.
Figure S5.
Contact map for insulin–IR-ECD interactions in the cryo-EM structure. (A–D) Contact map showing interactions between IR-ECD and head-bound insulins 1′/1 (A and B) and stalk-bound insulins 2/2′ (C and D). The arrangement of the maps corresponds to the location of the respective insulin in the ECD (front view).
Figure 5.
Figure 5.
Characterization of the novel insulin binding sites 2 and 2′ interactions by MD simulations. Contact occupancies for insulin–IR-ECD interactions derived from our 10 × 500-ns MD simulations with a cutoff of 6.5 Å are depicted for insulin 2 (left) and insulin 2′ (right). Only contacts with an occupancy of ≥50% are displayed. See Figs. S5, S6, and S7 for contact maps comparing all insulin ligands in our cryo-EM structure and MD simulations.
Figure 6.
Figure 6.
Interactions of insulin with the IR-ECD binding sites 1 and 2. (A) Summary of per residue contact occupancies of the four insulins bound to IR-ECD in the MD simulations. The contact occupancies are encoded by shades of red. Only contacts of ≥50% occupancy are displayed. Residues shown previously to contribute to interactions with IR-ECD site 1 and site 2 in biochemical experiments are highlighted in blue and green, respectively. The secondary structure of human insulin is drawn schematically above the contact map (based on PDB 3I3Z). (B) Contact occupancies color-coded as in A are plotted on the structural models of the four insulins bound to the IR-ECD. (C) This is juxtaposed with coloring of biochemically predicted site 1 and site 2 residues in blue and green, respectively.
Figure S6.
Figure S6.
Contact occupancies for insulin–IR-ECD interactions with a cutoff of 3.5 Å in the MD simulations. (A–D) Contact map showing interactions between IR-ECD and head-bound insulins 1′/1 (A and B) and stalk-bound insulins 2/2′ (C and D). Only contacts with an occupancy >50% are displayed. The arrangement of the maps corresponds to the location of the respective insulin in the ECD (front view; Fig. 2 A).
Figure S7.
Figure S7.
Contact occupancies for insulin–IR-ECD interactions with a cutoff of 6.0 Å from MD simulations. (A–D) Contact map showing interactions between IR-ECD and head-bound insulins 1′/1 (A and B) and stalk-bound insulins 2/2′ (C and D). Only contacts with an occupancy >50% are displayed. The arrangement of the maps corresponds to the location of the respective insulin in the ECD (front view).
Figure 7.
Figure 7.
Schematic models of unliganded and liganded transition states for which complete IR-ECD structures have been reported. (A) Apo-IR-ECD (PDB 4ZXB; Croll et al., 2016). (B) Singly liganded IRΔβ-zipInsFv (PDB 6HN4 “lower” membrane-proximal part and PDB 6HN5 “upper” membrane-distal part; Weis et al., 2018). (C) Unknown intermediate states. (D) The four-insulin–saturated IR-ECD structure determined in this study. The subdomains are color-coded as in Fig. 1, and insulins are depicted in black with the respective binding site indicated.
Figure S8.
Figure S8.
Cryo-EM analysis of the insulin–IR-ECD intermediate state. (A and B) Front and side views of the 3D density maps of the saturated state bound to four insulins (A) and the intermediate state bound to at least two insulins (B). Densities corresponding to the first and second IRαβ0 protomers are colored in gray and white, respectively. Insulin moieties are depicted in red. For our intermediate state reconstruction, we could unambiguously assign insulin 1 and 2′ (in red). A density juxtaposed to binding site 2 (yellow) might correspond to insulin, but is insufficiently resolved to exclude it from corresponding to the receptor, such as the αCT peptide. We cautiously assign the intermediate state reconstruction as a two- or three-insulin–bound structural intermediate. The domains in the receptor head lacking insulin are strikingly tilted, and the FnIII-3 domains converge. (C) Angular distribution of particles contributing to the intermediate state reconstruction. Tilt and rotation angles were plotted against each other for the final intermediate state 3D reconstruction. The color of each sampling bin indicates the number of particles in the respective bin. (D) In the spherical angular distribution representation, blue denotes fewer, and red more, particles (50,079 particles in total). AngleRot, rotation angle. (E) FSC of masked independent half-maps of the final intermediate state map. The nominal global resolution of the intermediate state reconstruction was 5.0 Å according to the 0.143 cutoff criterion (Rosenthal and Henderson, 2003). This is most likely an overestimate due to the anisotropy in the distribution of views. For ease of interpretation, both the 0.5 and 0.143 cutoffs are indicated by dotted lines.

References

    1. Adams M.J., Blundell T.L., Dodson E.J., Dodson G.G., Vijayan M., Baker E.N., Harding M.M., Hodgkin D.C., Rimmer B., and Sheat S.. 1969. Structure of Rhombohedral 2 Zinc Insulin Crystals. Nature. 224:491-495.
    1. Afonine P.V., Poon B.K., Read R.J., Sobolev O.V., Terwilliger T.C., Urzhumtsev A., and Adams P.D.. 2018. Real-space refinement in PHENIX for cryo-EM and crystallography. Acta Crystallogr. D Struct. Biol. 74:531–544. 10.1107/S2059798318006551 - DOI - PMC - PubMed
    1. Alvarado D., Klein D.E., and Lemmon M.A.. 2010. Structural basis for negative cooperativity in growth factor binding to an EGF receptor. Cell. 142:568–579. 10.1016/j.cell.2010.07.015 - DOI - PMC - PubMed
    1. Baker E.N., Blundell T.L., Cutfield J.F., Cutfield S.M., Dodson E.J., Dodson G.G., Hodgkin D.M., Hubbard R.E., Isaacs N.W., Reynolds C.D., et al. . 1988. The structure of 2Zn pig insulin crystals at 1.5 A resolution. Philos. Trans. R. Soc. Lond. B Biol. Sci. 319:369–456. 10.1098/rstb.1988.0058 - DOI - PubMed
    1. Bartoschik T., Galinec S., Kleusch C., Walkiewicz K., Breitsprecher D., Weigert S., Muller Y.A., You C., Piehler J., Vercruysse T., et al. . 2018. Near-native, site-specific and purification-free protein labeling for quantitative protein interaction analysis by MicroScale Thermophoresis. Sci. Rep. 8:4977 10.1038/s41598-018-23154-3 - DOI - PMC - PubMed

Publication types