. 2020 Jan 15;40(3):619-631.
doi: 10.1523/JNEUROSCI.1124-19.2019. Epub 2019 Nov 14.

Excitatory-Inhibitory Synaptic Coupling in Avian Nucleus Magnocellularis

Affiliations

Excitatory-Inhibitory Synaptic Coupling in Avian Nucleus Magnocellularis

Mohammed Al-Yaari et al. J Neurosci. .

Abstract

The activity of neurons is determined by the balance between their excitatory and inhibitory synaptic inputs. Neurons in the avian nucleus magnocellularis (NM) integrate monosynaptic excitatory and polysynaptic inhibitory inputs from the auditory nerve, and transmit phase-locked output to higher auditory centers. The excitatory input is graded tonotopically, such that neurons tuned to higher frequency receive fewer, but larger, axon terminals. However, it remains unknown how the balance between excitatory and inhibitory inputs is determined in NM. We here examined synaptic and spike responses of NM neurons during stimulation of the auditory nerve in thick brain slices of chicken of both sexes, and found that the excitatory-inhibitory balance varied according to tonotopic region, ensuring reliable spike output across frequencies. Auditory nerve stimulation elicited IPSCs in NM neurons regardless of tonotopic region, but the dependence of IPSCs on intensity varied in a systematic way. In neurons tuned to low frequency, IPSCs appeared and increased in parallel with EPSCs with elevation of intensity, which expanded dynamic range by preventing saturation of spike generation. On the other hand, in neurons tuned to higher frequency, IPSCs were smaller than EPSCs and had higher thresholds for activation, thus facilitating high-fidelity transmission. Computer simulation confirmed that these differences in inhibitory input were optimally matched to the patterns of excitatory input, and enabled appropriate level of neuronal output for wide intensity and frequency ranges of sound in the auditory system.SIGNIFICANCE STATEMENT Neurons in nucleus magnocellularis encode timing information of sound across wide intensity ranges by integrating excitatory and inhibitory synaptic inputs from the auditory nerve, but underlying synaptic mechanisms of this integration are not fully understood. We here show that the excitatory-inhibitory relationship was expressed differentially at each tonotopic region; the relationship was linear in neurons tuned to low-frequency, expanding dynamic range by preventing saturation of spike generation; by contrast inhibitory input remained much smaller than excitatory input in neurons tuned to higher frequency, thus ensuring high-fidelity transmission. The tonotopic regulation of excitatory and inhibitory input optimized the output across frequencies and intensities, playing a fundamental role in the timing coding pathway in the auditory system.

Keywords: GABA; auditory; brainstem; cochlear nucleus; inhibition; tonotopy.


Figures

Figure 1.
Figure 1.
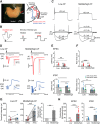
Monosynaptic EPSCs and polysynaptic IPSCs driven by ANFs. A, Thick-slice preparation of chicken brainstem (left), and excitatory and inhibitory pathways from ANFs to NM (right). The excitatory pathway is monosynaptic, whereas the inhibitory pathway is trisynaptic and mediated via NA and SON. A bipolar stimulating electrode was inserted into the auditory nerve at a position >4–5 mm away from the lateral edge of NM (red arrow; see Materials and Methods), while postsynaptic responses were recorded from NM neurons (white arrow). B, Biphasic electrical pulses were used to stimulate ANFs (left; see Materials and Methods). The stimulus intensity was adjusted by changing the duration of the pulse (red bar), where the intensity was weakened by decreasing the duration or strengthened by increasing the duration, whereas the amplitude was kept constant (right). C, Voltage responses of NM neurons in thick slices. Current pulses (80 ms) were applied to the soma between −0.2 and 0.8 nA. Both low-CF (left) and middle/high-CF (right) neurons generated only one or a few spikes at the onset of current injection, but low-CF neurons required less current for spike generation than middle/high-CF neurons (0.1 vs 0.7 nA, threshold current; Table 1), consistent with previous observations in thin slices (Fukui and Ohmori, 2004). D, EPSCs (top, red) and IPSCs (bottom, blue) in low-CF (left) and middle/high-CF (right) neurons. Currents were recorded in a neuron by switching holding potential between −50 and 0 mV, and ensemble-averaged from 5 to 7 traces. Inset showed traces in a longer time scale, and stimulus intensity was indicated at left. EPSCs were sometimes contaminated at 0 mV as a small inward current before IPSCs in middle/high-CF neurons (black arrowhead, bottom right), presumably due to their huge conductance and a slight shift of holding potential by the series resistance (see Materials and Methods). E, F, Latency (E) and rise time (F) of EPSCs (top, red dots) and IPSCs (bottom, blue dots). Monosynaptic IPSCs induced by stimulating SON fibers were also plotted (bottom, green dots). The latency of ANF-driven IPSCs was always longer than 3 ms (broken lines), whereas that of EPSCs and SON-driven IPSCs was <3 ms. G, Threshold intensity to induce synaptic currents. Threshold intensity was similar between EPSCs and IPSCs in low-CF neurons (left), whereas it was ∼four times higher for IPSCs in middle/high-CF neurons (middle), making the ratio between IPSCs and EPSCs larger in those neurons (right). H, Conductances at threshold intensity for EPSCs (left) and IPSCs (right). Numbers in parenthesis are the number of cells. *p < 0.05, **p < 0.01, ***p < 0.001.
Figure 2.
Figure 2.
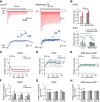
Temporal summation of polysynaptic IPSCs. A, EPSCs and IPSCs during a train of stimuli (20 pulses, 200 Hz). Currents were ensemble-averaged from 5 to 7 traces. IPSCs at the initial two stimuli are expanded in the box, and arrows indicate the peak at each stimulus. Both currents showed strong synaptic depression, although IPSCs, which have slow decay kinetics, temporally summated leading to a plateau current. B, PPR of EPSCs (top, red dots) and IPSCs (bottom, blue dots) from the second and the first responses in the train. PPR of monosynaptic IPSCs driven by SON fibers is also shown (green dots). CE, Synaptic conductance relative to the first stimulus for EPSCs (C), IPSCs (D), and SON-driven IPSCs (E). Relative conductance reached a steady level at the later part of the train, and the level was <1 for EPSCs, whereas it was similar to or >1 for both polysynaptic and monosynaptic IPSCs. FH, Relative conductance at the 18th-20th stimuli during trains at 100, 200, and 333 Hz for EPSCs (F), IPSCs (G), and SON-driven IPSCs (H). Values were averages of the 18–20th stimuli from 5 to 7 traces. Numbers in parenthesis are the number of cells. *p < 0.05, **p < 0.01, ***p < 0.001.
Figure 3.
Figure 3.
Polysynaptic IPSCs increased in parallel with EPSCs in low-CF neurons. A, EPSCs and IPSCs during a train of stimuli (20 pulses, 200 Hz) of different intensities. The intensities were altered by changing the duration of pulses (in microseconds; left of each trace), whereas the amplitude of pulses was kept constant. Low-CF (left) and middle/high-CF (right) neurons. Currents were ensemble-averaged from 5 to 7 traces. Note that EPSCs and IPSCs appeared at a similar intensity and both increased gradually with intensity in the low-CF neuron, whereas IPSCs showed higher threshold and were far smaller than EPSCs even with an intense stimulus (520 μs) in the middle/high-CF neuron. B, Relationship between synaptic conductance and intensity for EPSCs (red) and IPSCs (blue) at the first (left) and the 18th-20th (right) stimuli. Symbols connected by lines represent the same cells. Synaptic conductance was larger for EPSCs than for IPSCs at the first stimulus in both low-CF and middle/high-CF neurons, whereas it was almost overlapping at the 18–20th stimuli in low-CF neurons. C, Relationship between excitatory (EPSG) and inhibitory (IPSG) synaptic conductances from B. Both conductances were strongly correlated in low-CF neurons particularly at the 18–20th stimuli, whereas they were not correlated in middle/high-CF neurons. Different colors represent individual cells, and gray symbols in low-CF groups indicate cells in which conductances were measured at a single intensity. Black symbols in middle/high-CF groups correspond to cells in which IPSCs were not induced even with the maximum stimulus (600 μs, 100 V). The absence of IPSCs likely does not result from a generalized deterioration of the inhibitory pathway because IPSCs were still elicited with a weaker stimulus (143 + 32 μs, n = 4) in low-CF neurons in the same preparation. Numbers in parenthesis are the number of cells.
Figure 4.
Figure 4.
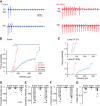
Spike output increased with ANF stimulus intensity in low-CF neurons. A, Spike output in response to a train of stimuli (20 pulses, 200 Hz) of different intensities recorded under cell-attached condition. Low-CF (left) and middle/high-CF (right) neurons. Five traces were superimposed and spikes at corresponding stimuli were expanded (box). The number of spikes increased with intensity toward the later part in low-CF neurons, whereas the number reached the maximum even at the minimum intensity (20 μs) in middle/high-CF neuron. Spike jitter became larger toward the later part and decreased with intensity in low-CF neurons. B, firing probability was plotted against intensity. Symbols connected by lines represent the same cells. Firing probability was calculated from 10 to 13 traces at each intensity. CF, Threshold intensity (C), saturating intensity (D), dynamic range (E), and spike jitter (F). Spike jitter was calculated at saturating intensity from all the spikes during the train. All the parameters were larger in low-CF neurons than in middle/high-CF neurons. Numbers in parenthesis are the number of cells. *p < 0.05, ***p < 0.001.
Figure 5.
Figure 5.
Polysynaptic IPSCs expanded the dynamic range of output in low-CF neurons. A, Spike output in response to a train of stimuli (20 pulses, 200 Hz) in a low-CF neuron before (left, blue, control) and after (right, red) application of SR-95331 (100 μm, GABAA receptor blocker). SR-95331 increased the number of spikes at each intensity. B, Firing probability in A was plotted against intensity. SR-95331 decreased threshold (single arrowheads) and saturating (double arrowheads) intensities, thereby narrowing dynamic range (horizontal two-way arrows). C, Firing probability was plotted against intensity separately for early (first-third, top) and later (4–20th, bottom) parts. DG, Differences between control and SR-95331 for threshold intensity (D), saturating intensity (E), dynamic range (F), and spike jitter (G). Differences were calculated for the entire train, for early in the train, and for later in the train. The effects of SR-95331 were predominant at the later part, reflecting the summating natures of polysynaptic IPSCs. The result also indicated that contributions of ambient GABA to the spike suppression would be small. *p < 0.05, **p < 0.01, ***p < 0.001 between control and SR-95331.
Figure 6.
Figure 6.
Linear excitatory–inhibitory relationship expanded dynamic range when uEPSCs were small. A, Effects of linearly coupled IPSCs on spike generation in a model of low-CF NM neurons. The model received multiple uEPSGs, and voltage responses to 4 (top), 6 (middle), and 8 (bottom) uEPSGs were shown. Five traces were superimposed. Each uEPSGs were randomly varied in the timing with a SD of 0.24 ms. uIPSG was a tonic conductance, and the size and the number changed linearly with those of uEPSGs. Spike generation was saturated at 6 uEPSGs (4 nS) without IPSG (left), at 8 uEPSGs (4nS) with IPSG (middle), and at 4 uEPSG (12 nS) with IPSG (right). Note that resting membrane potential was depolarized particularly when IPSG was large. Broken lines indicate −70 mV. B, Synaptic potentials under gNa of 0 pS/μm2. Three traces were superimposed for 4, 6, and 8 uEPSGs. Synaptic potential was subthreshold at 6 uEPSCs (4 nS) with IPSG (middle), whereas it exceeded spike threshold (dotted line) even at 4 uEPSG for 12 nS (right). C, Firing probability as a function of the number of uEPSG at 4 nS. Single arrowheads indicate the number of uEPSGs just below the appearance of spikes (threshold), and double arrowheads the number for the maximum probability (saturation). IPSG caused a rightward shift of the curve with little effects on threshold, expanding the dynamic range of responses (horizontal two-way arrows). D, Firing probability was plotted against the number of uEPSG for three different uEPSG. The size and the number of uIPSGs were the same as those of uEPSGs. An increase of uEPSG caused a leftward shift of the curve, and narrowed the dynamic range of responses, indicating that the small size of uEPSG is required for the suppressive effect of linearly coupled IPSCs.
Figure 7.
Figure 7.
Roles of sound-frequency-specific excitatory–inhibitory coupling in NM. A, C, Schematic drawing of the input-output relationship of low-CF (A) and middle/high-CF (C) neurons during sound stimuli. Seven and one ANFs were assumed to innervate low-CF and middle/high-CF neurons, respectively, whereas one and two spikes were generated in each fiber for weak (left) and intense (right) sounds, respectively (top). In low-CF neurons, unitary excitatory (EPSG) and inhibitory (IPSG) conductances are small and increase in parallel with elevation of intensity (middle). Accordingly, the number of EPSPs exceeding spike threshold (broken lines and asterisks) decreases in the presence (blue) compared with the absence of the IPSG (red, bottom); the number of cycles exceeding threshold was 1, with or without IPSGs at weak sound, whereas it was 3 without the IPSG and 2 for with the IPSG, at intense sound. In middle/high-CF neurons, on the other hand, the unitary EPSG is large enough to generate spikes, whereas the IPSG is far smaller and appears at a higher intensity than the EPSG. Accordingly, the IPSG would have a smaller impact on the number of EPSPs exceeding spike threshold. Thus, spike output would reflect the number of cycles with EPSPs rather than the size of EPSPs at each cycle in middle/high-CF neurons (see Discussion); the number of cycles exceeding threshold was 1 and 2 at weak and intense sounds, respectively, with or without the IPSG. B, D, Relationships of synaptic conductance (top) and spike output of NM neurons (bottom) with sound intensity. Low-CF (B) and middle/high-CF (D) neurons. In low-CF neurons, EPSG (red) and IPSG (blue) increase in parallel (top), and hence spike output should be suppressed with IPSG (blue) compared with without IPSG (red, bottom). In middle/high-CF neurons, on the other hand, IPSG would appear at a higher intensity (blue, top), and hence effects of IPSG on spike output would be minimal (blue, bottom). Spike generation could be attenuated with IPSG at an extremely intense sound, as observed in NM neurons in vivo (Fukui et al., 2010).

References

    1. Ahn J, MacLeod KM (2016) Target-specific regulation of presynaptic release properties at auditory nerve terminals in the avian cochlear nucleus. J Neurophysiol 115:1679–1690. 10.1152/jn.00752.2015 - DOI - PMC - PubMed
    1. Akter N, Adachi R, Kato A, Fukaya R, Kuba H (2018) Auditory input shapes tonotopic differentiation of Kv1.1 expression in avian cochlear nucleus during late development. J Neurosci 38:2967–2980. 10.1523/JNEUROSCI.2472-17.2018 - DOI - PMC - PubMed
    1. Brenowitz S, Trussell LO (2001) Maturation of synaptic transmission at end-bulb synapses of the cochlear nucleus. J Neurosci 21:1857–1867. 10.1523/JNEUROSCI.21-06-01857.2001 - DOI - PMC - PubMed
    1. Brenowitz S, David J, Trussell L (1998) Enhancement of synaptic efficacy by presynaptic GABAB receptors. Neuron 20:135–141. 10.1016/S0896-6273(00)80441-9 - DOI - PubMed
    1. Burger RM, Cramer KS, Pfeiffer JD, Rubel EW (2005) Avian superior olivary nucleus provides divergent inhibitory input to parallel auditory pathways. J Comp Neurol 481:6–18. 10.1002/cne.20334 - DOI - PubMed

Publication types

Substances

LinkOut - more resources