. 2019 Nov 15;366(6467):886-890.
doi: 10.1126/science.aay2832.

The role of multiple global change factors in driving soil functions and microbial biodiversity

Affiliations

The role of multiple global change factors in driving soil functions and microbial biodiversity

Matthias C Rillig et al. Science. .

Abstract

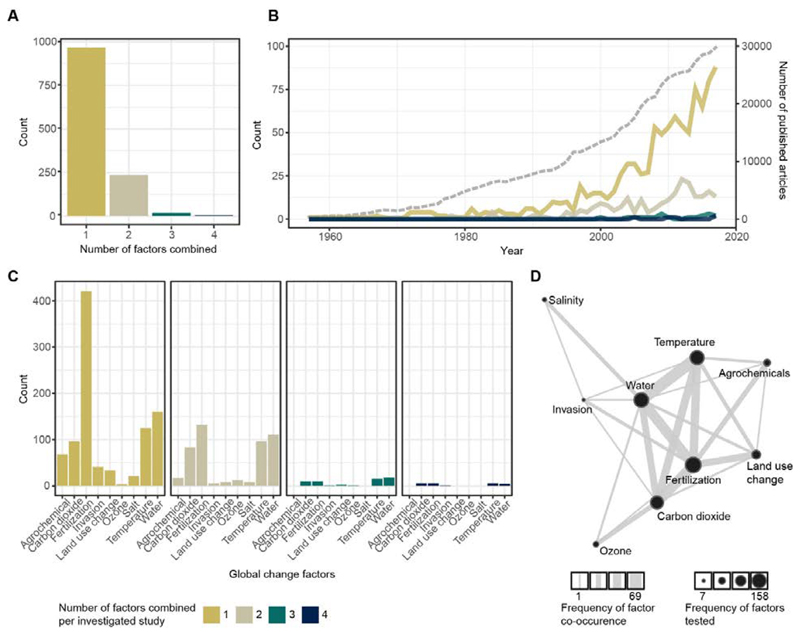
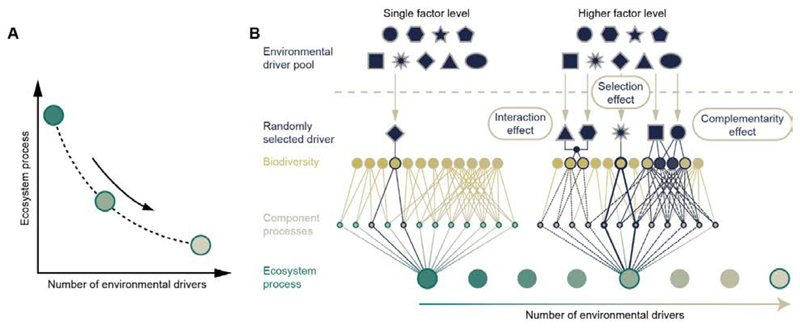
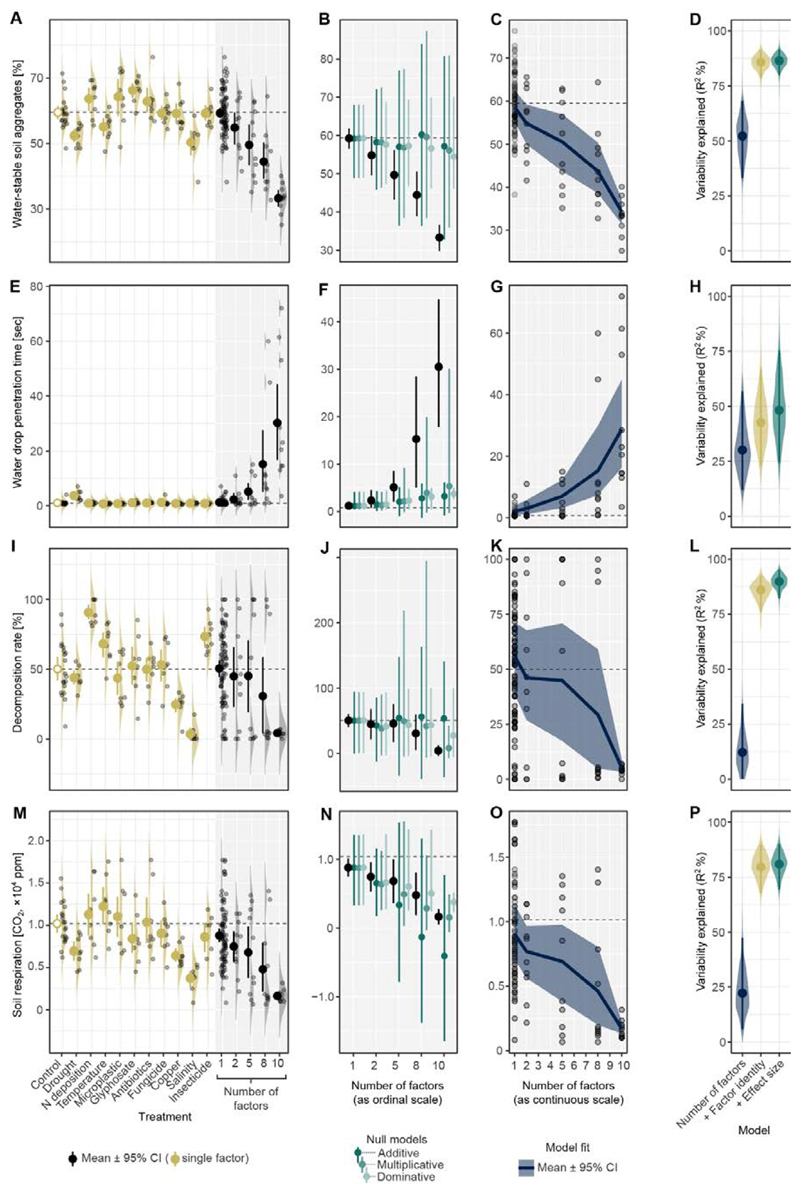
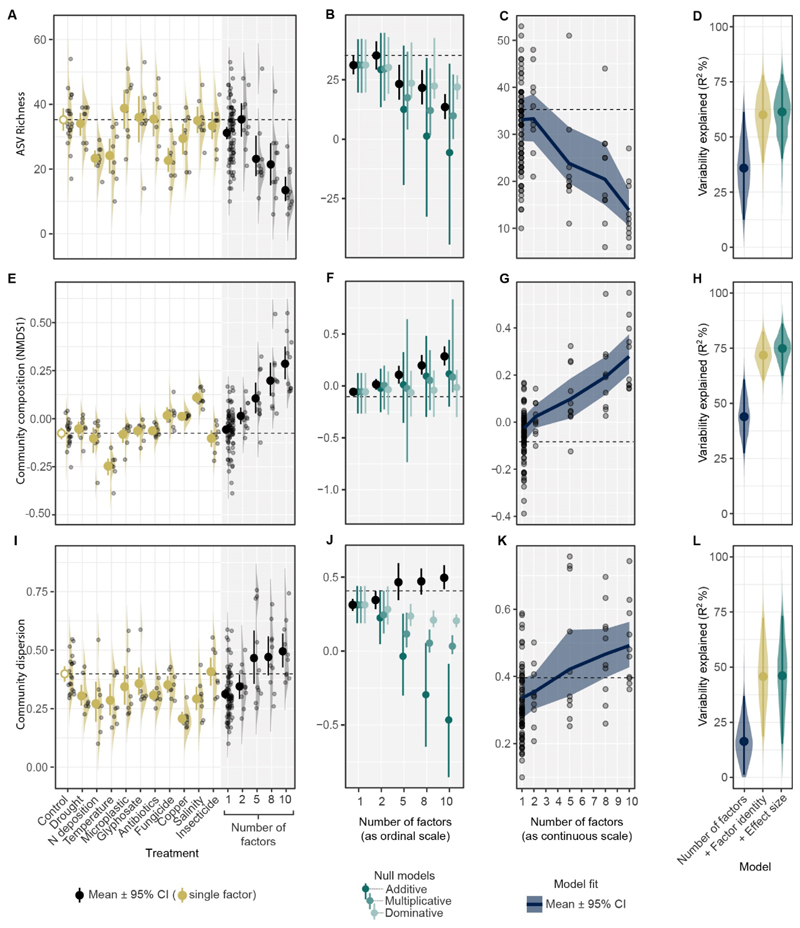
Soils underpin terrestrial ecosystem functions, but they face numerous anthropogenic pressures. Despite their crucial ecological role, we know little about how soils react to more than two environmental factors at a time. Here, we show experimentally that increasing the number of simultaneous global change factors (up to 10) caused increasing directional changes in soil properties, soil processes, and microbial communities, though there was greater uncertainty in predicting the magnitude of change. Our study provides a blueprint for addressing multifactor change with an efficient, broadly applicable experimental design for studying the impacts of global environmental change.


Conflict of interest statement

Competing interests: The authors confirm that there are no competing interests.

Figures

Fig. 1
Fig. 1. Results from a literature survey on the number of global change factors included in soil ecology experiments, covering the years 1957 to 2017.
A. Frequency distribution of the number of factors of global change included in experimental studies. For the 19 studies testing 3-way interactions, we counted overall 38 investigated responses (across studies and variables), and in 21.05% of these authors reported a significant interaction. We found 5 studies including 4-way interactions, and in none of these was the 4-way interaction term significant. B. Number of experimental studies including a given number of factors over the last 50 years. For comparison, the dashed grey line (right y-axis) represents the number of published articles per year for the Web of Knowledge category “Ecology”. C. Number of papers including a given global change factor, for studies with 1-4 combined factors. D. Network graph depicting co-occurrence of global change factors in experimental studies, where circle size represents the frequency with which the driver was included in the studies and line thickness represents the frequency with which the drivers were tested as combinations.
Fig. 2
Fig. 2. Diagrams expressing the idea that the number of global change factors alone might predict general trends in changes of biodiversity and ecosystem processes.
A. We hypothesize that biodiversity and ecosystem processes display a consistent directional change (this could be either an increase or decline, concave or convex; in the panel we only show a decline and only one possible curve shape) along the number of environmental factors. B. The rationale behind this prediction is that with an increasing number of factors there is an increased chance of including an influential factor (selection effect), that factors may increasingly affect different components (complementarity effect), and that factors may interact with each other, so strengthening their effect (factor interaction effect).
Fig. 3
Fig. 3. Effects on soil properties of global change factors applied singly and using different numbers of factors (2, 5, 8, 10 factors).
For each measured soil property (each row), single factor effects were estimated (1st column) and then used to predict multi-factor effects based on three different assumptions on how to combine multiple effect sizes (2nd column). An ideal prediction should have a small bias (accuracy) and narrow confidence interval (precision), but for the 1st and 2nd rows, predictions were neither accurate nor precise, regardless of the assumption used. The predictions are made difficult because the single factor effects have large variability and/or because there are strong factor interactions. The direction of the treatment effects were consistent with an increasing number of factors for all properties (3rd column). These curves were estimated using a random forest machine learning, and their predictability is shown in the 4th column (dark blue). Predictability was improved by adding factor identity information (0/1 for each factor; dark yellow) or effect size information (predicted values based on three assumptions; dark green) to the models as predictors (4th column), but predictability did not always improve (see H). Water stable soil aggregates (A-D); soil water repellency measured as water drop penetration time (E-H); decomposition rate (I-L); and, soil respiration (M-P). Replicates are represented by dots with density ridgeline plots. Horizontal dashed lines represent mean values of the control.
Fig. 4
Fig. 4. Effects on the soil fungal community of different global change factors applied singly and using different numbers of factors (2, 5, 8, 10 interacting factors).
For each biodiversity property (each row), single factor effects were estimated (1st column) and then used to predict multi-factor effects based on certain assumptions (2nd column). As with soil functions (Fig. 3), the effect directions were consistent along the number of factors for all properties as predicted using random forest machine learning (3rd column). The model predictability is shown in the 4th column (dark blue). Adding factor identity (dark yellow) or single factor effect size information (dark green) to the model improved predictability only for community composition, indicating that factor interactions exist (4th column). Fungal diversity is represented by ASV richness (A-D), community composition (E-H) and community dispersion (I-L). Community composition is represented by the 1st axis of an unconstrained multivariate ordination (NMDS) of the Bray-Curtis sample pairwise dissimilarities.

Comment in

References

    1. Lehmann J, Rillig M. Distinguishing variability from uncertainty. Nature Climate Change. 2014;4:153.
    1. Grimm NB, et al. The changing landscape: ecosystem responses to urbanization and pollution across climatic and societal gradients. Frontiers in Ecology and the Environment. 2008;6:264–272.
    1. Fischer M, et al. Implementing large-scale and long-term functional biodiversity research: The Biodiversity Exploratories. Basic and Applied Ecology. 2010;11:473–485.
    1. Sala OE, et al. Global biodiversity scenarios for the year 2100. Science. 2000;287:1770–1774. - PubMed
    1. Boyd PW, et al. Experimental strategies to assess the biological ramifications of multiple drivers of global ocean change—A review. Global Change Biology. 2018;24:2239–2261. - PubMed

Publication types