. 2019 Nov 29;366(6469):1134-1139.
doi: 10.1126/science.aay0793. Epub 2019 Nov 14.

Brain cell type-specific enhancer-promoter interactome maps and disease - risk association

Affiliations

Brain cell type-specific enhancer-promoter interactome maps and disease - risk association

Alexi Nott et al. Science. .

Abstract

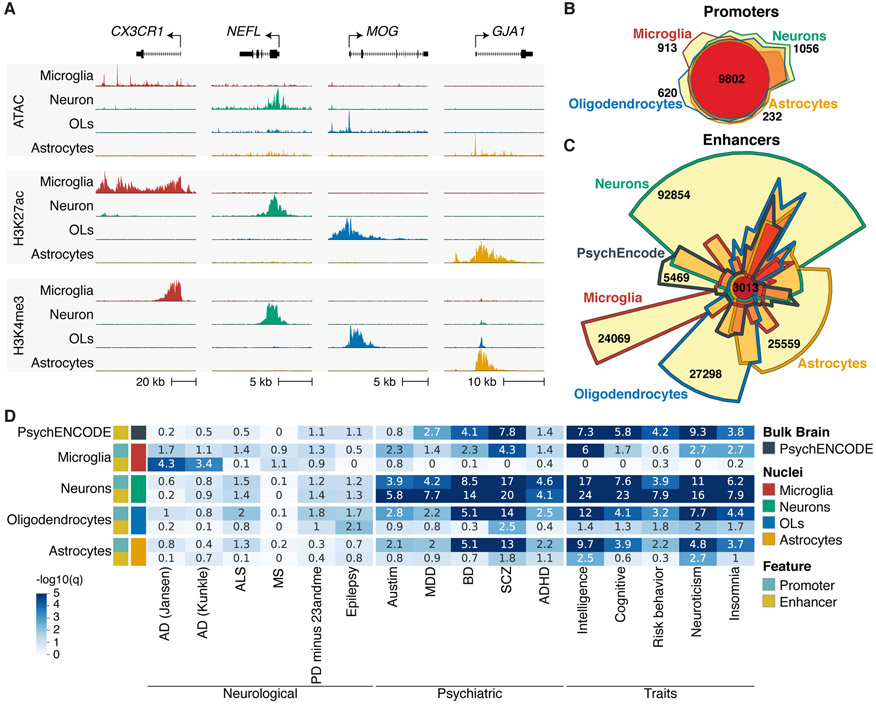
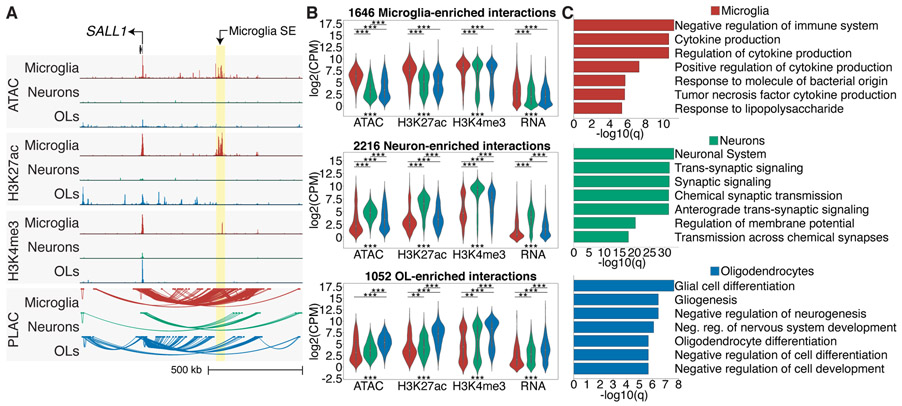
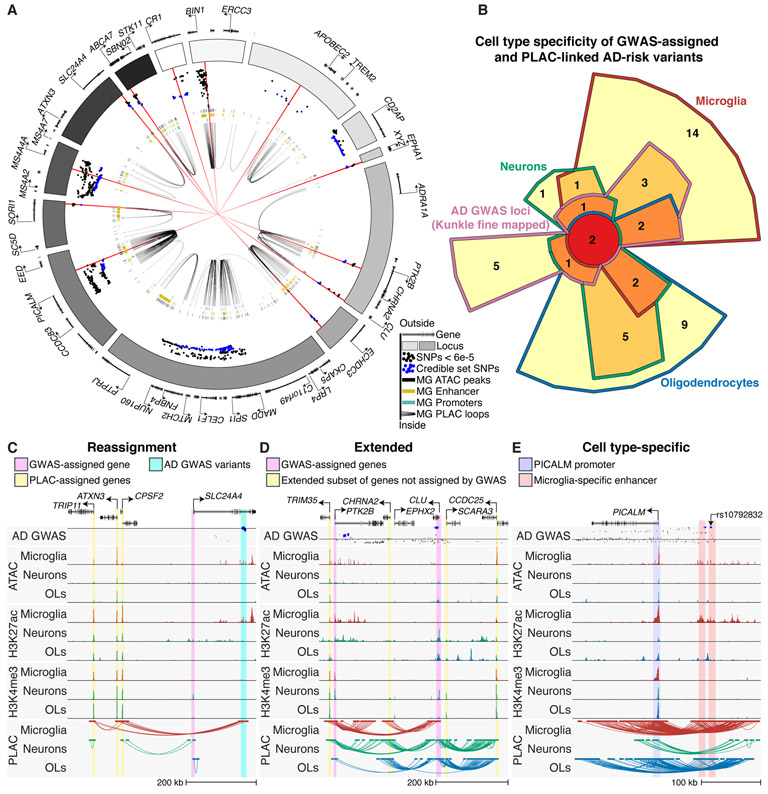
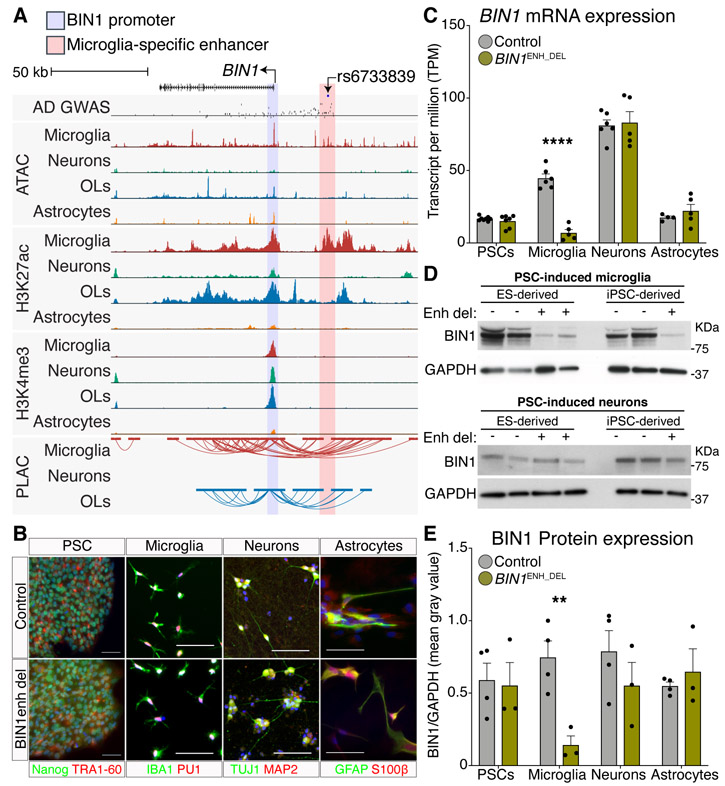
Noncoding genetic variation is a major driver of phenotypic diversity, but functional interpretation is challenging. To better understand common genetic variation associated with brain diseases, we defined noncoding regulatory regions for major cell types of the human brain. Whereas psychiatric disorders were primarily associated with variants in transcriptional enhancers and promoters in neurons, sporadic Alzheimer's disease (AD) variants were largely confined to microglia enhancers. Interactome maps connecting disease-risk variants in cell-type-specific enhancers to promoters revealed an extended microglia gene network in AD. Deletion of a microglia-specific enhancer harboring AD-risk variants ablated BIN1 expression in microglia, but not in neurons or astrocytes. These findings revise and expand the list of genes likely to be influenced by noncoding variants in AD and suggest the probable cell types in which they function.


Figures

Fig. 1
Fig. 1
Cell type-specific genomic regulatory region enrichments for GWAS-risk variants for brain disorders and behavioral traits. (A) UCSC browser of ATAC-seq (top panel), H3K4me3 (middle panel) and H3K27ac ChIP-seq (bottom panel) for brain nuclei populations. Shown is a representative gene for microglia (CX3CR1), neurons (NEFL), oligodendrocytes (MOG) and astrocytes (GJA1). (B) Chow-Ruskey plot of promoter regions defined for cell populations. (C) Chow-Ruskey plot of enhancer regions defined for cell populations and PsychENCODE enhancers defined using bulk brain. (D) Heatmap of LDSC analysis for genetic variants associated with brain disorders and behavior traits displayed as −log10(q) value for significance of enrichment for promoter and enhancer regions of cell populations and PsychENCODE bulk brain enhancers. OL, oligodendrocytes.
Fig. 2
Fig. 2
Chromatin loops link promoters to active gene regulatory regions. (A) UCSC browser of ATAC-seq, and H3K27ac and H3K4me3 ChIP-seq, and PLAC-seq loops at the SALL1 locus. The microglia-specific super-enhancer is associated with microglia interactions (highlighted yellow). (B) Violin plots of ATAC-seq, H3K27ac, H3K4me3 ChIP-seq and RNA-seq log2(CPM) values at PLAC-seq upregulated interactions shown in fig. S7B for microglia, neurons and oligodendrocytes; *** = P < 1e-12; ** = P < 1e-5; * = P < 1e-3. Kruskal-Wallis-between group test. (C) Metascape enrichment analyses of active genes identified at PLAC-seq upregulated interactions shown in fig. S6D for microglia, neurons and oligodendrocytes shown as −log10(q) values.
Fig. 3
Fig. 3
Expanded gene network of AD-risk loci. (A) Circos plot of AD GWAS loci, showing microglia enhancers (gold bars), promoters (turquoise), open chromatin regions (black bars) and PLAC-seq interactions (black loops). Dots show z-score values of high-confidence AD variants identified by fine mapping (Kunkle, stage 1) with log10 p-value < 6e-5 (18). Blue dots represent z-score values of the credible set of AD SNPs (95% confidence); red lines show 15 high-confidence AD SNPs with a posterior probability > 0.2. (B) Chow-Ruskey plot of genes that are GWAS-assigned and PLAC-seq linked to AD-risk credible set variants in microglia, neurons and oligodendrocytes. (C)-(E) UCSC browser of interactions at AD-risk loci demonstrating (C) reassignment of GWAS-assigned genes, (D) extension of GWAS-assigned genes and (E) cell type-specific gene regulatory regions. The AD GWAS track shows meta-analysis p-values of stage 2 variants (18); line indicates p-value = 5e-8; blue dots are fine mapped 95% credible set variants.
Fig. 4
Fig. 4
Deletion of a microglia-specific enhancer harboring a lead AD-risk variant affects microglia BIN1 expression. (A) UCSC browser of the BIN1 locus showing AD-risk variants, ATAC-seq, H3K27ac, H3K4me3 ChIP-seq and PLAC-seq in brain cell types. Shared active promoter region, highlighted pink; microglia-specific enhancer region, highlighted in yellow. The AD GWAS track shows meta-analysis p-values of stage 2 variants (18); line indicates p-value = 5e-8; blue dots are fine mapped 95% credible set variants. (B) Immunohistochemistry of PSCs, microglia, neurons and astrocytes in control and BIN1enh_del lines stained for the indicated cell lineage markers. (C) BIN1 gene expression in control and BIN1enh_del PSCs (N = 8,7), microglia (N = 6,5), neurons (N = 6,5) and astrocytes (N = 4,5) as RNA-seq TPM. **** Benjamini and Hochberg adjusted p-value < 0.0001. (D) Western blot of BIN1 and GAPDH in control and BIN1enh_del PSC-derived microglia (top) and neurons (bottom). (E) Protein expression of BIN1 in control and BIN1enh_del PSCs, microglia, neurons and astrocytes determined as Western blot BIN1/GAPDH mean gray intensity. N = 4 controls, 3 BIN1enh_del per cell type. ** unpaired two-tailed t-test p-value < 0.01.

Comment in

References

    1. Lake BB et al., Neuronal subtypes and diversity revealed by single-nucleus RNA sequencing of the human brain. Science (New York, NY) 352, 1586–1590 (2016). - PMC - PubMed
    1. Lake BB et al., Integrative single-cell analysis of transcriptional and epigenetic states in the human adult brain. Nature Biotechnology 36, 70–80 (2018). - PMC - PubMed
    1. Mathys H et al., Single-cell transcriptomic analysis of Alzheimer's disease. Nature 570, 332–337 (2019). - PMC - PubMed
    1. Gallagher MD, Chen-Plotkin AS, The Post-GWAS Era: From Association to Function. Am J Hum Genet 102, 717–730 (2018). - PMC - PubMed
    1. Maurano MT et al., Systematic localization of common disease-associated variation in regulatory DNA. Science 337, 1190–1195 (2012). - PMC - PubMed

Publication types

MeSH terms