Comparative Study
. 2019 Nov 14;9(1):16801.
doi: 10.1038/s41598-019-53041-4.

Fecal microbiome signatures of pancreatic cancer patients

Affiliations
Comparative Study

Fecal microbiome signatures of pancreatic cancer patients

Elizabeth Half et al. Sci Rep. .

Abstract

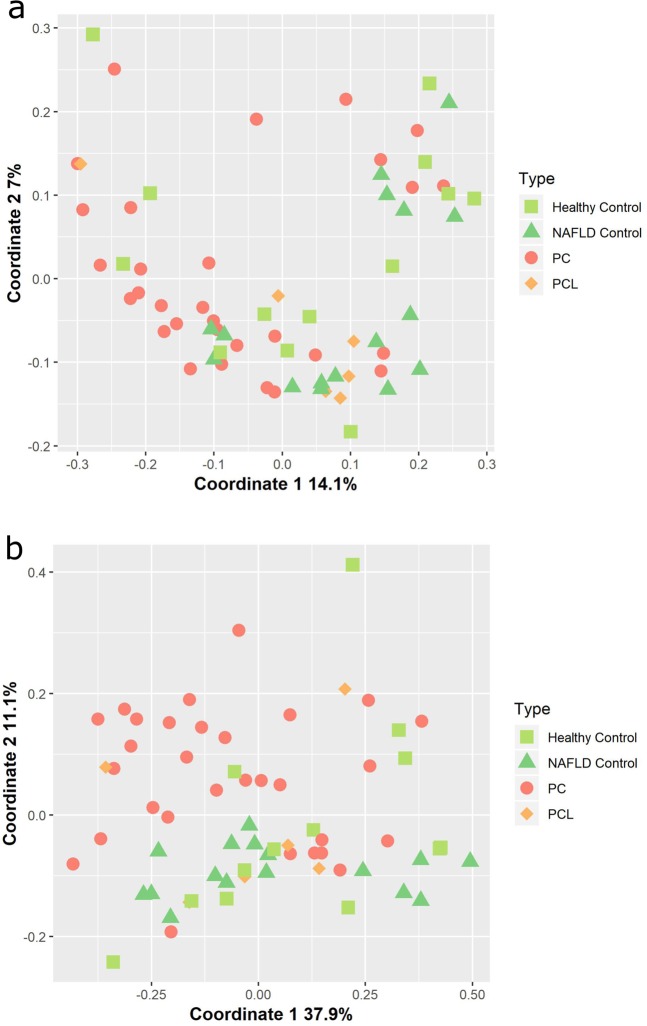
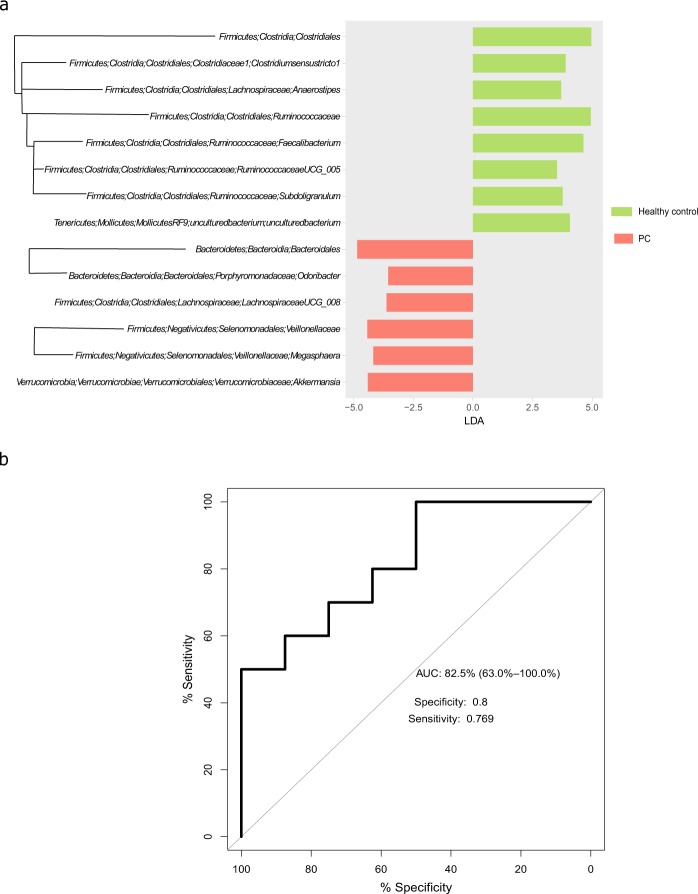
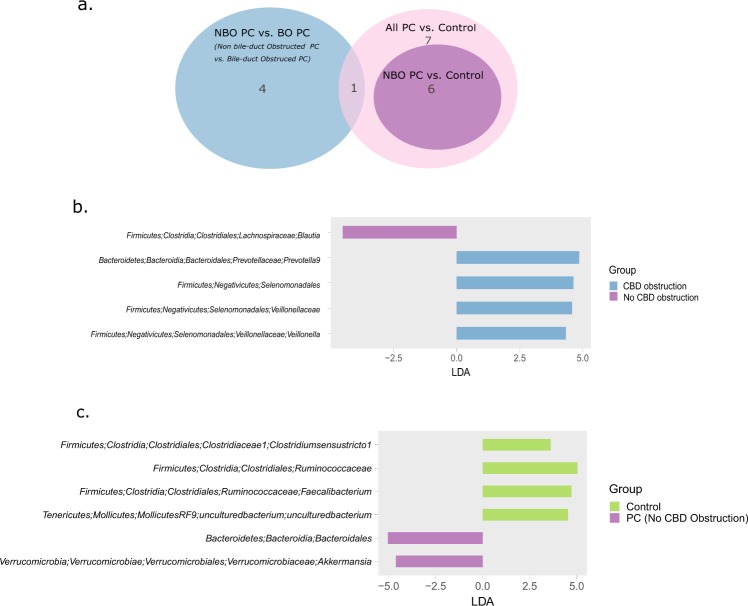
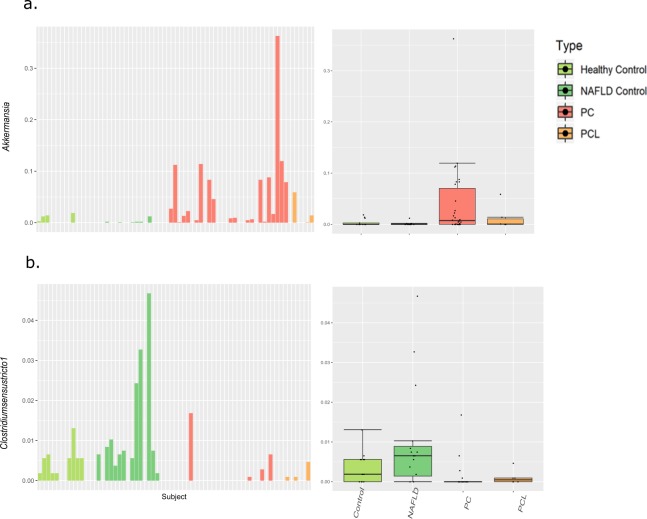
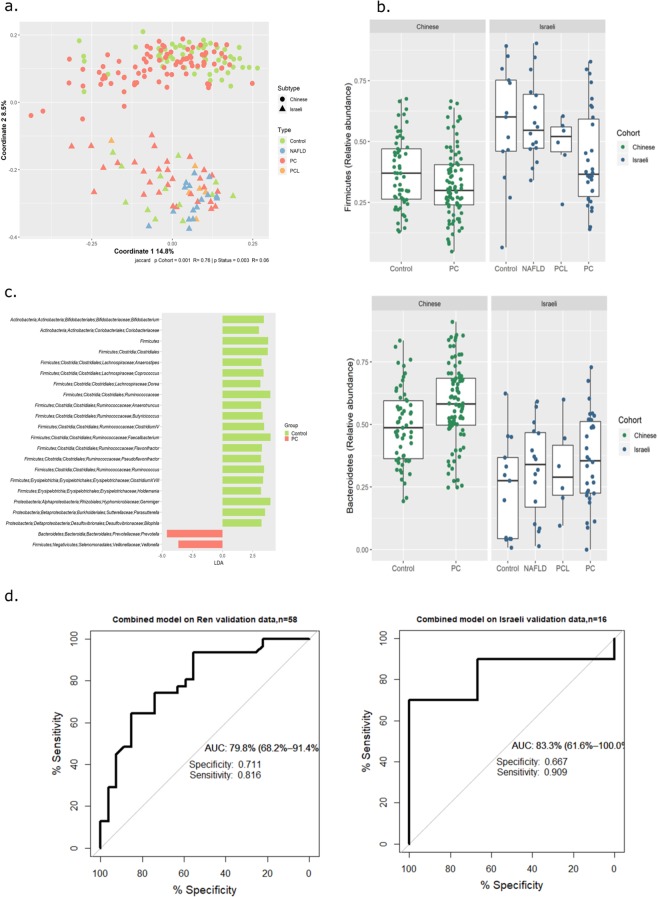
Pancreatic cancer (PC) is a leading cause of cancer-related death in developed countries, and since most patients have incurable disease at the time of diagnosis, developing a screening method for early detection is of high priority. Due to its metabolic importance, alterations in pancreatic functions may affect the composition of the gut microbiota, potentially yielding biomarkers for PC. However, the usefulness of these biomarkers may be limited if they are specific for advanced stages of disease, which may involve comorbidities such as biliary obstruction or diabetes. In this study we analyzed the fecal microbiota of 30 patients with pancreatic adenocarcinoma, 6 patients with pre-cancerous lesions, 13 healthy subjects and 16 with non-alcoholic fatty liver disease, using amplicon sequencing of the bacterial 16S rRNA gene. Fourteen bacterial features discriminated between PC and controls, and several were shared with findings from a recent Chinese cohort. A Random Forest model based on the microbiota classified PC and control samples with an AUC of 82.5%. However, inter-subject variability was high, and only a small part of the PC-associated microbial signals were also observed in patients with pre-cancerous pancreatic lesions, implying that microbiome-based early detection of such lesions will be challenging.


Conflict of interest statement

The authors declare no competing interests.

Figures

Figure 1
Figure 1
Similarity in microbial composition across different sample types. Principal Coordinate Analysis (PCoA) was used to visualize spatial relationships among samples according to (a) abundance-weighted UniFrac and (b) unweighted UniFrac distance matrices.
Figure 2
Figure 2
Microbial features characterizing PC. (a) Bacterial taxa identified by LEfSe as differentiating between PC patients (red) and healthy control subjects (green). Phylogenetically related bacterial taxa are denoted by connecting branches. (b) ROC curve of a random forest model, trained on the features identified in (a).
Figure 3
Figure 3
A different set of biomarker taxa is associated with PC and bile-duct obstruction. (a) Venn diagram showing the number of taxa shared between the three marker taxa sets identified in LEfSe comparisons. NBO PC: Non-Bile duct-Obstructed PC; BO PC: Bile duct-obstructed PC. (b) Taxa identified by LEfSe as differentiating between BO PC and NBO PC patients. (c) Taxa identified by LEfSe as differentiating between healthy controls and “pure”, NBO PC patients.
Figure 4
Figure 4
In-depth exploration of two representative PC discriminating taxa. A boxplot, portraying summary statistics across the different groups, and a corresponding barplot, portraying the relative abundance in each individual, are shown for the PC-associated Akkermansia (a), and the control-associated Clostridium sensu stricto 1. (b) In the boxplots, lines indicate median relative abundances, boxes denote 3rd and 1st quantile, whiskers denote ± 1.5*IQR, and outliers are shown as dots.
Figure 5
Figure 5
Both origin and disease effects are evident in an integrative analysis of two cohorts. Data from a Chinese cohort was integrated with our own to form a merged dataset for analysis. (a) PCoA of Jaccard distance matrix. (b) Boxplots of key phyla across cohort and type. (c) LEfSe analysis identifies disease discriminating taxa in the integrated dataset. (d) ROC of a random forest model built on the features identified in (c). In the boxplots, lines indicate median relative abundances, boxes denote 3rd and 1st quantile, whiskers denote ± 1.5*IQR, and outliers are shown as dots.

References

    1. Siegel RL, Miller KD, Jemal A. Cancer statistics, 2018. CA. Cancer J. Clin. 2018;68:7–30. doi: 10.3322/caac.21442. - DOI - PubMed
    1. Ferlay J, et al. Cancer incidence and mortality patterns in Europe: estimates for 40 countries in 2012. Eur. J. Cancer. 2013;49:1374–403. doi: 10.1016/j.ejca.2012.12.027. - DOI - PubMed
    1. Sakorafas GH, Tsiotos GG, Korkolis D, Smyrniotis V. Individuals at high-risk for pancreatic cancer development: management options and the role of surgery. Surg. Oncol. 2012;21:e49–58. doi: 10.1016/j.suronc.2011.12.006. - DOI - PubMed
    1. Haeno H, et al. Computational modeling of pancreatic cancer reveals kinetics of metastasis suggesting optimum treatment strategies. Cell. 2012;148:362–75. doi: 10.1016/j.cell.2011.11.060. - DOI - PMC - PubMed
    1. Yachida S, et al. Distant metastasis occurs late during the genetic evolution of pancreatic cancer. Nature. 2010;467:1114–7. doi: 10.1038/nature09515. - DOI - PMC - PubMed

Publication types

Substances