. 2019 Nov 14;10(1):5157.
doi: 10.1038/s41467-019-12477-y.

Destabilization of NOXA mRNA as a common resistance mechanism to targeted therapies

Affiliations

Destabilization of NOXA mRNA as a common resistance mechanism to targeted therapies

Joan Montero et al. Nat Commun. .

Abstract

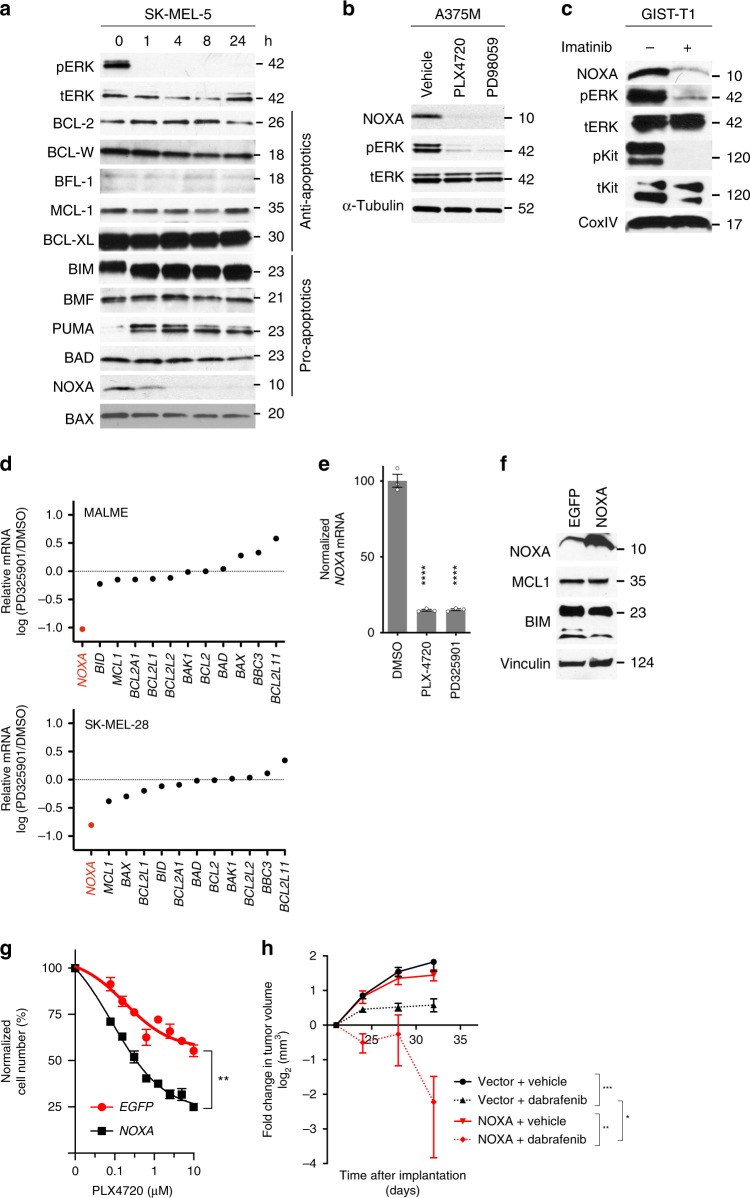
Most targeted cancer therapies fail to achieve complete tumor regressions or attain durable remissions. To understand why these treatments fail to induce robust cytotoxic responses despite appropriately targeting oncogenic drivers, here we systematically interrogated the dependence of cancer cells on the BCL-2 family of apoptotic proteins after drug treatment. We observe that multiple targeted therapies, including BRAF or EGFR inhibitors, rapidly deplete the pro-apoptotic factor NOXA, thus creating a dependence on the anti-apoptotic protein MCL-1. This adaptation requires a pathway leading to destabilization of the NOXA mRNA transcript. We find that interruption of this mechanism of anti-apoptotic adaptive resistance dramatically increases cytotoxic responses in cell lines and a murine melanoma model. These results identify NOXA mRNA destabilization/MCL-1 adaptation as a non-genomic mechanism that limits apoptotic responses, suggesting that sequencing of MCL-1 inhibitors with targeted therapies could overcome such widespread and clinically important resistance.


Conflict of interest statement

K.F. is a member of the board of directors at Loxo Oncology, Clovis Oncology, Strata Oncology, Vivid Biosciences; the corporate advisory board of X4 Pharmaceuticals, PIC Therapeutics; the scientific advisory board of Sanofi, Amgen, Asana, Adaptimmune, Fount, Aeglea, Array BioPharma, Shattuck Labs, Arch Oncology, Tolero, Apricity, Oncoceutics, Fog Pharma, Tvardi; and consultant for Novartis, Genentech, Bristol-Myers Squibb, Merck, Takeda, Verastem, Checkmate, Boston Biomedical. F.S.H. is a consultant for Bristol-Myers Squibb, Merck, EMD Serono, Novartis, Celldex, Amgen, Genetech, Incyte, Bayer, Aduro, Partners Therapeutics, Sanofi, Pfizer, Pionyr; member of scientific advisory board of Apricity; member of the advisory board of Pionyr, 7 Hills Pharma, Verastem. R.H. has received research grants from Bristol-Myers-Squibb and Novartis. J.R.C., A.E.T., and J.P.S. are employees of Astra-Zeneca. C.Y. is a consultant to Merck. J.M. is a consultant for Vivid Biosciences and Oncoheroes Biosciences. D.E.F. has a financial interest in Soltego, Inc., a company developing SIK inhibitors for topical skin darkening treatments that might be used for a broad set of human applications. These interests were reviewed and are managed by Massachusetts General Hospital and Partners HealthCare in accordance with their conflict of interest policies. The remaining authors declare no competing interests.

Figures

Fig. 1
Fig. 1
Targeted therapies induce dependence on MCL-1. a Scheme for sensitization siRNA screen to targeted therapies. b Cell number following targeting of the anti-apoptotic BCL-2 family by siRNA and targeted therapies (10 µm), relative to vehicle-treated cells. PLX4720 was used for BRAF-mutant cells, imatinib was used for CKIT-mutant cells, gefitinib was used use for EGFR-mutant cells; crizotinib was used for MET- and ALK-mutant cells and lapatinib was used for ERBB2-amplified cells. Cell number was normalized to cells transfected with control siRNA and treated with drug vehicle. c, d, e Dynamic BH3 profiling (DBP) of cancer cell lines following 36 h treatment with the indicated drug (1 µm). Mitochondrial permeabilization is calculated relative to vehicle-treated cells. Statistical significance (n = 4) determined using the Holm–Sidak method. ***, adjusted P value < 0.001 comparing drug treatment vs vehicle control; **, adjusted P value < 0.01; *, adjusted P value < 0.05; §, adjusted P value < 0.1. Comparisons with adjusted P value ≥ 0.1 are designated without any symbol. f DBP profiles following BRAF (1 µm dabrafenib), MEK (0.1 µm trametinib), and ERK inhibitors (1 µM VX11e and SCH772984) on freshly obtained cells from melanoma patients (n = 1). See also Supplementary Fig. 1 and Supplementary Tables 1 and 2. Source data for siRNA screen are provided as a Source Data file. Error bars indicate mean ± s.e.m. of indicated replicates
Fig. 2
Fig. 2
Targeted therapies suppress NOXA mRNA. a Protein levels of BCL-2-family members following treatment of SK-MEL-5 melanoma cells treated PLX4720 (1 µm). b Effect of BRAF and MEK inhibitors on NOXA protein in A375M melanoma cells. c Effect of imatinib on NOXA in KIT-mutant GIST-T1 cells. d Changes in BCL-2 family mRNA expression following MEK inhibitor treatment as assessed in published microarray analysis (GSE20051). For each gene, the expression is normalized to that of DMSO-treated cells. e Effect of BRAF and MEK inhibitor on NOXA mRNA in A375M cells. Statistical significance of drug versus vehicle-treated cells (n = 3) was determined using Holm–Sidak multiple comparison test. ****, adjusted value < 0.0001. f Western blot of NOXA, BIM, and MCL1 in A375M cells expressing NOXA. g Effect of overexpression of NOXA on number of A375M cells following PLX4720 treatment (n = 3 per group). Statistical significance of growth inhibition was done using extra sum-of-squares F-test. **, adjusted P value < 0.01. h Effect of overexpression of NOXA on the growth of A375M xenografts on response to dabrafenib (n = 10 per group). Tumor size shown is relative to pre-treatment (day 22). Fold change in tumor volume at day 32 was compared using ANOVA with Sidak multiple comparison tests. *, adjusted P value < 0.05; **, adjusted P value < 0.01; ***, adjusted P value, < 0.001. Error bars indicate mean ± s.e.m. of indicated replicates. See also Supplementary Fig. 2. Source data for all Western blots are provided as a Source Data file
Fig. 3
Fig. 3
ERK suppression decreases NOXA expression via TTP/ZFP36. a Quantification of NOXA mRNA following treatment of BRAF-mutant A375M cells with MEK or BRAF inhibitors. b NOXA mRNA upon treatment with actinomycin D with or without BRAF inhibitor treatment (n = 2–3 per group). c Consensus sequence of binding sites for TTP/ZFP36 family proteins depicting the location of putative AU-rich sequences in NOXA mRNA. d Quantification of indicated mRNAs following transfection of A375M cells with siRNAs targeting ZFP36 family (n =  3). Statistical comparison was done using one-way ANOVA with Dunnett’s multiple comparison test. *, adjusted P value < 0.05; **, adjusted P value < 0.01; ***, adjusted P value < 0.001. e Quantification of knockdown of ZFP36 using independent siRNAs. Statistical significance was determined by ANOVA with Dunnett’s multiple comparison test (n = 3). *, adjusted P value < 0.05; **, adjusted P value < 0.01. n = 3. f Effect of suppression of ZFP36/TTP on NOXA mRNA following Actinomycin D treatment (n = 3). Statistical significance was determined using extra sum-of-squares F-test. ***, adjusted P value < 0.001. g Effect of ZFP36 expression on JUN, NOXA, and E2F4 mRNAs in A375M cells (n = 3 per group). Statistical comparison of ZFP36 expressing cells compared to control cells was done using t test. ***, adjusted P value < 0.001; **, adjusted P value < 0.01. h Quantification of NOXA mRNA associated with immunoprecipitated ZFP36. Statistical comparison of ZFP36 expressing cells compared to control cells was done using t test. (n = 3). **, adjusted P value < 0.01; ****, adjusted P value < 0.0001. i The sequence of ZFP36 with putative MAPK phosphorylation sites. j Effect of dabrafenib on wild-type and mutant ZFP36 in A375M cells. Error bars indicate mean ± s.e.m. of indicated replicates. See also Supplementary Fig. 3. Source data for all Western blots are provided as a Source Data file
Fig. 4
Fig. 4
Targeted therapies reconfigure apoptotic signaling and create a schedule-dependent vulnerability. a Effect of PLX4720 (1 µm) on total levels of NOXA and BCL-2 family members in A375M melanoma cells (input for immunoprecipitation). b Association of MCL-1 with NOXA and BIM following PLX4720 treatment. c Association of BIM with MCL-1 following PLX4720 treatment. d Effect of A1210477, dabrafenib or both on MCL-1 and BIM. e Effect of A1210477, dabrafenib or both on the association of protein levels of MCL-1, BIM, and NOXA. f Scheduling of drug treatments in g. g Representative synergy blot of A-121044 followed by dabrafenib, or reverse, in A375M cells. h Effect of dabrafenib followed by AZD5991 on apoptosis in A375M cells. Cells were treated with vehicle (time 0) or dabrafenib (1 µm) for the indicated time, followed by 16 h exposure to AZD5991 (1 µm) or equal volume vehicle. Statistical comparison (n = 4) of different drug schedules was done using two-way ANOVA with Sidak’s multiple comparison test. *, adjusted P value < 0.05; ****, adjusted P value, < 0.0001. i Effect of dabrafenib followed by A1210477 on apoptosis in IPC-298 cells (n = 4). Cells were treated as in h. j Synergy scores of A375M, GIST-T1 or PC9 cells treated with MCL-1 or BCL-2 inhibitors with targeted agents. Statistical comparison was done using one-way ANOVA with Holm–Sidak’s multiple comparison test. ****, adjusted P value < 0.0001; ***, adjusted P value < 0.001; **, adjusted P value < 0.01. Error bars indicate mean ± s.e.m. of indicated replicates. See also Supplementary Fig. 4. Source data for all western blots are provided as a Source Data file
Fig. 5
Fig. 5
Targeting apoptotic adaptation overcomes resistance to targeted therapy in vivo. a Comparison of NOXA and DUSP4 mRNA in paired biopsies obtained from melanoma patients before treatment with vemurafenib (pre-treatment) and 10–15 days later. Statistical comparison was done using ANOVA with Sidak’s multiple comparison test. ****, adjusted P value < 0.0001; **, adjusted P value < 0.001; *, adjusted P value < 0.05. n = 1 with three technical replicates. b BH3 profiling of A375M melanoma xenografts (n = 2) following treatment with dabrafenib in vivo. BIM peptide measures BCL-2 family member dependence, whereas MS1 and NOXA peptides measure dependence on MCL-1. Statistical comparison was done using one-way ANOVA with Dunnett’s multiple comparison test. *, adjusted P value < 0.05. c Timing of drug treatment of murine melanoma models. Arrows indicate time of drug treatment per day. d Weight of mice treated with BRAF inhibitor, MCL1 inhibitor S63845 or sequential administration of BRAF inhibitor followed by MCL1 inhibitors (n = 8 per group). e Change in A375M xenograft tumor volume following treatment with MCL1, BRAF, or sequential BRAF/MCL1 inhibitors. Statistical comparison of change of dabrafenib versus dabrafenib → S63845-treated animals was done using two-away ANOVA with Sidak multiple comparison tests (n = 14–16). **, adjusted P value < 0.005. f Change in A375M xenograft tumor volume after 14 days treatment (relative to pre-treatment tumor volume) following treatment with structurally distinct MCL1 inhibitors, BRAF inhibitor, or sequential administration of BRAF inhibitor followed by MCL1 inhibitors. Statistical comparison with vehicle-treated animal was done one-way ANOVA with multiple comparison tests. ***, adjusted P value < 0.001. g Overall survival of A375M xenograft models following treatment with MCL1, BRAF or sequential BRAF/MCL1 inhibitors. Statistical comparison was performed using Log-rank (Mantel–Cox) test. *, P value < 0.05. h Evaluation of residual tumors in mice treated with dabrafenib followed by S63845. Scale bar = 100 µm. For d, e, f, n = 14–16 per group. Error bars indicate mean ± s.e.m. of indicated replicates. See also Supplementary Fig. 5. Source data for all Western blots are provided as a Source Data file

Comment in

References

    1. Sanchez-Vega F, et al. Oncogenic signaling pathways in The Cancer Genome Atlas. Cell. 2018;173:321–337.e310. doi: 10.1016/j.cell.2018.03.035. - DOI - PMC - PubMed
    1. Davies H, et al. Mutations of the BRAF gene in human cancer. Nature. 2002;417:949–954. doi: 10.1038/nature00766. - DOI - PubMed
    1. Paez JG, et al. EGFR mutations in lung cancer: correlation with clinical response to gefitinib therapy. Science. 2004;304:1497–1500. doi: 10.1126/science.1099314. - DOI - PubMed
    1. Lynch TJ, et al. Activating mutations in the epidermal growth factor receptor underlying responsiveness of non-small-cell lung cancer to gefitinib. New Engl. J. Med. 2004;350:2129–2139. doi: 10.1056/NEJMoa040938. - DOI - PubMed
    1. Hirota S, et al. Gain-of-function mutations of c-kit in human gastrointestinal stromal tumors. Science. 1998;279:577–580. doi: 10.1126/science.279.5350.577. - DOI - PubMed

Publication types

MeSH terms