. 2019 Nov 6;5(1):34.
doi: 10.1038/s41522-019-0108-3. eCollection 2019.

Rapid microevolution of biofilm cells in response to antibiotics

Affiliations

Rapid microevolution of biofilm cells in response to antibiotics

Anahit Penesyan et al. NPJ Biofilms Microbiomes. .

Abstract

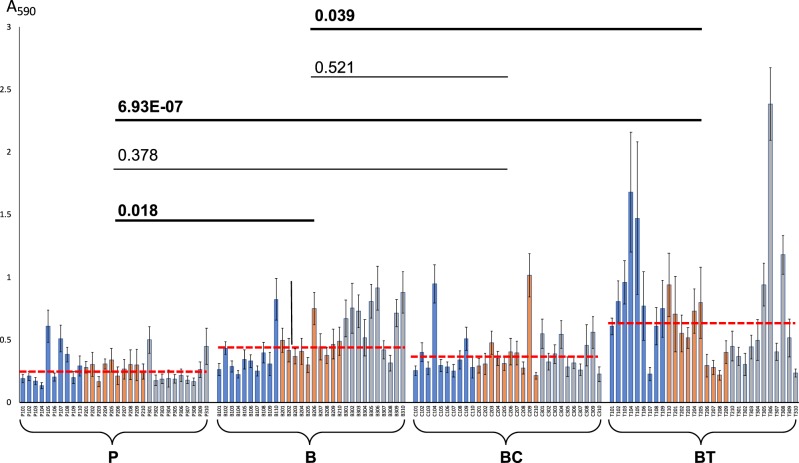
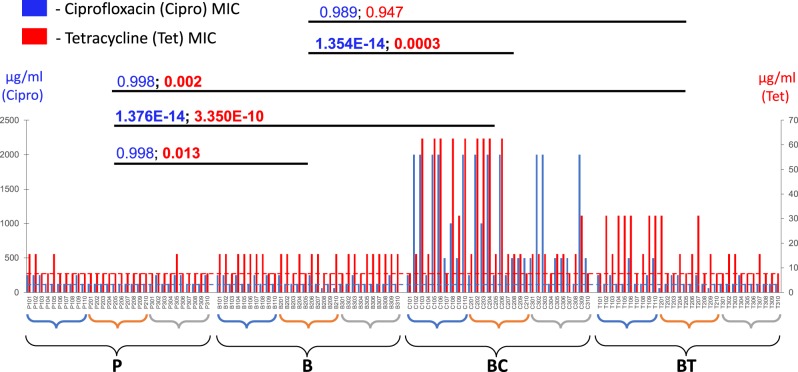
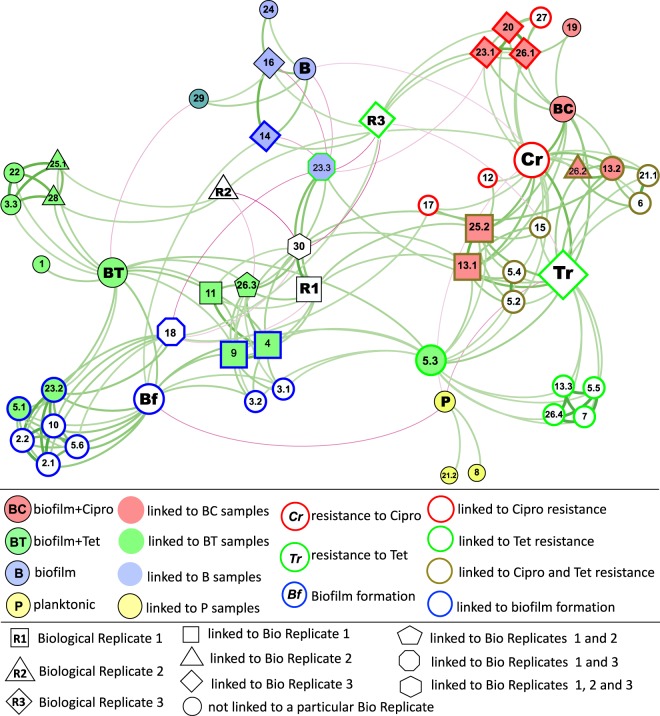
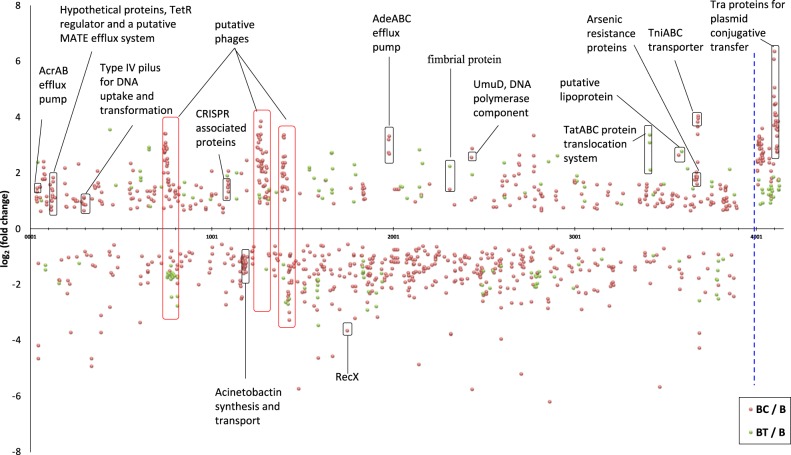
Infections caused by Acinetobacter baumannii are increasingly antibiotic resistant, generating a significant public health problem. Like many bacteria, A. baumannii adopts a biofilm lifestyle that enhances its antibiotic resistance and environmental resilience. Biofilms represent the predominant mode of microbial life, but research into antibiotic resistance has mainly focused on planktonic cells. We investigated the dynamics of A. baumannii biofilms in the presence of antibiotics. A 3-day exposure of A. baumannii biofilms to sub-inhibitory concentrations of antibiotics had a profound effect, increasing biofilm formation and antibiotic resistance in the majority of biofilm dispersal isolates. Cells dispersing from biofilms were genome sequenced to identify mutations accumulating in their genomes, and network analysis linked these mutations to their phenotypes. Transcriptomics of biofilms confirmed the network analysis results, revealing novel gene functions of relevance to both resistance and biofilm formation. This approach is a rapid and objective tool for investigating resistance dynamics of biofilms.

Keywords: Antimicrobials; Biofilms.


Conflict of interest statement

Competing interestsThe authors declare no competing interests.

Figures

Fig. 1
Fig. 1
Results of biofilm formation assay. X-axis: 30 planktonic isolates P101–P310 (P samples), 30 antibiotic-free biofilm effluent isolates B101–B310 (B samples), 30 ciprofloxacin-exposed biofilm effluent isolates C101–C310 (BC samples), and 30 tetracycline-exposed biofilm effluent isolates T101–T310 (BT samples). Each sample type includes 10 isolates from each biological replicate 1 (blue bars), biological replicate 2 (orange bars), and biological replicate 3 (gray bars). The Y-axis represents corresponding absorbance values of 5-fold diluted crystal violet extracts at 590 nm (A590). Error bars represent standard deviations between 24 technical replicates. The average value for each sample type is indicated by red dashed lines. P values denote differences between sample pairs based on nested mixed-factor ANOVA test followed by Turkey’s HSD post hoc test. P values showing statistically significant (p < 0.05) differences are presented in bold
Fig. 2
Fig. 2
Results of the minimum inhibitory concentration (MIC) antibiotic susceptibility assay. X-axis: 30 planktonic isolates P101–P310 (P samples), 30 antibiotic-free biofilm effluent isolates B101–B310 (B samples), 30 ciprofloxacin-exposed biofilm effluent isolates C101–C310 (BC samples), and 30 tetracycline-exposed biofilm effluent isolates T101–T310 (BT samples). Each sample type includes 10 isolates from each biological replicate 1 (blue parentheses), biological replicate 2 (orange parentheses), and biological replicate 3 (gray parentheses). Blue bars represent the MIC levels of ciprofloxacin (in μg/ml, measured on the primary Y-axis on the left), and red bars—the MIC levels of tetracycline (in μg/ml, measured on the right-hand Y-axis). Consensus MIC levels in the initial planktonic cultures are shown by the horizontal blue (for ciprofloxacin MIC) and red (for tetracycline MIC) dashed lines. P values denote differences between sample pairs based on nested mixed factor ANOVA test followed by Turkey’s HSD post hoc test. P values showing statistically significant (p < 0.05) differences are presented in bold
Fig. 3
Fig. 3
The network linking mutations with the growth regime, phenotypes, and biological replicates. The force-directed representation of the network is constructed based on co-occurrence patterns and correlations (p value <0.01) between mutations and the growth regime, between mutations and phenotypic measures, and between mutations and biological replicates. Growth regime/sample types are presented as color-filled nodes: P—planktonic culture (yellow-filled), B—antibiotic-free biofilm effluent (blue-filled), BC—ciprofloxacin-exposed biofilm effluent (red-filled), BT—tetracycline-exposed biofilm effluent (green-filled). Phenotypes are presented as color-outlined nodes: Bf (blue-outlined)—biofilm formation, measured in microtiter plate assay; Cr (red-outlined)—resistance to ciprofloxacin measured in MIC assay; and Tr (green-outlined)—resistance to tetracycline measured in MIC assay. P, B, BT, and BC nodes represent the sample type; Bf, Cr, and Tr nodes represent a phenotype; R1, R2, and R3 represent biological replicates 1, 2, and 3, respectively; all other nodes denote mutations directly linked with a specific sample type and/or phenotype. The fill color of nodes corresponds to the sample type that the mutation directly correlates with (linked to P—yellow-filled, to B—blue-filled, to BC—red-filled, to BT—green-filled). The node outline color corresponds to the phenotype with which the mutation is directly linked to (linked to Bf—blue-outlined, to Cr—red-outlined, to Tr –green-outlined). Mutations directly linked to both ciprofloxacin and tetracycline resistance are outlined in khaki. Mutations linked to a particular biological replicate are indicated as squares (linked to replicate 1), triangles (linked to replicate 2), diamonds (linked to replicate 3), pentagons (linked to replicates 1 and 2), octagons (linked to replicates 1 and 3), and a hexagon (linked to replicates 1, 2, and 3). The size of the node is relative to the node authority. Edges (the lines connecting the nodes) represent correlations between two nodes, positive correlations are presented in green, and negatives in magenta. Edge thickness/intensity represents the strength of correlation. The full description of each mutation is presented in Table 2
Fig. 4
Fig. 4
Transcriptomic changes observed in antibiotic-exposed biofilms compared to antibiotic-free biofilm samples. Transcriptomic changes (log2 fold change; p adj <0.05) detected in ciprofloxacin- and tetracycline-exposed biofilm samples are presented by orange and green circles, respectively. The X-axis represents locus tag numbers of the AB5075-UW main chromosome and the largest plasmid 1 (separated by the blue dashed line). Putative phage genes are outlined by red rectangles. Three independent biological replicates were used for evaluating significance

References

    1. Peleg AY, Seifert H, Paterson DL. Acinetobacter baumannii: emergence of a successful pathogen. Clin. Microbiol. Rev. 2008;21:538–582. doi: 10.1128/CMR.00058-07. - DOI - PMC - PubMed
    1. Vincent J, et al. International study of the prevalence and outcomes of infection in intensive care units. JAMA. 2009;302:2323–2329. doi: 10.1001/jama.2009.1754. - DOI - PubMed
    1. Rice LB. Federal funding for the study of antimicrobial resistance in nosocomial pathogens: No ESKAPE. J. Infect. Dis. 2008;197:1079–1081. doi: 10.1086/533452. - DOI - PubMed
    1. World Health Organization. Global Priority List of Antibiotic-resistant Bacteria to Guide Research, Discovery, and Development of New Antibiotics (World Health Organization, Geneva, 2017).
    1. Penesyan A, Gillings M, Paulsen IT. Antibiotic discovery: Combatting bacterial resistance in cells and in biofilm communities. Molecules. 2015;20:5286–5298. doi: 10.3390/molecules20045286. - DOI - PMC - PubMed

Publication types

MeSH terms

Substances