. 2019 Nov 11:5:40.
doi: 10.1038/s41540-019-0118-z. eCollection 2019.

From expression footprints to causal pathways: contextualizing large signaling networks with CARNIVAL

Affiliations

From expression footprints to causal pathways: contextualizing large signaling networks with CARNIVAL

Anika Liu et al. NPJ Syst Biol Appl. .

Abstract

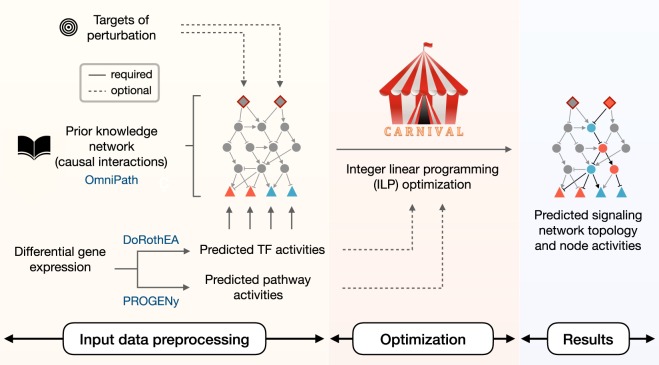
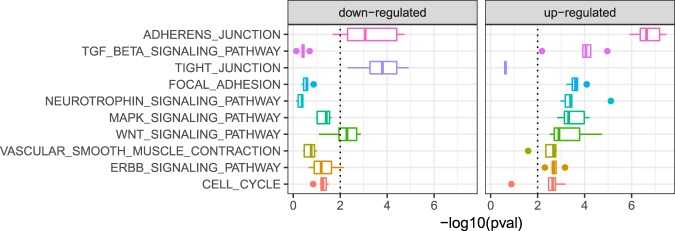
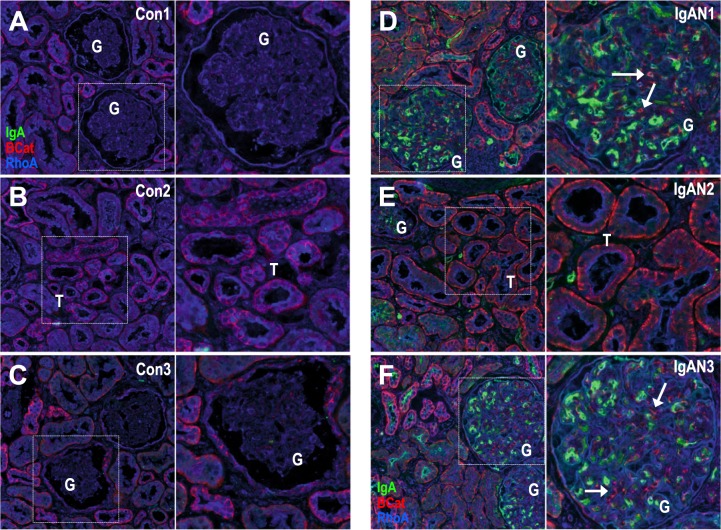
While gene expression profiling is commonly used to gain an overview of cellular processes, the identification of upstream processes that drive expression changes remains a challenge. To address this issue, we introduce CARNIVAL, a causal network contextualization tool which derives network architectures from gene expression footprints. CARNIVAL (CAusal Reasoning pipeline for Network identification using Integer VALue programming) integrates different sources of prior knowledge including signed and directed protein-protein interactions, transcription factor targets, and pathway signatures. The use of prior knowledge in CARNIVAL enables capturing a broad set of upstream cellular processes and regulators, leading to a higher accuracy when benchmarked against related tools. Implementation as an integer linear programming (ILP) problem guarantees efficient computation. As a case study, we applied CARNIVAL to contextualize signaling networks from gene expression data in IgA nephropathy (IgAN), a condition that can lead to chronic kidney disease. CARNIVAL identified specific signaling pathways and associated mediators dysregulated in IgAN including Wnt and TGF-β, which we subsequently validated experimentally. These results demonstrated how CARNIVAL generates hypotheses on potential upstream alterations that propagate through signaling networks, providing insights into diseases.

Keywords: Regulatory networks; Software.


Conflict of interest statement

Competing interestsThe authors declare no competing interests

Figures

Fig. 1
Fig. 1. CARNIVAL pipeline.
The CARNIVAL pipeline requires as input a prior knowledge network and differential gene expression. The information on perturbed targets and their effects can be assigned (Standard CARNIVAL “StdCARNIVAL”) or omitted (InvCARNIVAL). The differential gene expression is used to infer transcription factor (TF) activities with DoRothEA, which are subsequently discretized in order to formulate ILPconstraints. As a result, CARNIVAL derives a family of highest scoring networks which best explain theinferred TF activities. Continuous pathway and TF activities can be additionally considered in the objective function
Fig. 2
Fig. 2. Two-step inference analysis to determine whether relevant molecular processes were identified in CARNIVAL.
First, dysregulated pathways were inferred by over-representation of the nodes in CARNIVAL solution networks based on the KEGG pathway sets in MSigDB. In the second step, an enrichment analysis was performed on the identified dysregulated pathways using stimulus specific pathways as prior set. The distributions of p-values from multiple statistical tests are reported as final result. A significant enrichment of the attributed pathways in the direction that the target protein is perturbed is expected
Fig. 3
Fig. 3. Comparison of the enrichment results of the perturbation-attributed pathway set in dysregulated pathways inferred with different tools.
An enrichment of the perturbation-attributed pathway set among the significant pathways was determined. The significance level of 0.05 is indicated by the dotted lines. Asterisks (*) indicate the clear directionality of results where the enrichment results are significant in the up-regulated set and insignificant in the down-regulated set
Fig. 4
Fig. 4. IgAN-contextualized network from CARNIVAL.
The network summarizes the CARNIVAL results for node penalty β = 0.8. This network consists of 43 TFs, 37 input nodes and 62 associated nodes which are connected through 231 edges. Up-regulated nodes and activatory reactions are indicated in blue while down-regulated nodes and inhibitory edges are colored in red. Triangles correspond to transcription factors, diamonds represent input nodes and circlescor respond to purely inferred nodes. Members of the most dysregulated gene set, i.e. adherens junctions, are labeled by more intense background colors
Fig. 5
Fig. 5. Dysregulated cellular processes in IgAN.
Up- and down-regulated pathways are shown with decreasing median significance from top to bottom. The significance level is 0.01. Among others, these point to podocyte injury and the disruption of the slit diaphragms, as well as fibrosis
Fig. 6
Fig. 6. Validation experiment.
IgA (green) beta-catenin (red) and RhoA (blue) staining was performed in human biopsies collected from either healthy pre-transplantation control donors(Con1-3; ac) or diagnosed IgAN patients (IgAN1-3; df). 3 representative examples are shown and areas with glomeruli (G) and proximal tubules (T) are indicated. Accumulation of IgA (green) is the pathological hallmark of IgAN and there is no IgA staining in control specimens (ac). RhoA immunostaining (blue) seems to be ubiquitous and dispersed in tubules and glomeruli. beta-catenin31 (red) is elevated in IgAN biopsies and there is an increase in beta-catenin cellular staining in glomeruli (arrows). Dotted white boxes depict highlighted areas magnified on left panels. All sections were 10 µm thick scanned with a 20x lens

References

    1. Giudice, G. & Petsalaki, E. Proteomics and phosphoproteomics in precision medicine: applications and challenges. Brief. Bioinform. 10.1093/bib/bbx141 (2017). - PMC - PubMed
    1. Invergo BM, Beltrao P. Reconstructing phosphorylation signalling networks from quantitative phosphoproteomic data. Essays Biochem. 2018;62:525–534. doi: 10.1042/EBC20180019. - DOI - PMC - PubMed
    1. Hill SM, et al. Inferring causal molecular networks: empirical assessment through a community-based effort. Nat. Methods. 2016;13:310. doi: 10.1038/nmeth.3773. - DOI - PMC - PubMed
    1. Chen B, Fan W, Liu J, Wu F-X. Identifying protein complexes and functional modules-from static PPI networks to dynamic PPI networks. Brief. Bioinform. 2014;15:177–194. doi: 10.1093/bib/bbt039. - DOI - PubMed
    1. Huang S-SC, Fraenkel E. Integrating proteomic, transcriptional, and interactome data reveals hidden components of signaling and regulatory networks. Sci. Signal. 2009;2:ra40. - PMC - PubMed

Publication types

Substances