. 2019 Sep 8;6(21):1900667.
doi: 10.1002/advs.201900667. eCollection 2019 Nov 6.

Periodic Oxaliplatin Administration in Synergy with PER2-Mediated PCNA Transcription Repression Promotes Chronochemotherapeutic Efficacy of OSCC

Affiliations

Periodic Oxaliplatin Administration in Synergy with PER2-Mediated PCNA Transcription Repression Promotes Chronochemotherapeutic Efficacy of OSCC

Qingming Tang et al. Adv Sci (Weinh). .

Abstract

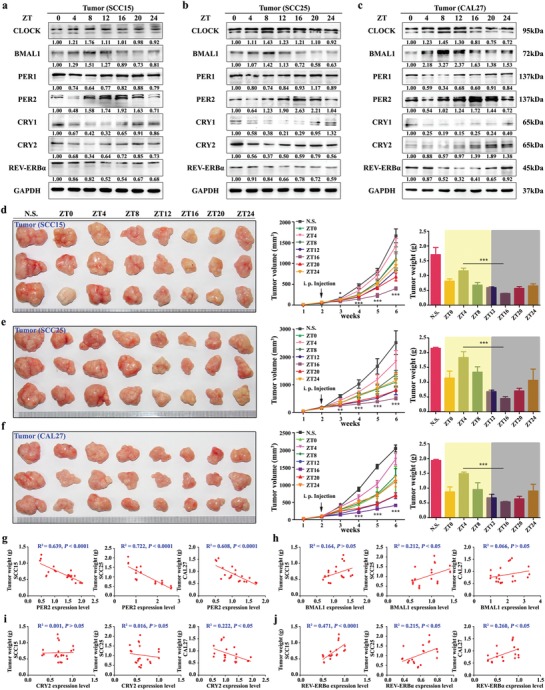
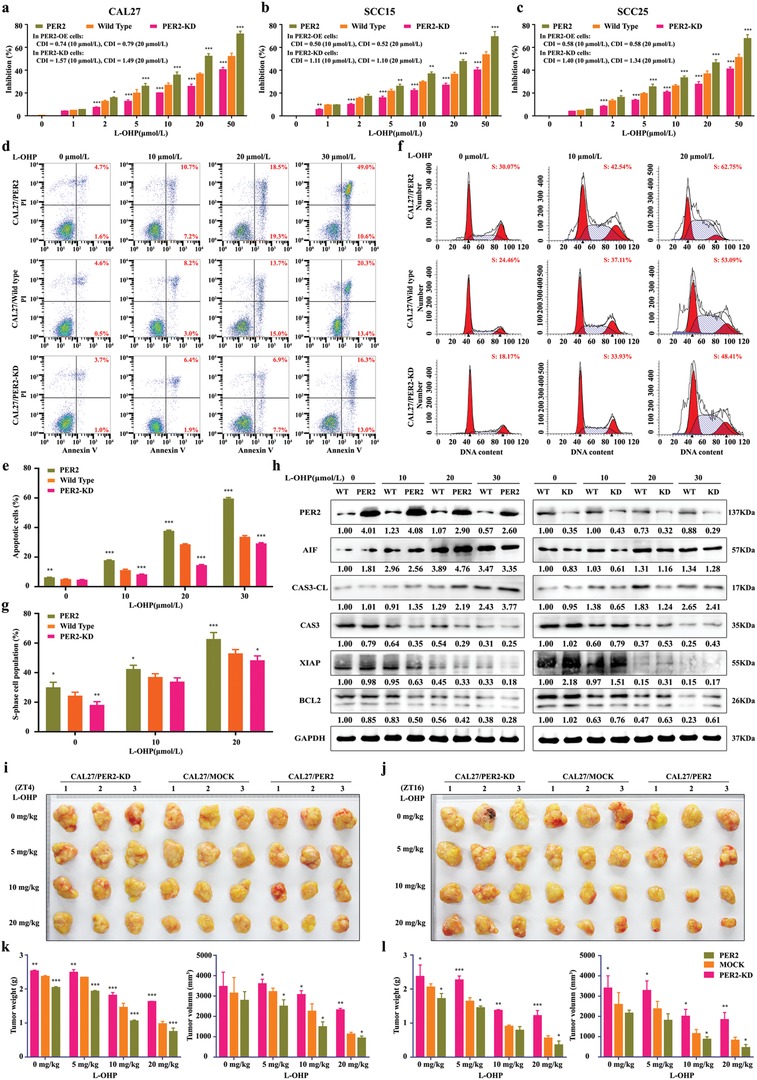
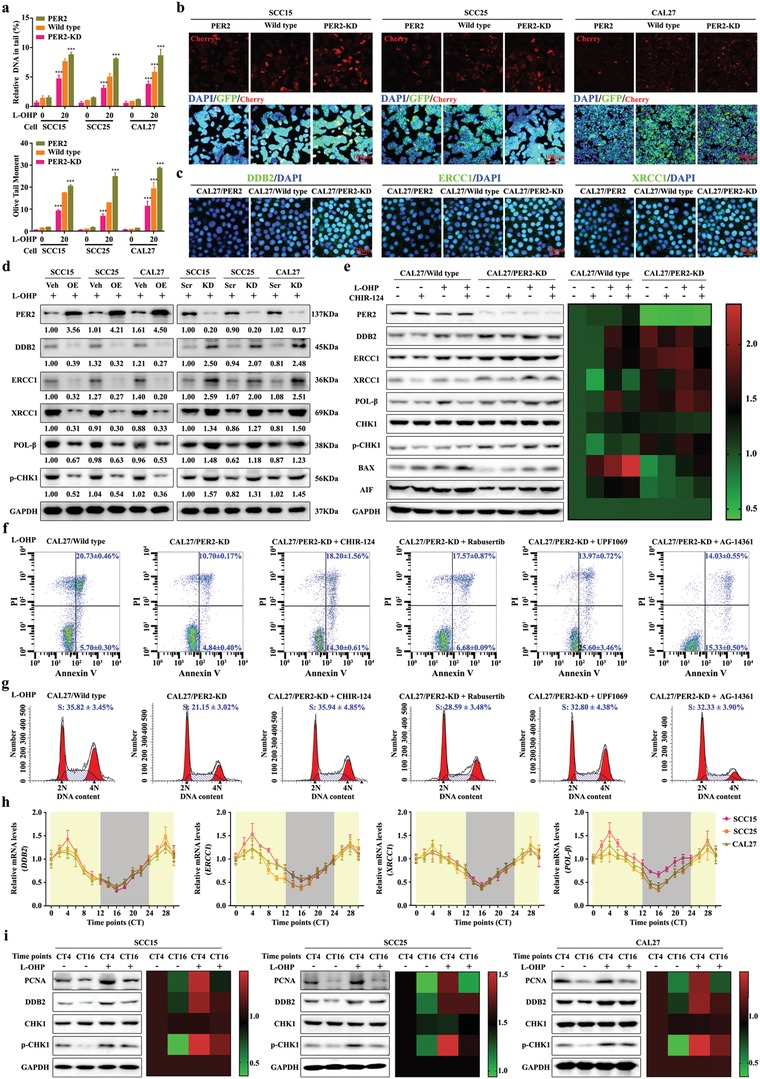
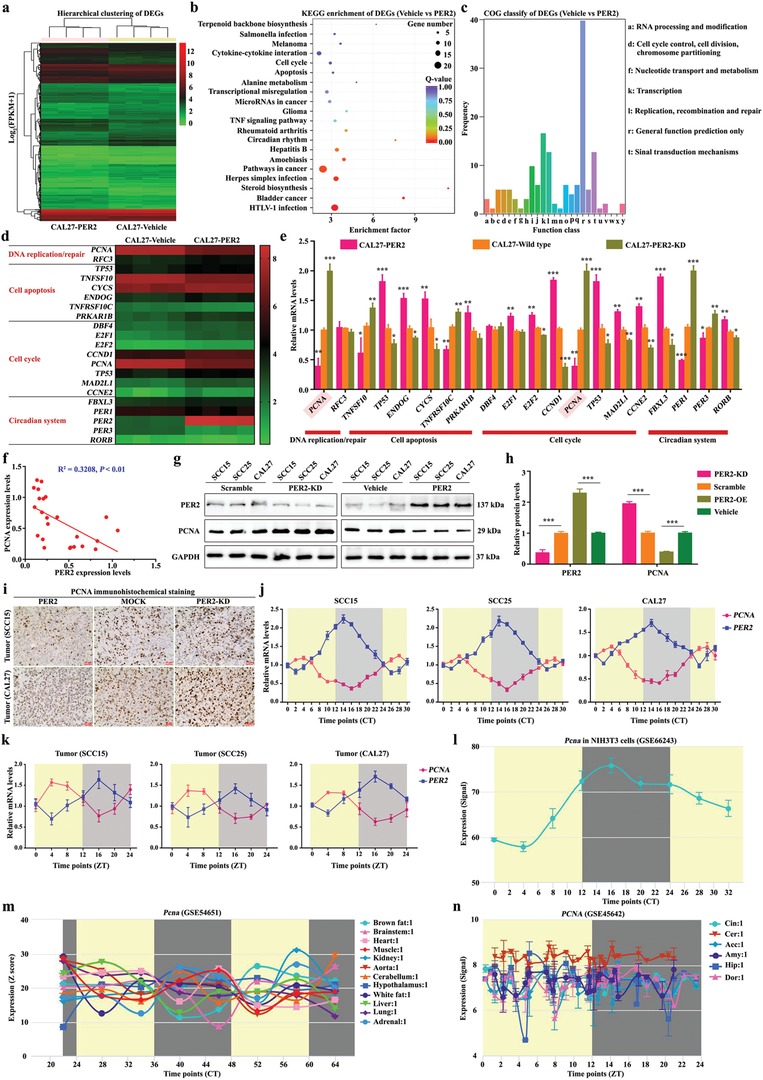
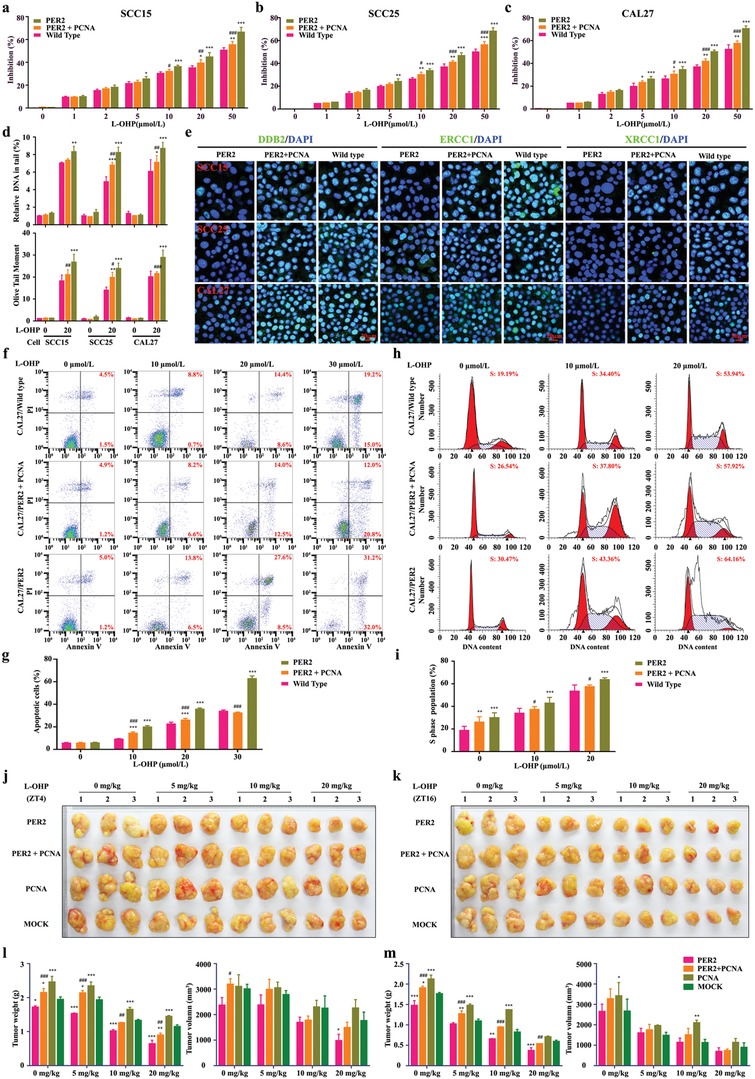
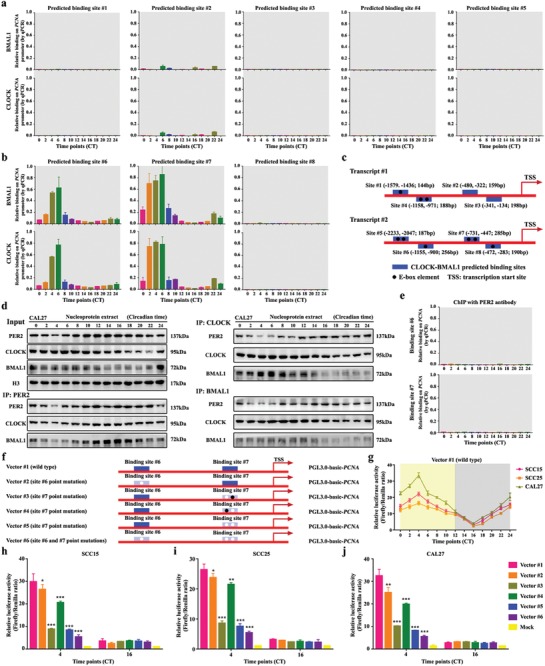
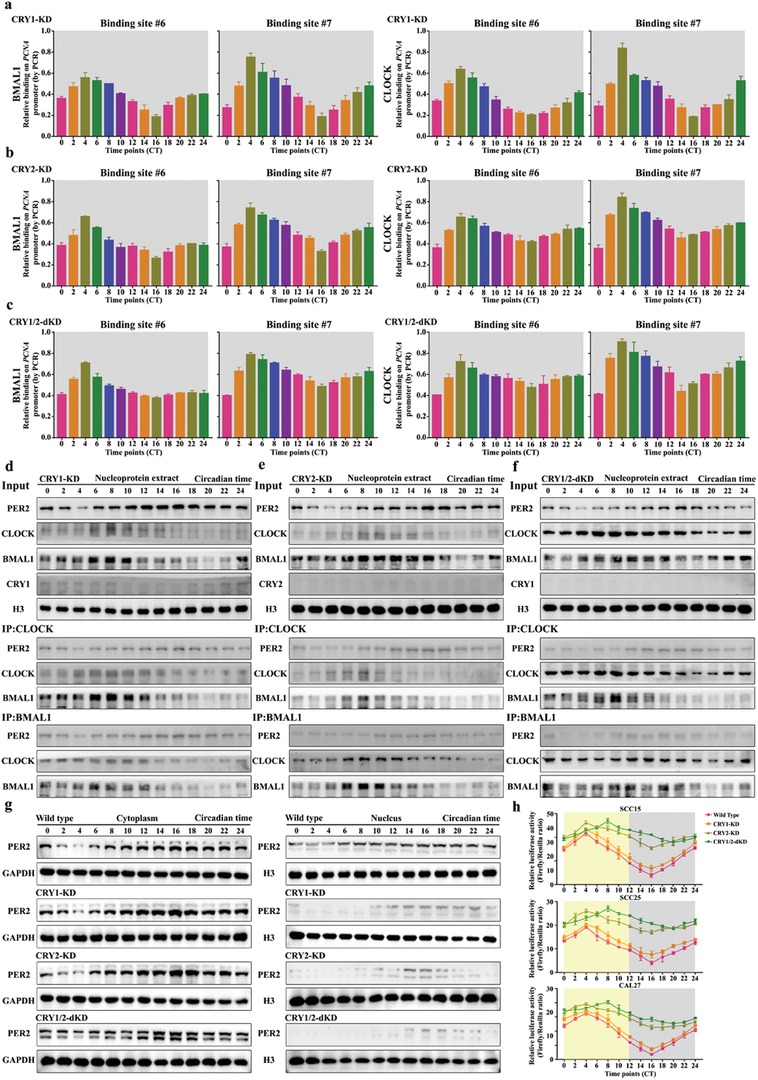
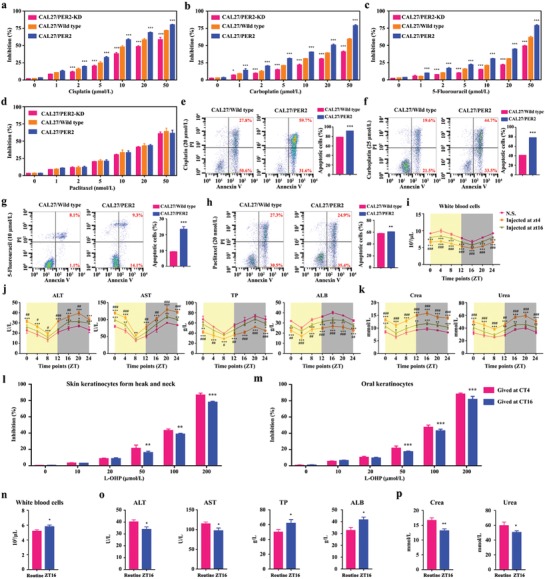
Developing chemotherapeutic resistance affects clinical outcomes of oxaliplatin treatment on various types of cancer. Thus, it is imperative to explore alternative therapeutic strategies to improve the efficacy of oxaliplatin. Here, it is shown that circadian regulator period 2 (PER2) can potentiate the cytotoxicity of oxaliplatin and boost cell apoptosis by inhibiting DNA adducts repair in human oral squamous cell carcinoma (OSCC) cells. The circadian timing system is closely involved in controling the activity of DNA adducts repair and gives it a 24 h rhythm. The mechanistic dissection clarifies that PER2 can periodically suppress proliferating cell nuclear antigen (PCNA) transcription by pulling down circadian locomotor output cycles kaput-brain and muscle arnt-like 1 heterodimer from PCNA promoter in a CRY1/2-dependent manner, which subsequently impedes oxaliplatin-induced DNA adducts repair. Similarly, PER2 is capable of improving the efficacy of classical DNA-damaging chemotherapeutic agents. The tumor-bearing mouse model displays PER2 can be deployed as an oxaliplatin administration timing biomarker. In summary, it is believed that the chronochemotherapeutic strategy matching PER2 expression rhythm can efficiently improve the oxaliplatin efficacy of OSCC.

Keywords: DNA‐damaging repair; chronochemotherapeutic strategy; circadian clock genes; oral squamous cell carcinoma; oxaliplatin.


Conflict of interest statement

The authors declare no conflict of interest.

Figures

Figure 1
Figure 1
The efficacy of oxaliplatin exists in a time‐dependent manner related to PER2 expression. a–c) Western blot and densitometric quantification of circadian proteins in tumors: SCC15, SCC25, or CAL27 cells were subcutaneously injected into mice, and the tumors were obtained at indicated time points after six weeks. Samples were collected every 4 h for total 24 h. GAPDH was used for loading control. d–f) Representative images (left), tumor volume growth curves (middle), and weights (right) of tumors formed after oxaliplatin chronotherapy: SCC15, SCC25, and CAL27 cells were subcutaneously injected into mice. Two weeks after cell inoculation, mice were treated with oxaliplatin (20 mg kg−1, twice a week) or normal saline at indicated time points for four weeks. N.S., normal saline. *P < 0.05, **P < 0.01, and ***P < 0.001 (compared with ZT4). ANOVA and Student's t‐test were used. g–j) The linear correlation was analyzed by coefficient of determination between PER2, BMAL1, CRY2, and REV‐ERBα expression levels and tumor weights. Data represent the mean ± SD of three animals per group.
Figure 2
Figure 2
PER2 strengthens the cytotoxicity of oxaliplatin in human OSCC. a–c) Dose‐dependent growth inhibition in response to oxaliplatin (L‐OHP) treatment in PER2 overexpression or PER2‐knockdown CAL27, SCC15, and SCC25 cells (n = 5 independent experiments). Wild‐type cells were used as control. CDI was the coefficient of drug interaction. d,e) Cell apoptosis was evaluated by flow cytometry of CAL27/PER2 and CAL27/PER2‐knockdown (KD) cells stained with Annexin V and PI after treatment with oxaliplatin (0, 10, 20, or 30 µmol L−1, 48 h) (n = 3 independent experiments). f,g) Cell‐cycle phases were determined by flow cytometry of CAL27/PER2 and CAL27/PER2‐KD cells after treatment with oxaliplatin (0, 10, or 20 µmol L−1, 48 h) (n = 3 independent experiments). h) Western blot and densitometric quantification of the indicated proteins in CAL27/PER2 and CAL27/PER2‐KD cells treated with 0, 10, 20, or 30 µmol L−1 oxaliplatin (n = 3 independent experiments). GAPDH was used as the loading control. i,j) Representative images of xenografts formed after oxaliplatin treatment. CAL27/PER2 and CAL27/PER2‐KD cells were subcutaneously injected into mice. Mock was used as the control. g,h) Two weeks after cell inoculation, mice were treated with 0, 5, 10, or 20 mg kg−1 oxaliplatin (twice a week) for four weeks at ZT4 or ZT16. k,l) Tumor weights and volumes at the endpoint of mice (n = 3 animals per group). *P < 0.05, **P < 0.01, and ***P < 0.001 (compared with wild type or mock). ANOVA was used. Data represent the mean ± SD.
Figure 3
Figure 3
PER2 promotes the oxaliplatin sensitivity via impairing DNA adducts repair. a) Comet assay breaks. DNA strand breaks of globally oxaliplatin‐treated (30 µmol L−1, 48 h). Breaks were quantified as % tail DNA and olive tail moment. At least 50 cells were analyzed per sample. b) Analysis of fluorescent protein expression from oxaliplatin‐incubated vector with cherry in OSCC cells (final concentration: 50 µmol L−1, 12 h, at 37 °C). The vector with GFP was used as control. Scale bar, 100 µm. c) Representative confocal images of DDB2, ERCC1, and XRCC1 in PER2‐overexpressing or knockdown CAL27 cells. Scale bar, 20 µm. d) Western blot and densitometric quantification of the indicated proteins of DNA adducts repair markers in PER2‐overexpressing (left) or PER2‐knockdown (right) SCC15, SCC25, and CAL27 cells with oxaliplatin (20 µmol L−1) treatment. GAPDH was used as the loading control. e) Western blot (left) and densitometric quantification (right) of the indicated proteins of DNA adducts repair markers in PER2‐knockdown or control CAL27 cells after treatment with oxaliplatin (L‐OHP, 20 µmol L−1) with or without CHIR‐124 (0.3 nmol L−1). f) Apoptosis was evaluated by flow cytometry of CAL27 cells after oxaliplatin (20 µmol L−1) treatment with or without CHIR‐124 (0.3 nmol L−1), Rabusertib (7 nmol L−1), UPF1069 (0.3 µmol L−1), or AG‐14361 (4 nmol L−1). Cells stained with Annexin V and PI. g) Cell‐cycle phases were determined by flow cytometry of cells treated with oxaliplatin (20 µmol L−1). h) The circadian oscillation of DDB2, ERCC1, XRCC1, and POL‐β mRNA levels in OSCC cells at the indicated time points. i) Western blot and densitometric quantification of the indicated proteins of DNA adducts repair markers in OSCC cells after treated with or without oxaliplatin (20 µmol L−1) at indicated time points. GAPDH was used as the loading control. *P < 0.05, **P < 0.01, and ***P < 0.001 (compared with wild type). ANOVA was used. Data represent the mean ± SD of three independent experiments.
Figure 4
Figure 4
PCNA is under the strict control of the PER2‐mediated circadian clock system. a) Hierarchical clustering of differentially expressed genes (DEGs) in PER2‐overexpressing and vehicle cells (n = 4 per group). b,c) The KEGG enrichment and COG classify analyses of DEGs. d) The heatmap shows DEGs which were related to DNA replication and repair, cell apoptosis, cell cycle, and the circadian system. e) Confirmation of the DEGs by qRT‐PCR analysis (n = 3 for each bar). f) The correlation between PER2 and PCNA expression levels in human OSCC tissues (n = 24 samples). g,h) Western blot and densitometric quantification of PER2, PCNA, and GAPDH (as the loading control) (n = 3 independent experiments). i) Representative immunohistochemistry images of PCNA+ cells in xenografts formed by subcutaneous injection of PER2 overexpressed, PER2 knockdown, or mock SCC15 (upper)/CAL27 (lower) cells (n = 6 animals per group). j) The mRNA levels of PER2 and PCNA in OSCC cells at indicated time‐points (n = 3 independent experiments). k) The mRNA levels of PER2 and PCNA in OSCC xenografts at the indicated time points (n = 3 animals per time point). l–n) Expression pattern of rhythmic gene Pcna using public datasets of NIH3T3 cells (GSE66243), 12 mouse organs (GSE66243), and 6 brain regions (GSE66243). *P < 0.05, **P < 0.01, and ***P < 0.001 (compared with scramble, vehicle, or wild type), from Student's t‐test or ANOVA. Data represent the mean ± SD.
Figure 5
Figure 5
PCNA is negatively correlated with PER2 in oxaliplatin sensitivity modulation. a–c) Dose‐dependent growth inhibition in response to oxaliplatin (20 µmol L−1) in PER2‐overexpressing or PER2/PCNA double‐overexpressing SCC15, SCC25, or CAL27 cells (n = 5 independent experiments). d) Comet assay breaks. DNA strand breaks of globally oxaliplatin‐treated (30 µmol L−1, 48 h). Breaks were quantified as % tail DNA (upper) and olive tail moment (lower). At least 50 cells were analyzed per sample. e) Representative confocal images of DDB2, ERCC1, and XRCC1 in PER2‐overexpressing or PER2/PCNA double‐overexpressing OSCC cells (n = 3 independent experiments). Scale bar, 20 µm. f,g) Apoptosis was evaluated by flow cytometry of CAL27/PER2 and CAL27/PER2+PCNA cells after treatment with oxaliplatin (0, 10, 20, or 30 µmol L−1, 48 h), cell stained with Annexin V and PI (n = 3 independent experiments). h,i) Cell‐cycle phases were determined by flow cytometry of CAL27/PER2 and CAL27/PER2+PCNA cells after treatment with oxaliplatin (0, 10, or 20 µmol L−1, 48 h) (n = 3 independent experiments). j,k) Representative images of xenografts formed after oxaliplatin treatment. CAL27/PER2, CAL27/PER2+PCNA, or CAL27/PCNA cells were subcutaneously injected into mice. Two weeks after cell inoculation, mice were treated with 0, 5, 10, or 20 mg kg−1 oxaliplatin (twice a week) for four weeks at ZT4 (j) or ZT16 (k) (n = 3 animals per group). l,m) Tumor weights and volumes at the endpoint of mice. *P < 0.05, **P < 0.01, and ***P < 0.001 (compared with wild type or Mock), # P < 0.05, ## P < 0.01, and ### P < 0.001 (compared with PER2), from ANOVA. Data represent the mean ± SD.
Figure 6
Figure 6
PER2 limits PCNA transcription by eliminating CLOCK‐BMAL1 heterodimer from PCNA promoter. a,b) CLOCK and BMAL1 were bound to the PCNA promoter at predicted binding site #6 and #7 in CAL27 cells. Chromatin immunoprecipitation assays were performed using anti‐BMAL1 or anti‐CLOCK with anti‐IgG as a negative control. c) The schematic shows the CLOCK‐BMAL1 binding sites to the PCNA promoter. d) Coimmunoprecipitation (Co‐IP) was performed in nucleoprotein extracts obtained across a circadian cycle with anti‐PER2, anti‐CLOCK, anti‐BMAL1 antibody, or IgG (served as a negative control) and detected by Western blot analysis with anti‐PER2, anti‐CLOCK, anti‐BMAL1, anti‐CRY1, or anti‐CRY2 antibodies. e) ChIP of PER2 on the PCNA promoter demonstrated that PER2 does not bind to the promoter in CAL27 cells. f) The location of the binding sites in the promoter of PCNA. Blue region, the location of the binding site. Filled black circle, wild‐type E‐box element. Filled white circle, point‐mutation E‐box element. g) A diurnal luciferase reporter assay was performed to measure the transcriptional activities of wild‐type PCNA promoter in three OSCC cells at indicated time points. h–j) A luciferase reporter assay was performed to measure the activities of wild‐type PCNA promoter, and its point mutations with a mutated binding site in OSCC cells at CT4 and CT16. Mock, PGL3.0‐basic. *P < 0.05, **P < 0.01, and ***P < 0.001 (compared with wild‐type vector), from ANOVA and Student's t‐test. Data represent the mean ± SD of three independent experiments.
Figure 7
Figure 7
The functional process by which PER2 inhibits PCNA expression is dependent on CRY1/2. a–c) CLOCK and BMAL1 associate with PCNA promoter at predicted binding site #6 and #7 in CRY1 knockdown CAL27 cells, CRY2 knockdown CAL27 cells, and CRY1/2 double‐knockdown CAL27 cells at indicated time points. ChIP assay was performed using anti‐BMAL1 or anti‐CLOCK antibodies, with anti‐IgG antibody as a negative control. d–f) Coimmunoprecipitation (Co‐IP) assay was performed in nucleoprotein extracts obtained across a circadian cycle with anti‐CLOCK, anti‐BMAL1 antibody, or IgG (served as negative control) and detected by Western blot analysis with anti‐PER2, anti‐CLOCK, anti‐BMAL1, anti‐CRY1, or anti‐CRY2 antibodies in CRY1 knockdown CAL27 cells, CRY2 knockdown CAL27 cells, and CRY1/2 double‐knockdown CAL27 cells. g) Nucleocytoplasmic separation and Western blot analysis of cellular localization of PER2 in wild‐type, CRY1‐knockdown, CRY2‐knockdown, and CRY1/2 double‐knockdown CAL27 cells at indicated time points. h) A diurnal luciferase reporter assay was performed to measure the transcriptional activities of wild‐type PCNA promoter in human OSCC cells with CRY1‐knockdown, CRY2‐knockdown, and CRY1/2 double‐knockdown at indicated time points. Data represent the mean ± SD of three independent experiments.
Figure 8
Figure 8
PER2 improves the efficacy and tolerance of DNA‐damaging agents. a–d) Dose‐dependent growth inhibition in response to cisplatin, carboplatin, 5‐fluorouracil, and Paclitaxel in PER2‐overexpression or PER2‐knockdown CAL27 cells (n = 5 independent experiments). Wild‐type cells were used as the control. e–h) Apoptosis was evaluated by flow cytometry of CAL27/wild‐type and CAL27/PER2 cells after treatment with cisplatin, carboplatin, 5‐fluorouracil, and Paclitaxel, cell stained with Annexin V and PI (n = 3 independent experiments). *P < 0.05, **P < 0.01, and ***P < 0.001 (compared with wild type), from ANOVA and Student's t‐test. i) The total number of white blood cells in mice injected with oxaliplatin (20 mg kg−1, twice a week) at ZT4 or ZT16 for four weeks. Normal saline was used as control. *P < 0.05, **P < 0.01, and ***P < 0.001 (compared with N.S.), # P < 0.05, ## P < 0.01, and ### P < 0.001 (compared with ZT16). j,k) Serum alanine transaminase (ALT), aspartate transaminase (AST), total protein (TP), albumin (ALB), creatinine (crea), and urea levels were measured every 4 h over a circadian period after injecting four‐week oxaliplatin at ZT4 or ZT16. l,m) Dose‐dependent growth inhibition in response to oxaliplatin (L‐OHP) treatment in normal epithelial cells from the OSCC adjacent tissues (n = 5 independent experiments). **P < 0.01 and ***P < 0.001 (compared with ZT4). n–p) White blood cells and serum ALT, AST, TP, ALB, crea, and urea levels were measured in mice with injecting four‐week oxaliplatin at ZT16 or random time (routine). *P < 0.05 and **P < 0.01 (compared with routine), from Student's t‐tests. Data represent the mean ± SD of three independent experiments.

References

    1. a) Torre L. A., Bray F., Siegel R. L., Ferlay J., Lortet‐Tieulent J., Jemal A., Ca ‐ Cancer J. Clin. 2015, 65, 87; - PubMed
    2. b) Carnielli C. M., Macedo C. C. S., De Rossi T., Granato D. C., Rivera C., Domingues R. R., Pauletti B. A., Yokoo S., Heberle H., Busso‐Lopes A. F., Cervigne N. K., Sawazaki‐Calone I., Meirelles G. V., Marchi F. A., Telles G. P., Minghim R., Ribeiro A. C. P., Brandao T. B., de Castro G. Jr., Gonzalez‐Arriagada W. A., Gomes A., Penteado F., Santos‐Silva A. R., Lopes M. A., Rodrigues P. C., Sundquist E., Salo T., da Silva S. D., Alaoui‐Jamali M. A., Graner E., Fox J. W., Coletta R. D., Leme A. F. P., Nat. Commun. 2018, 9, 3598. - PMC - PubMed
    1. da Silva S. D., Hier M., Mlynarek A., Kowalski L. P., Alaoui‐Jamali M. A., Front. Pharmacol. 2012, 3, 149. - PMC - PubMed
    1. a) Liu Y., Zheng X., Yu Q., Wang H., Tan F., Zhu Q., Yuan L., Jiang H., Yu L., Zeng S., Sci. Transl. Med. 2016, 8, 348ra97; - PubMed
    2. b) Raguse J. D., Gath H. J., Oettle H., Bier J., Oral Oncol. 2006, 42, 614. - PubMed
    1. Raymond E., Chaney S. G., Taamma A., Cvitkovic E., Ann. Oncol. 1998, 9, 1053. - PubMed
    1. Pignon J. P., Bourhis J., Domenge C., Designe L., Lancet 2000, 355, 949. - PubMed

LinkOut - more resources