. 2020 Mar;80(4):1039-1076.
doi: 10.1007/s00285-019-01448-y. Epub 2019 Nov 14.

Mathematical modelling of telomere length dynamics

Affiliations

Mathematical modelling of telomere length dynamics

Jonathan A D Wattis et al. J Math Biol. 2020 Mar.

Abstract

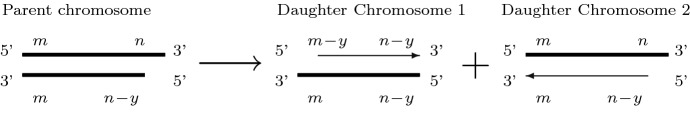
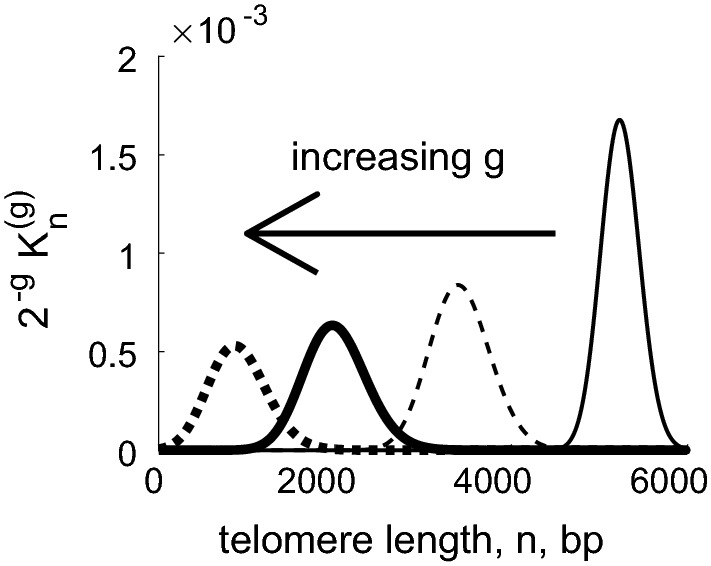
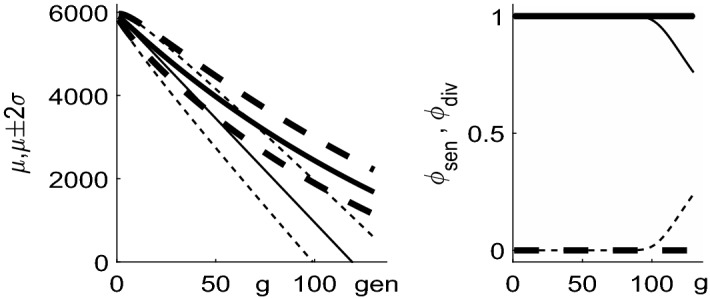
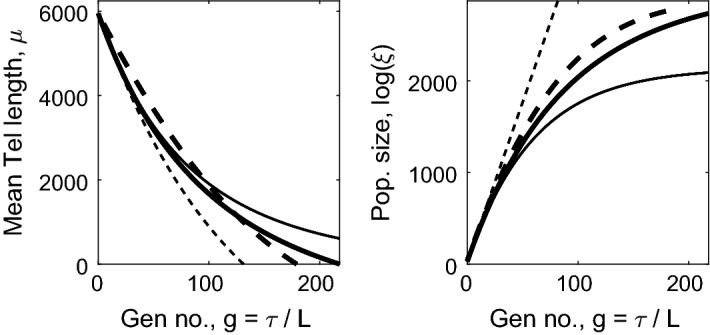
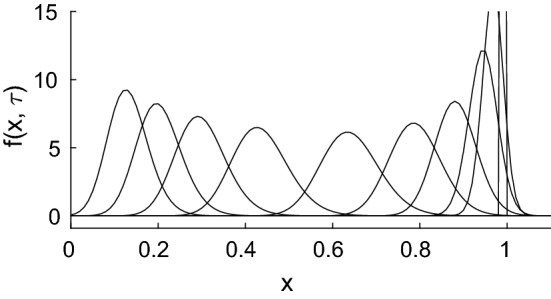
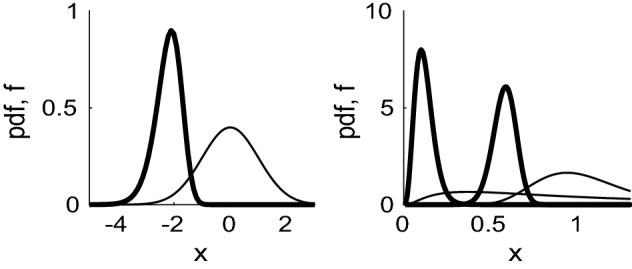
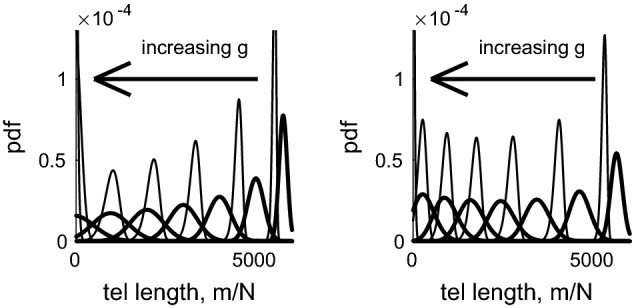
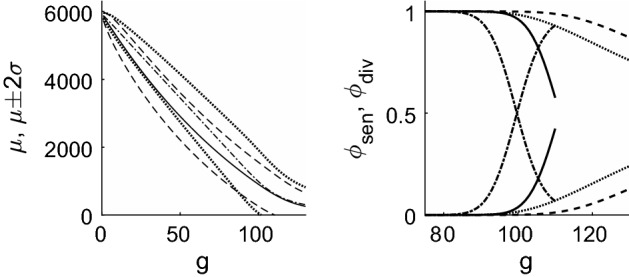
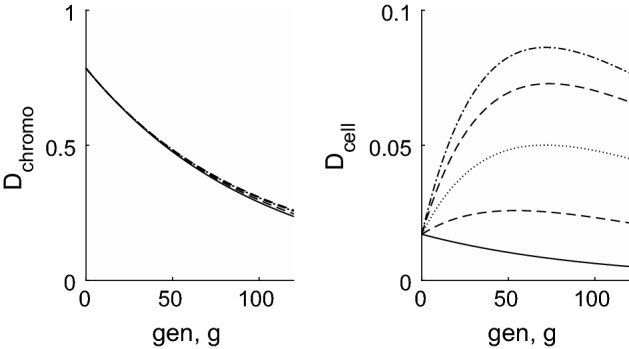
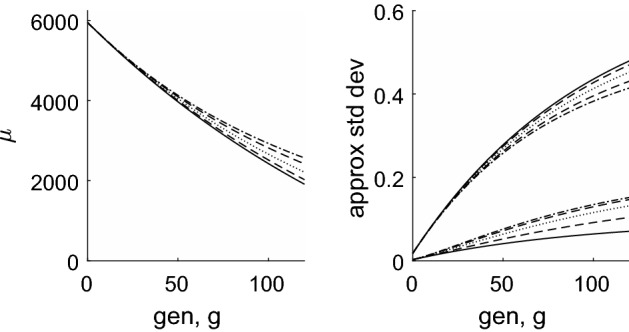
Telomeres are repetitive DNA sequences located at the ends of chromosomes. During cell division, an incomplete copy of each chromosome's DNA is made, causing telomeres to shorten on successive generations. When a threshold length is reached replication ceases and the cell becomes 'senescent'. In this paper, we consider populations of telomeres and, from discrete models, we derive partial differential equations which describe how the distribution of telomere lengths evolves over many generations. We initially consider a population of cells each containing just a single telomere. We use continuum models to compare the effects of various mechanisms of telomere shortening and rates of cell division during normal ageing. For example, the rate (or probability) of cell replication may be fixed or it may decrease as the telomeres shorten. Furthermore, the length of telomere lost on each replication may be constant, or may decrease as the telomeres shorten. Where possible, explicit solutions for the evolution of the distribution of telomere lengths are presented. In other cases, expressions for the mean of the distribution are derived. We extend the models to describe cell populations in which each cell contains a distinct subpopulation of chromosomes. As for the simpler models, constant telomere shortening leads to a linear reduction in telomere length over time, whereas length-dependent shortening results in initially rapid telomere length reduction, slowing at later times. Our analysis also reveals that constant telomere loss leads to a Gaussian (normal) distribution of telomere lengths, whereas length-dependent loss leads to a log-normal distribution. We show that stochastic models, which include a replication probability, also lead to telomere length distributions which are skewed.

Keywords: Aging; End-replication problem; Mathematical; Telomere dynamics.


Figures

Fig. 1
Fig. 1
Illustration of the chromosome replication process: on the left, the two strands of parent DNA are shown, with telomeres of lengths m, m, n and n-y; the two offspring chromosomes are shown to the right of the arrow. In each case the strand inherited from the parent is shown with a thick line, and the thin lines show the newly synthesised strand, with the arrow indicating the direction of synthesis. Daughter chromosome 2 is seen to be identical to the parent; having inherited the longer strand from the parent, and synthesised the shorter strand. However, daughter chromosome 1 inherits the shorter strand of parent DNA, and synthesises an even shorter complementary strand, resulting in telomeres of lengths m, m-y, n-y and n-y
Fig. 2
Fig. 2
Numerical results obtained from (2.22) showing how, for Case A, the distribution of telomere lengths changes with generation number, g. The scaled distribution of telomere lengths 2-gKn(g) broadens and shortens in subsequent generations. Parameter values: Q=5950, y1=1/60, y0=50. Key: profiles are plotted at generations g=10 (narrow solid line), 40 (narrow dashed line), 70 (thick solid line),100 (thick dotted line)
Fig. 3
Fig. 3
Left: plot of the mean telomere length over 120 generations. The thicker solid line corresponds to the case Q=5950, y0=50, y1=1/60 illustrated in Fig. 2, the narrower solid line to the case y0=100, y1=0. In both cases, dotted lines show two standard deviations above and below the mean. Right: the proportion of dividing chromosomes ϕdiv (solid lines) decrease over time as the telomeres shorten, and ϕsen (dashed). For the case y1=0, y0=100, we observe the formation of senescent chromosomes around generation 100
Fig. 4
Fig. 4
Plots of the mean telomere length Qμ(τ) and population size ξ(τ) as defined by Eqs. (3.23) and (3.32) respectively against generation number g=τ/L for various choices of a,b,y0,y1. In both panels: the thick solid line corresponds to y0=50, y1=1/60, a=0.8/Q, b=0.2; the thick dashed line corresponds to y0=100, y1=0, a=0.8/Q, b=0.2; the narrow solid line corresponds to y0=50, y1=1/60, a=1/Q, b=0; and narrow dashed lines correspond to y0=50, y1=1/60, a=0, b=1
Fig. 5
Fig. 5
Illustration of the numerical solution of (3.15) in the case L=0.01, Q=5950, a=0.8/Q, b=0.2, y0=50, y1=1/60, plotted at τ=0 (cut off), 0.005, 0.01, 0.02, 0.05, 0.1, 0.2, 0.4, 0.6, 0.8, 1.0
Fig. 6
Fig. 6
Left: probability distribution function (pdf) for the Gaussian, N(0,1), (narrow line, given by (4.21), defined for all x), and that of the lowest order statistic of N=46 chromosomes (thicker line), given by (4.20). Right: similar plots for the log-normal distribution where logXN(μ,σ) with μ=0 (f=exp(-(logx-μ)2/2σ2)/xσ2π, which is only defined for x>0). The pdf (thin line) for the case σ=1 has a maximum near x=0.4 and the pdf of the first order statistic (4.20) has a maximum near x=0.1; the case σ=0.25 has a pdf with maximum just below x=1 and the first order statistic has a maximum around x=0.5
Fig. 7
Fig. 7
Left, thick lines show the pdf of telomere lengths Cm(g)/mCm(g) from (4.19), plotted against average telomere length m / N, at generations g=5, 20, 40, 60, 80,100, 120, for the case y0=100, y1=0. Narrow lines illustrate the pdf of the first order statistic (4.21) of N=46 chromosomes. Right, similar but for y0=50, y1=1/60 with Cm(g) given by (4.17). To allow comparison with Figs. 2 and 3, the horizontal axis has been scaled to show the average telomere length, that is, the total telomere length divided by the number of chromosomes (N=46)
Fig. 8
Fig. 8
Left: plots of mean telomere length against generation number for the case y0=100, y1=0 in dash-dotted line, with the dotted lines showing mean ± 2 s.d. The case y0=50, y1=1/60 is shown with a solid line, with mean ±2 s.d. shown by dashed lines. To allow comparison with Figs. 2 and 3, the vertical axis has been scaled to show the average telomere length, that is, the total telomere length divided by the number of chromosomes (N=46). Right: the proportion of dividing (ϕdiv) and senescent (ϕsen=1-ϕdiv) chromosomes/cells plotted against generation number, g. The dashed line corresponds to the chromosome level model with y0=50, y1=1/60; the dotted line corresponds to the chromosome level model with y0=100, y1=0; the solid line corresponds to the cell level model with y0=50, y1=1/60; the dash-dotted line corresponds to the cell level model with y0=100, y1=0
Fig. 9
Fig. 9
Left: plots of Dchromo (5.31) against generation number, g, for the case of y0=50, y1=1/60; the cases (a,b)=(0,1), (0.2 / Q, 0.8), (0.5 / Q, 0.5), (0.8 / Q, 0.2), (1 / Q, 0.0) are illustrated respectively by solid line, dashed line, dotted line, dashed line, dash-dotted line. Right: similar for, Dcell
Fig. 10
Fig. 10
Left: graph of mean telomere length against generation number; right, approximate standard deviation of telomere lengths plotted against generation number; for the same parameter values as used in Fig. 9

References

    1. Abramowitz M, Stegun I. Handbook of mathematical functions. New York: Dover; 1972.
    1. Allsopp RC, Harley C. Evidence for a critical telomere length in senescent human fibroblasts. Exp Cell Res. 1995;219:130–136. doi: 10.1006/excr.1995.1213. - DOI - PubMed
    1. Arino O, Kimmel M, Webb G. Mathematical modeling of the loss of telomere sequences. J Theor Biol. 1995;177:45–57. doi: 10.1006/jtbi.1995.0223. - DOI - PubMed
    1. Bodova K, Kollar R, Tomaska L, Nosek J. Mathematical model of telomere length maintenance in mitochondrial DNA of yeast. Biophys J. 2012;102:281A. doi: 10.1016/j.bpj.2011.11.1555. - DOI
    1. Buijs J, Bosch P, Muster M, Riel N. Mathematical modeling confirms the length-dependency of telomere shortening. Mech Ageing Dev. 2004;125:437–444. doi: 10.1016/j.mad.2004.03.007. - DOI - PubMed