. 2019 Nov 15;10(1):5183.
doi: 10.1038/s41467-019-13139-9.

A therapeutic antibody targeting osteoprotegerin attenuates severe experimental pulmonary arterial hypertension

Affiliations

A therapeutic antibody targeting osteoprotegerin attenuates severe experimental pulmonary arterial hypertension

Nadine D Arnold et al. Nat Commun. .

Abstract

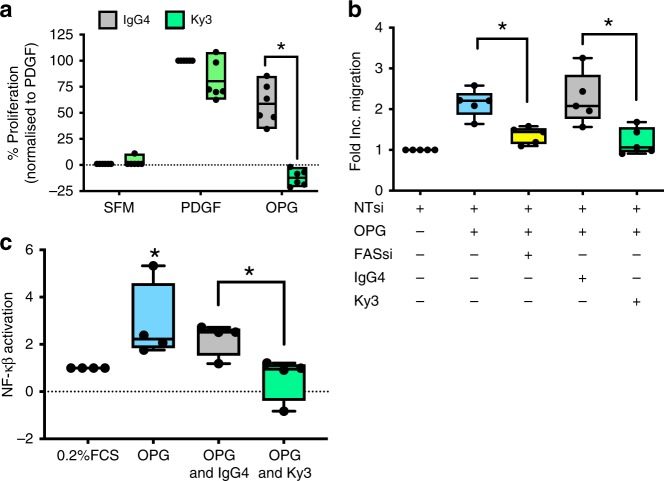
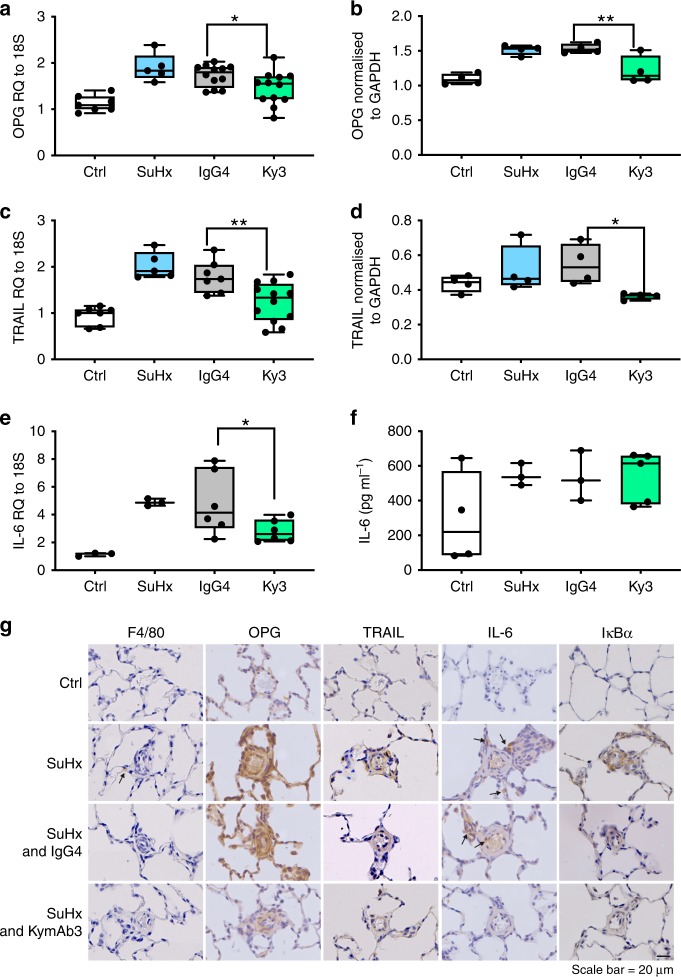
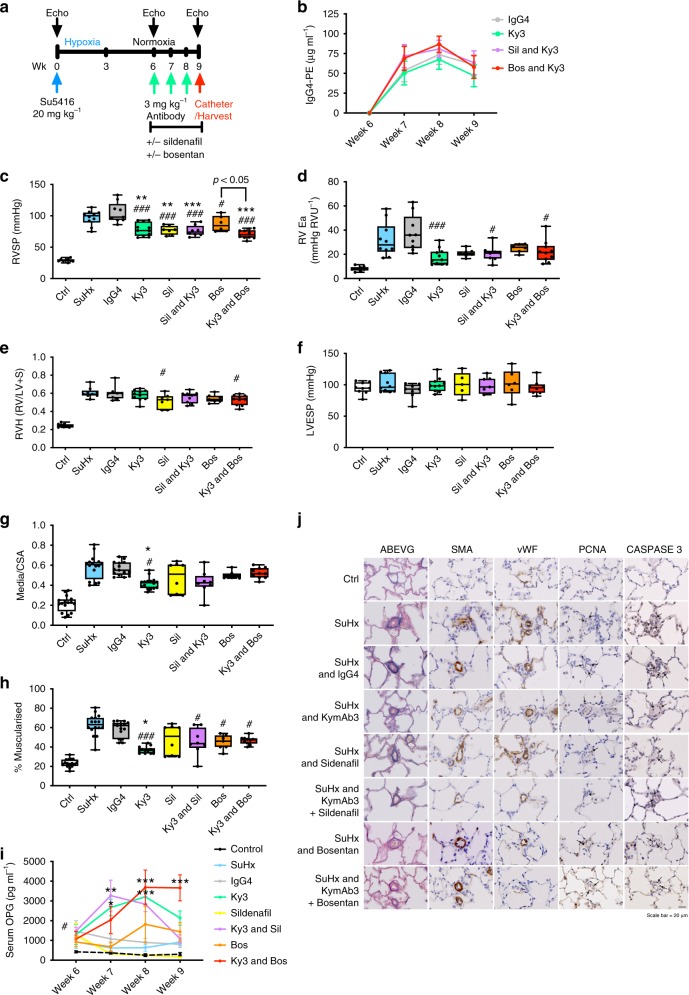
Pulmonary arterial hypertension (PAH) is a rare but fatal disease. Current treatments increase life expectancy but have limited impact on the progressive pulmonary vascular remodelling that drives PAH. Osteoprotegerin (OPG) is increased within serum and lesions of patients with idiopathic PAH and is a mitogen and migratory stimulus for pulmonary artery smooth muscle cells (PASMCs). Here, we report that the pro-proliferative and migratory phenotype in PASMCs stimulated with OPG is mediated via the Fas receptor and that treatment with a human antibody targeting OPG can attenuate pulmonary vascular remodelling associated with PAH in multiple rodent models of early and late treatment. We also demonstrate that the therapeutic efficacy of the anti-OPG antibody approach in the presence of standard of care vasodilator therapy is mediated by a reduction in pulmonary vascular remodelling. Targeting OPG with a therapeutic antibody is a potential treatment strategy in PAH.


Conflict of interest statement

A.L./The University of Sheffield has been granted intellectual property around the area of targeting OPG for the treatment of PAH (GB2510524 / US9334327 / JP2014532637) and is a founding Director of PH Therapeutics Ltd, a University of Sheffield Spin-out company. J.C., V.G., M.M. and P.B.-W. are employees of Kymab Ltd and hold share options in the company. Kymab has filed intellectual property (GB1701416.8) around the characteristics of a therapeutic human anti-osteoprotegerin antibody with A.L. named as an inventor. The remaining authors declare no competing interests.

Figures

Fig. 1
Fig. 1
Genetic deletion of OPG prevents and antibody treatment reverses PAH. Panels (af) are data obtained from high fat diet (HFD) fed OPG−/−, ApoE+/−, and ApoE+/−/OPG−/− mice to determine the requirement of OPG for the development of PAH. Panels (go) are data obtained high fat diet (HFD) fed ApoE−/− mice treated with IgG or OPG antibody to determine if OPG antibody treatment can reverse established PAH. Bar graphs (a, i) show right ventricular systolic pressure (RVSP), (b, j) left ventricular end-systolic pressure (LVESP), (c) left ventricular end-diastolic pressure, (d) cardiac index, (e&k) the degree of medial wall thickness as a ratio of total vessel size (Media/CSA), (f) representative photomicrographs of serial lung sections stained with Alcian Blue Elastic van Gieson (ABEVG) or immunostained for α-smooth muscle actin (α-SMA). Panel (g) demonstrates a schema from the therapeutic intervention with polyclonal mouse OPG antibody. (h) pulmonary artery acceleration time (PA AT). l Representative photomicrographs of serial lung sections from ApoE−/− mice fed on Paigen diet for 12 weeks. Sections were stained with ABEVG or α-SMA, proliferating cell nuclear antigen (PCNA) or Terminal deoxynucleotidyl transferase dUTP nick end labelling (TUNEL). Bar graphs show femoral trabecular bone volume (%) (m), trabecular thickness (mm) (n), trabecular number (mm−1) (o), bars represent mean with error bars showing the standard error of the mean. Box and Whisker plots represent the interquartile range (box) with the line representing the median and whisker the full range of the data, each animal is represented by a dot in each graph; panels (af) OPG−/− n = 3 per group, ApoE+/− n = 4 per group, ApoE+/−/OPG−/− n = 5 per group. * p < 0.05, ** p < 0.01, *** p < 0.001 compared to OPG−/− or chow-fed mice following a two-way ANOVA followed by Bonferroni’s multiple comparisons test, or were only two groups, unpaired t-tests. All images are presented at their original magnification ×400, scale bar represent 50 µm
Fig. 2
Fig. 2
Bone marrow cell derived OPG is required to initiate PAH in the mouse SuHx model. Bar graphs show (a) serum levels of OPG, (b) right ventricular systolic pressure (RVSP), (c) right ventricular hypertrophy (RVH), (d) left ventricular end-systolic pressure (LVESP), (e) the degree of medial wall thickness as a ratio of total vessel size (Media/CSA) in small pulmonary arteries pulmonary arteries less than 50 µm, (f) the relative percentage of muscularised pulmonary arteries less than 50 µm (<50 µm) in diameter. Representative photomicrographs (g) of serial lung sections from bone marrow-transplanted (BMT) mice. Sections were stained with Alcian Blue Elastic van Gieson (ABEVG), or immunostained for α-smooth muscle actin (α-SMA), von Willebrand factor (vWF), OPG, or TRAIL. Panel (h) shows OPG gene expression from RNA-seq performed on control and PAH-derived pulmonary artery smooth muscle cells (SMC), pulmonary artery fibroblasts (Fib) and fibrocytes obtained from the hypoxic neonatal calf model of PAH. Representative photomicrographs of lung sections from the hypoxic neonatal calf stained with OPG (i). Proliferation of blood outgrowth endothelial cells (BOEC) from patients with IPAH and healthy controls (j). Box and Whisker plots represent the interquartile range (box) with the line representing the median and whisker the full range of the data, each animal is represented by a dot in each graph. C57-C57 BMT n = 6 for each group, OPG−/–OPG−/− n = 3 for each group, C57-OPG−/− n = 3 and OPG−/−-C57 n = 5 for each group. * p < 0.05, ** p < 0.01,*** p < 0.001 compared to C57-C57 BMT Normoxic mice unless otherwise stated, # p < 0.05, ## p < 0.01 compared to C57–C57 SuHx mice following one-way ANOVA with Bonferroni’s multiple comparisons post hoc test. All images are presented at their original magnification x400, scale bars represent 50 µm
Fig. 3
Fig. 3
OPG activates pro-proliferative signalling and a disease-relevant transcriptome. Panel (a) Signalling Pathway Impact Analysis (SPIA) with each pathway represented by one dot. The pathways to the right of the red diagonal line are significant after Bonferroni correction of the global p-values obtained using Fisher’s methods from the combination of pPERT and pNDE values, the pathways to the right of the blue line are significant after FDR correction. (b) shows a heat map of significant differentially regulated genes after gene enrichment against PAH-associated genes in OPG stimulated PASMCs, (c) TaqMan validation of gene expression microarray, TaqMan expression data normalised using ΔΔCT with 18 s rRNA as the endogenous control gene. Panel (d) shows a heat map of cell cycle/CDK proteins significantly regulated by OPG at 10 and 60 min expressed as a ratio to unstimulated controls from the same time point from Kinex phospho-arrays identified, with (e) showing those specifically related to NF-κβ. f Western blot validation of Kinex array data in unstimulated (0.2% FCS, Un) or OPG-stimulated (50 ng ml−1) PASMCs at 10 min (10) and 60 min (60) with relative band densities of phospho-ERK1/2, phospho-HSP27, phospho-mTOR, phospho-CDK4 and total CDK5 are shown by the bar graphs and representative western blot images shown above the graph. Heat maps show Z-ratio gene or protein expression. Bars represent mean with error bars showing the standard error of the mean, n = 3 for pooled triplicate samples (a, b), n = 12 (c), n = 4 (d, e), n = 5 (f) from three donors of PASMCs, dots represent experimental repeats. Bars from unstimulated cells are white, OPG stimulated blue. *p < 0.05, ** p < 0.01, *** p < 0.001 compared OPG-stimulated to unstimulated PASMCs using one-way ANOVA followed by Bonferroni’s multiple comparisons post hoc test. When there were only two groups, unpaired t-tests were used
Fig. 4
Fig. 4
OPG binds to Fas, which is increased in IPAH lung and right ventricle. Panel (a) demonstrates confirmed protein binding between OPG and syndecan-1 (SDC-1), RANKL (TNFSF11), Growth Associated Protein 43 (GAP43), Fas, IL1-receptor accessory protein (IL-1RAcP) and transmembrane protease, serine 11D. b TaqMan expression of Fas, IL-1RAcP and GAP43 in control (white bars, 0.2% FCS) and OPG-stimulated (blue bars, 50 ng ml−1) purchased PASMCs, and (c) PASMCs from patients with IPAH (grey bars) and healthy controls (white bars). d Anti-Fas co-immunoprecipitation of OPG in endogenous primary human PASMC lysates or recombinant protein replicated 3 times. e OPG and Fas are expressed within remodelled pulmonary arteries and the right ventricle of patients with IPAH. TaqMan expression of Fas in whole lung RNA (f) and protein expression in lung sections (g) isolated from control (saline), monocrotaline (d28), control (normoxia) and SuHx (wk9) rats. TaqMan expression data normalised using ΔΔCT with 18 s rRNA as the endogenous control gene. Bars represent the mean with error bars showing the standard error of the mean. Panel (c) n = 4 and panel (d) n = 3 from three individual donors, dots represent experimental repeats. * p < 0.05, ** p < 0.01, *** p < 0.001 following one-way ANOVA with Bonferroni’s multiple comparisons post hoc test. When there were only two groups, unpaired t-tests were used. Scale bar represents 25 µm
Fig. 5
Fig. 5
OPG-Fas interaction mediates the OPG-induced phenotypic response of PASMC. TaqMan expression of (a) VEGFA, (b) PDGFRA, (c) TNC, (d) Cav1 and (e) TRAIL in response to OPG in the presence (hash bars) or absence (Grey bars) of anti-Fas neutralising antibody (1500 ng ml−1). Panel (f) demonstrates OPG inhibition of FasL and TRAIL-induced apoptosis in HT1080 cells. g PASMC migration following 6 h stimulation with PDGF (20 ng ml−1), OPG (30 ng ml−1) or 0.2% FCS (serum-free media, SFM), in the presence or absence of Fas neutralising antibody. h Proliferation of PASMCs following stimulation with OPG for 72 h in the presence or absence of Fas neutralising antibody and/or TRAIL neutralising antibody (0.5 nM). Proliferation expressed as a percentage of proliferation to PDGF. Bars represent the mean with error bars showing the standard error of the mean. Dots represent experimental repeats, Panels (ae) (n = 4), panel (f) (n = 3), panel (g) (n = 4), panel (h) (n = 4 for SFM, 10 for PDGF & OPG stimulations) * p < 0.05, ** p < 0.01, *** p < 0.001, **** p < 0.0001 following one-way ANOVA with Bonferroni’s multiple comparisons post hoc test
Fig. 6
Fig. 6
Human anti-OPG antibody attenuates monocrotaline-induced PAH in rats. Panel (a) shows the schema for disease initiation and treatment time course. b Plasma concentrations of antibody and IgG. Bar graphs show (c) right ventricular systolic pressure (RVSP), (d) right ventricular hypertrophy (RVH), (e) estimated pulmonary vascular resistance (ePVRi), (f) left ventricular end-systolic pressure (LVESP), (g) the degree of medial wall thickness as a ratio of total vessel size (Media/CSA), (h) relative percentage of muscularised small pulmonary arteries and arterioles in <50 µm vessels. Panel (i) shows representative photomicrographs of serial lung sections. Sections were immunostained for α-smooth muscle actin (α-SMA), or von Willebrand factor (vWF). Panel (j) shows the circulating plasma levels of OPG. Box and Whisker plots represent the interquartile range (box) with the line representing the median and whisker the full range of the data, each animal is represented by a dot. Ctrl boxes (white, n = 4), Mct (blue n = 5), AF459 (purple, n = 6), IgG (grey, n = 8), Ky1 (yellow, n = 8), Ky2 (orange, n = 7), Ky3 (green, n = 8) and Ky4 (red, n = 7). * p < 0.05, ** p < 0.01, *** p < 0.001 compared to IgG treated rats following one-way ANOVA followed by Bonferroni’s multiple comparisons test. All images are presented at their original magnification ×400, scale bar represents 100 µm
Fig. 7
Fig. 7
Ky3 blocks OPG-induced proliferation, migration and NF-κβ activation. Box and whisker plots shows the inhibition of OPG-induced proliferation (a) and migration (b) in PASMC stimulated with serum-free media (SFM), PDGF or OPG in the presence of either IgG4 (grey) or Ky3 antibody (green), Fas siRNA (yellow) or non-targeting siRNA (NTsi) (white). Bar graph shows the mean with the error bars showing the standard error o the mean with (c) showing the activation of NF-κβ in response to OPG (blue) in the presence of either IgG4 (grey) or Ky3 antibody (green). Box and Whisker plots represent the interquartile range (box) with the line representing the median and whisker the full range of the data, each dot represents an experimental repeat, n = 6 (a), n = 5 (b) and n = 4 (c), * p < 0.05 following two-way ANOVA followed by Sidak’s multiple comparisons test (a), or one-way ANOVA with Bonferroni’s multiple comparisons post hoc test (b&c)
Fig. 8
Fig. 8
Therapeutic delivery of Ky3 attenuates development of established severe SuHx PAH. Panel (a) shows the schema for disease initiation and treatment time course. b Plasma concentrations of antibody and IgG. Bar graphs show (c) Pulmonary Artery Acceleration Time (PA AT), (d) cardiac output, (e) right ventricular systolic pressure (RVSP), (f) right ventricular arterial elastance (RV Ea), (g) estimated pulmonary vascular resistance (ePVRi), (h) right ventricular hypertrophy (RVH), (i) left ventricular end-systolic pressure (LVESP). Bar graphs (j) show the degree of medial wall thickness as a ratio of total vessel size (Media/CSA) and (k) the relative percentage of muscularised small pulmonary arteries and arterioles in < 50 µm vessels. Panel (l) shows representative photomicrographs of serial lung sections. Sections were stained for Alcian Blue Elastic van Gieson (ABEVG), immunostained for α-smooth muscle actin (α-SMA), or von Willebrand factor (vWF), proliferating cell nuclear antigen (PCNA) or cleaved Caspase 3. Panel (m) shows the circulating level of OPG and quantification of femoral trabecular bone volume (%) (n), trabecular thickness (mm) (o), trabecular number (mm−1) (p). Box and Whisker plots represent the interquartile range (box) with the line representing the median and whisker the full range of the data, each animal is represented by a dot, white boxes represent control (n = 8), blue (SuHx, n = 8), yellow (Sildenafil treated, n = 7), grey (IgG4 treated, n = 8) and green (Ky3 treated, n = 8) rats. * p < 0.05, ** p < 0.01, *** p < 0.001 compared to IgG treated rats following one-way ANOVA with Tukey’s multiple comparisons post hoc test. All images are presented at their original magnification ×400, scale bar represents 20 µm
Fig. 9
Fig. 9
Ky3 reduces tissue expression of IL-6, OPG and TRAIL. Boxplots demonstrate a significant reduction in whole lung expression of OPG RNA (a), OPG Protein (b), TRAIL RNA (c), TRAIL protein (d) and IL-6 RNA (e) and plasma protein (f). Panel (g) shows representative photomicrographs of serial lung sections. Sections were stained for macrophages (F4/80), OPG, TRAIL, IL-6 and Iκβα. Box and Whisker plots represent the interquartile range (box) with the line representing the median and whisker the full range of the data, each animal is represented by a dot (Ctrl (white) n = 7, SuHx (blue) n = 5, IgG (grey) n = 7 & Ky3 (green) n = 12 animals per group). * p < 0.05, ** p < 0.01, compared to IgG treated rats using one-way ANOVA followed by Sidak’s multiple comparisons test. All images are presented at their original magnification ×400, scale bar represents 20 µm
Fig. 10
Fig. 10
Ky3 and standard of care vasodilator therapy combination attenuates severe PAH. Panel (a) shows the schema for disease initiation and treatment time course. b Plasma concentrations of antibody and IgG. Boxplots show (c) right ventricular systolic pressure (RVSP), (d) right ventricular arterial elastance (RV Ea), (e) right ventricular hypertrophy (RVH), (f) left ventricular end-systolic pressure (LVESP), (g) degree of medial wall thickness as a ratio of total vessel size (Media/CSA) and (h) the relative percentage of muscularised small pulmonary arteries and arterioles in < 50 µm vessels. Graph (i) shows the circulating level of OPG, and panel (j) shows representative photomicrographs of serial lung sections. Sections were stained for Alcian Blue Elastic van Gieson (ABEVG), immunostained for α-smooth muscle actin (α-SMA), or von Willebrand factor (vWF), proliferating cell nuclear antigen (PCNA) or cleaved Caspase 3. Box and Whisker plots represent the interquartile range (box) with the line representing the median and whisker the full range of the data, each animal is represented by a dot, white boxes represent control (n = 9), blue (SuHx, n = 10), grey (IgG4 treated, n = 9) and green (Ky3 treated, n = 11), yellow (sildenafil treated, n = 7), purple (sildenafil & Ky3 treated, n = 8), orange (bosentan treated, n = 6) and red (bosentan & Ky3 treated, n = 10) rats. # p < 0.05, ## p < 0.01, ### p < 0.001 compared to IgG, *p < 0.05, ** p < 0.01, *** p < 0.001 compared to SuHx treated rats using one-way ANOVA followed by Sidak’s multiple comparisons test. All images are presented at their original magnification ×400, scale bar represents 20 µm

References

    1. Hoeper MM, et al. Definitions and diagnosis of pulmonary hypertension. J. Am. Coll. Cardiol. 2013;62:D42–D50. doi: 10.1016/j.jacc.2013.10.032. - DOI - PubMed
    1. Tuder RM, et al. Relevant issues in the pathology and pathobiology of pulmonary hypertension. J. Am. Coll. Cardiol. 2013;62:D4–D12. doi: 10.1016/j.jacc.2013.10.025. - DOI - PMC - PubMed
    1. Schermuly RT, Ghofrani HA, Wilkins MR, Grimminger F. Mechanisms of disease: pulmonary arterial hypertension. Nat. Rev. Cardiol. 2011;8:443–455. doi: 10.1038/nrcardio.2011.87. - DOI - PMC - PubMed
    1. Rabinovitch M. Molecular pathogenesis of pulmonary arterial hypertension. J. Clin. Invest. 2008;118:2372–2379. doi: 10.1172/JCI33452. - DOI - PMC - PubMed
    1. Thompson AAR, Lawrie A. Targeting vascular remodeling to treat pulmonary arterial hypertension. Trends Mol. Med. 2017;23:31–45. doi: 10.1016/j.molmed.2016.11.005. - DOI - PubMed

Publication types

MeSH terms