. 2019 Nov 15;10(1):5176.
doi: 10.1038/s41467-019-13150-0.

Toll-like receptor 2 expression on c-kit+ cells tracks the emergence of embryonic definitive hematopoietic progenitors

Affiliations

Toll-like receptor 2 expression on c-kit+ cells tracks the emergence of embryonic definitive hematopoietic progenitors

Jana Balounová et al. Nat Commun. .

Abstract

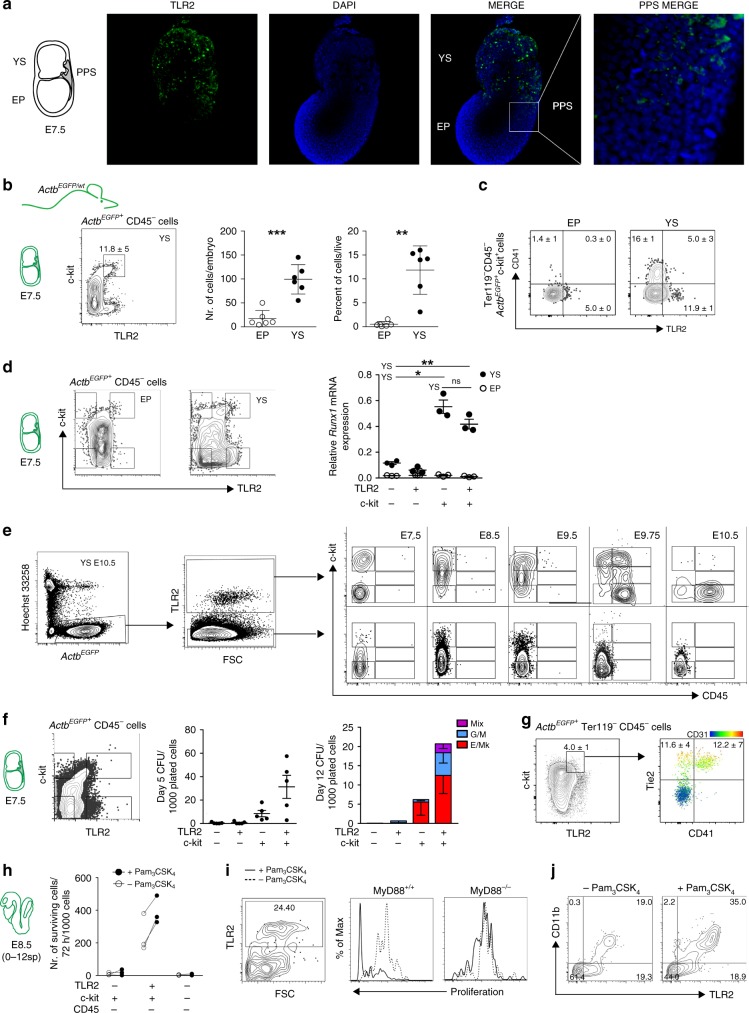
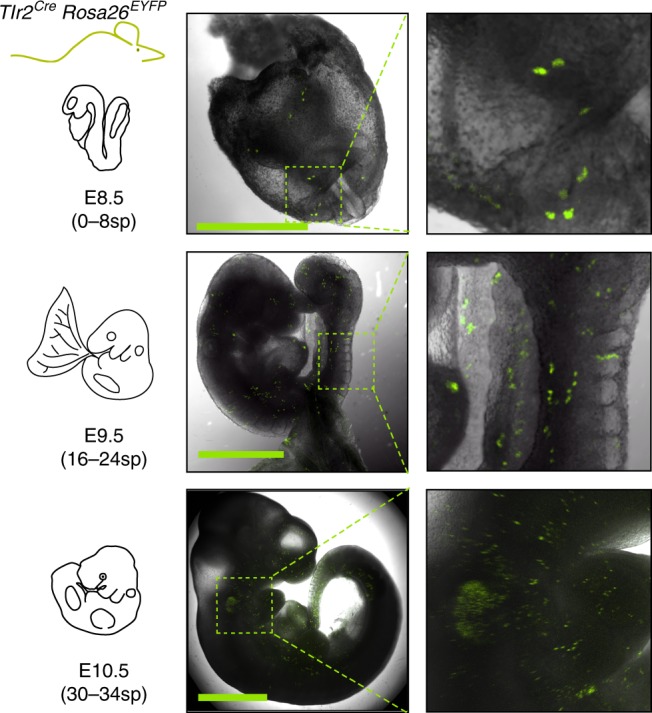
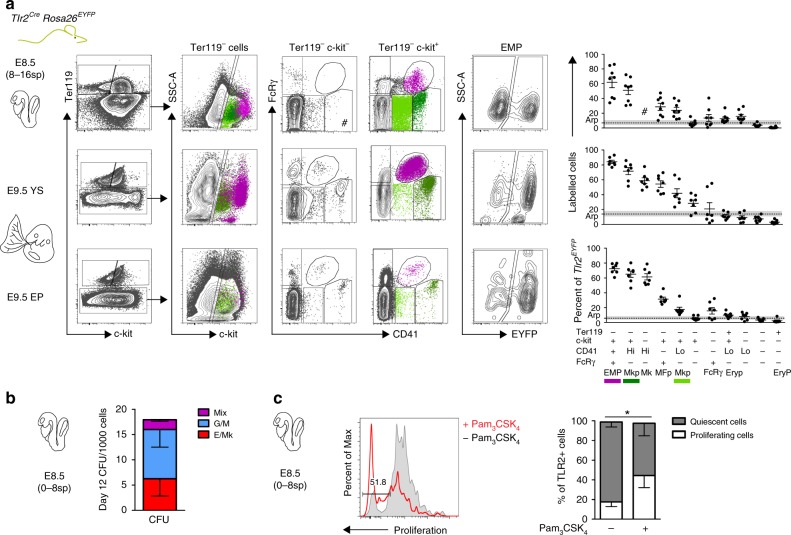
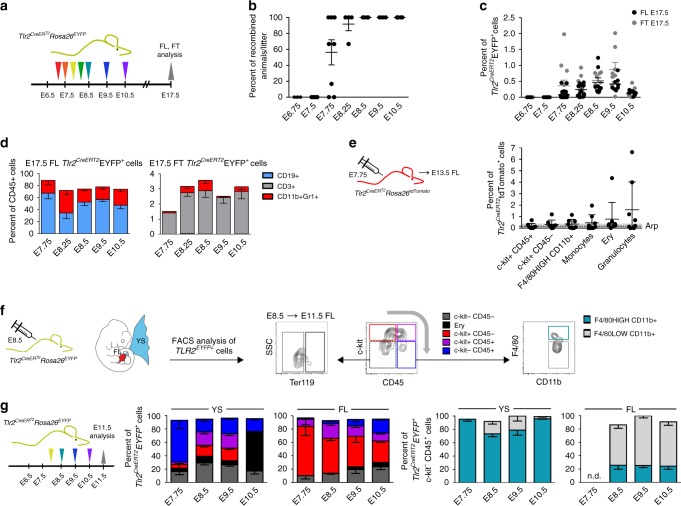
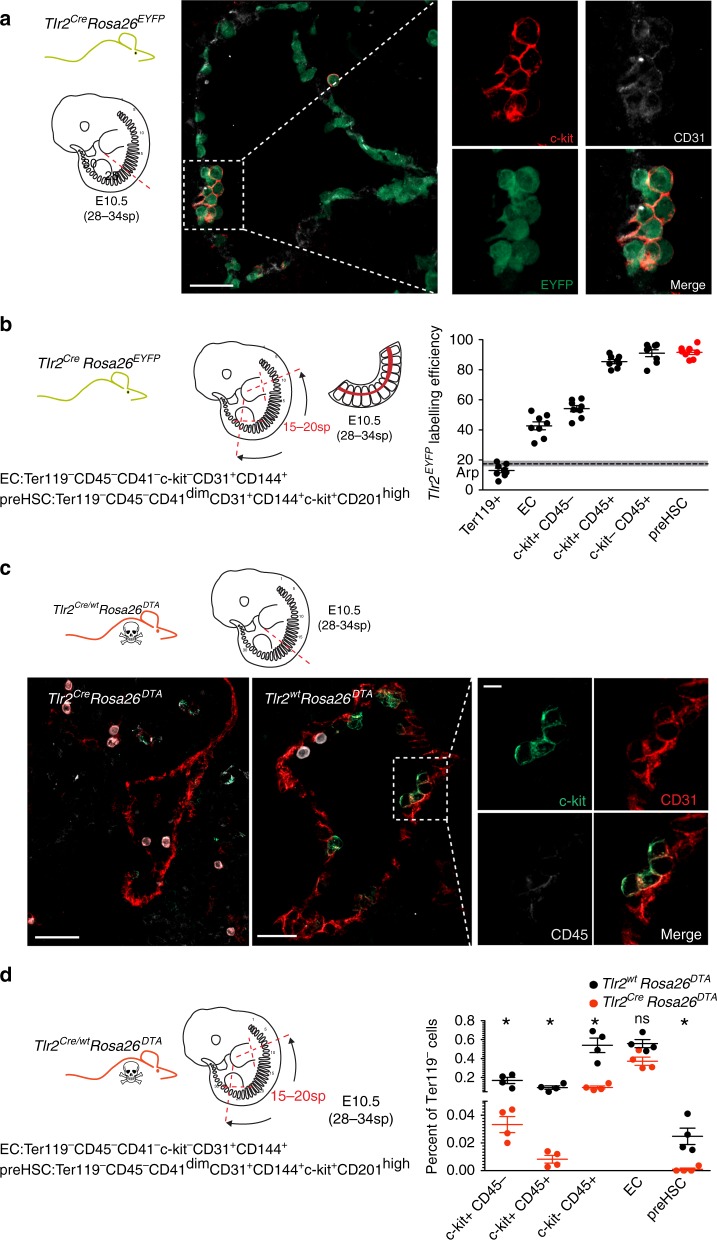
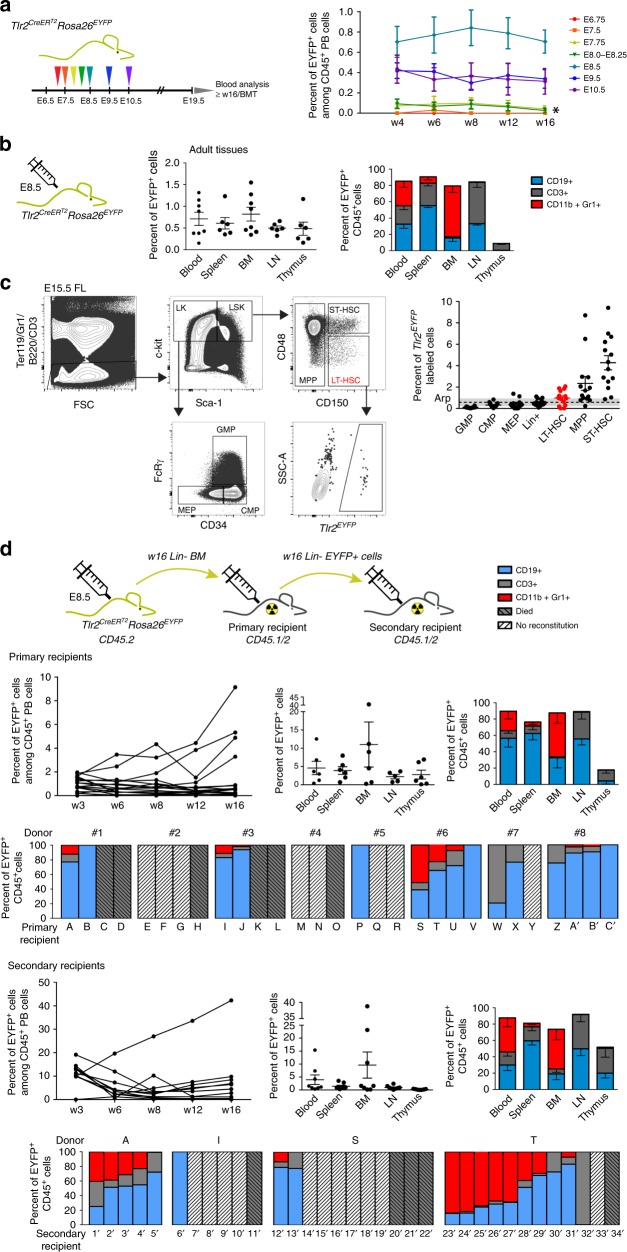
Hematopoiesis in mammalian embryos proceeds through three successive waves of hematopoietic progenitors. Since their emergence spatially and temporally overlap and phenotypic markers are often shared, the specifics regarding their origin, development, lineage restriction and mutual relationships have not been fully determined. The identification of wave-specific markers would aid to resolve these uncertainties. Here, we show that toll-like receptors (TLRs) are expressed during early mouse embryogenesis. We provide phenotypic and functional evidence that the expression of TLR2 on E7.5 c-kit+ cells marks the emergence of precursors of erythro-myeloid progenitors (EMPs) and provides resolution for separate tracking of EMPs from primitive progenitors. Using in vivo fate mapping, we show that at E8.5 the Tlr2 locus is already active in emerging EMPs and in progenitors of adult hematopoietic stem cells (HSC). Together, this data demonstrates that the activation of the Tlr2 locus tracks the earliest events in the process of EMP and HSC specification.


Conflict of interest statement

The authors declare no competing interests.

Figures

Fig. 1
Fig. 1
Early YS-derived TLR2+ c-kit+ cells exhibit features of EMP precursors. a Immunofluorescence of E7.5 embryos revealed the presence of TLR2+ cells (green) predominantly in YS. Weaker TLR2 staining was also detected in PPS (white insert). Nuclei were stained with DAPI (blue). YS yolk sac, EP embryo proper, PPS posterior primitive streak. A representative image is shown (n = 2 independent experiments with at least four embryos per experiment). bj ActbEGFP/wt embryos (see Supplementary Fig. 1b) were used to analyze cells of embryonic origin. b Quantification of ActbEGFP+CD45c-kit+TLR2+ cells in E7.5 EP and YS (mean ± SD; n = 6; **p ≤ 0.01, ***p ≤ 0.001; paired, two-tailed t test). c Surface co-expression of TLR2 with CD41 determined on E7.5 ActbEGFP+CD45c-kit+ cells obtained from EP or YS. d Runx1 mRNA expression normalized to Gapdh levels in four sorted subsets of E7.5 embryonic ActbEGFP+CD45 cells with combinatorial expression of c-kit and TLR2 (mean ± SD; n = 3; *p ≤ 0.05, **p ≤ 0.01; paired, two-tailed t test). e E7.5- E10.5 YS ActbEGFP+ cells of either TLR2+ or TLR2 phenotype were analyzed for the expression of c-kit and CD45 by FCM. f E7.5 ActbEGFP+Lin cells (Lin = CD3Gr-1CD11bB220Ter119) were sorted based on their c-kit and TLR2 expression (see sorting strategy in Supplementary Fig. 2a), plated in a methylcellulose medium M3434 (StemCell Technologies) and assessed for their CFU potential (mean ± SEM; n = 5). g YS-derived E7.5 ActbEGFP+Ter119CD45c-kit+TLR2+ cells were analyzed for Tie2, CD41, and CD31 expression. See full gating strategy in Supplementary Fig. 2c. hj Sorted E8.5 ActbEGFP+ cells were plated on OP-9 stromal cells in the presence or absence of the TLR2 agonist Pam3CSK4 (1 μg/ml) and analyzed by FCM after 72 h (n = 3). h Survival analysis of sorted E8.5 TLR2+/–c-kit+/–CD45cells. i The proliferation history of E8.5 TLR2+c-kit+CD45 cells sorted from MyD88+/+ or MyD88–/– embryos was assessed by the dilution of a proliferation dye in TLR2+ cells (see also Supplementary Fig. 2d). j ActbEGFP+ cells recovered from cultures of ActbEGFP+TLR2+ c-kit+ CD45 cells stimulated, or unstimulated, with Pam3CSK4 were analyzed for CD11b and TLR2 expression. Source data are provided as a Source Data file
Fig. 2
Fig. 2
Lineage tracing shows early activation of Tlr2 locus in hematopoietic progenitors. Spatial microscopic analysis of E8.5–E10.5 Tlr2CreEYFP+ cells; scale bar = 1 mm. Representative image is shown (n = 3 independent experiments with 3–6 embryos per experiment)
Fig. 3
Fig. 3
Lineage tracing shows activation of Tlr2 locus predominantly in EMPs. a Embryonic hematopoietic precursors were analyzed by FCM for frequency of labeling in E8.5 and E9.5 Tlr2CreRosa26EYFP embryos (mean ± SEM; n = 7–9; arp, average recombination probability is equal to mean ± SEM (gray zone) labeling efficiency of all live cells; EMP, erythro-myeloid progenitor; Mkp, megakaryocyte progenitor; Mk, megakaryocyte; MFp, macrophage progenitor; FcRγ, FcRγ+ cells; Eryp, Ery progenitor; EryP, primitive erythrocyte; # insufficient cell count for statistical analysis). b Sorted E8.5 Tlr2CreEYFP+Lin cells (see Supplementary Fig. 4g) were plated in a methylcellulose medium and assessed for their differentiation potential at day 12 of culture (mean ± SEM; n = 8). c The proliferation history of sorted Tlr2CreEYFP+Lin cells cultured in the presence (red open histogram) or absence (gray closed histogram) of Pam3CSK4 (1 µg/ml) on ST-2 stroma was assessed by the dilution of proliferation dye in TLR2+ cells after 72 h (mean ± SEM; n = 3; *p < 0.05; paired, one-tailed t test). Source data are provided as a Source Data file
Fig. 4
Fig. 4
At E7.75, Tlr2-labeled progenitors contribute to embryonic and fetal hematopoiesis. a Experimental design of the fate mapping of cells with an active Tlr2 locus. b The percentage of EYFP+ embryos among all Tlr2CreERT2Rosa26EYFP embryos in the same litter pulsed with one dose of 4-OHT from E6.75 to E10.5 was analyzed at E17.5 by FCM (mean ± SEM; n = 3–8 litters). c Percentage of Tlr2CreERT2EYFP+ cells in E17.5 fetal liver (FL, black dots) and E17.5 fetal thymus (FT, gray dots) in embryos described in (b); (mean ± SEM; n = 6–21 embryos). d The hematopoietic fate of Tlr2CreERT2EYFP+ cells pulsed with one dose of 4-OHT from E7.75 to E10.5 was determined in E17.5 FL and FT by FCM; (mean ± SEM; n = 4–8). e Labeling of hematopoietic populations (including granulocytes and monocytes) was determined in E13.5 FL of Tlr2CreERT2Rosa26tdTomato embryos pulsed with a single dose of 4-OHT at E7.75 (mean ± SEM; n = 8; arp = average recombination probability assessed in Ter119c-kitCD45 cells. f Gating strategy to identify the contribution of Tlr2CreERT2EYFP+ cells to indicated hematopoietic populations in E11.5 YS and FL. g Fate tracing of E11.5 Tlr2CreERT2EYFP+ cells pulsed with one dose of 4-OHT from E7.75 to E10.5 (mean ± SEM; n = 5–15) was analyzed by FCM according to (f). Source data are provided as a Source Data file
Fig. 5
Fig. 5
Tlr2-driven production of DTA efficiently deletes hematopoietic cells in E11.5 embryos. a Representative images of E11.5 Tlr2wtRosa26DTA and Tlr2CreRosa26DTA embryos (n = 4 independent experiments with 3–8 embryos of each genotype per experiment). FCM analysis (a) and its quantification (b) of TLR2+, c-kit+CD45, c-kit+CD45+, and c-kitCD45+ cell subsets in the YS, FL, caudal part, and head of dissected E11.5 Tlr2wtRosa26DTA (upper panel) and Tlr2CreRosa26DTA (lower panel) embryos (mean ± SEM; n = 4–5; ****p ≤ 0.0001, *p < 0.05; paired, two-tailed t test). Scale bar = 1 mm. Source data are provided as a Source Data file
Fig. 6
Fig. 6
E10.5 aortic pre-HSC activate their Tlr2 locus. a Cryosections of E10.5 (28–34sp) dorsal aortae with intra-aortic hematopoietic clusters (IAHCs) were analyzed from Tlr2CreRosa26EYFP embryos by staining for EYFP (green), c-kit (red) and CD31 (white). A representative image is shown (n = 5 independent experiments with 1–2 embryos per experiment). b Aortic regions were dissected from E10.5 Tlr2CreRosa26EYFP embryos (28–34sp), and hematopoietic populations as well as endothelial cells were analyzed for their labeling efficiency by FCM. The gating strategy for each indicated subset adopted from ref., is shown in Supplementary Fig 7a. c Sections of E10.5 (28–34sp) aortae were taken from Tlr2CreRosa26DTA (left panel) and Tlr2wtRosa26DTA (middle and right panels) embryos and stained for c-kit (green), CD31 (red), and CD45 (white) to identify IAHCs. Scale bar represents 50 µm. A representative image is shown (n = 5 independent experiments with 1–2 embryos of each genotype per experiment). d Aortic regions were disected from E10.5 Tlr2wtRosa26DTA (black dots) and Tlr2CreRosa26DTA (red dots) embryos (28–34sp). Hematopoietic populations as well as endothelial cells were analyzed for their frequencies by FCM (mean ± SEM; n = 4; *p < 0.05; paired, two-tailed t test). Gating strategy is shown in Supplementary Fig. 7b. Source data are provided as a Source Data file
Fig. 7
Fig. 7
Progenitors with active Tlr2 locus labeled at E8.5 contribute to adult hematopoiesis. a Tlr2CreERT2Rosa26EYFP embryos pulsed with a single dose of 4-OHT between E6.75-E10.5 were monitored postpartum for the presence of Tlr2CreERT2EYFP+ cells in their peripheral blood (PB) up to 16 weeks of age (mean ± SEM; n = 9–25; * indicates short-term hematopoietic potential which persisted for only the first 4 weeks of life. b Percentage of Tlr2CreERT2EYFP+ cells, labeled at E8.5, and their contribution to the main CD45+ lineages in different hematopoietic organs is shown (mean ± SEM; n = 5–7; see gating strategy in Supplementary Fig. 8a). c Tlr2CreERT2Rosa26EYFP embryos were pulsed with a single dose of 4-OHT at E8.5, and labeling efficiency of indicated hematopoietic populations was analyzed in E15.5 FL by FCM. LT-HSC gate is shown as an example. d Tlr2CreERT2Rosa26EYFP embryos were pulsed with a single dose of 4-OHT at E8.5. At 16 weeks of age, Lin-depleted BM (CD45.2) (w16 Lin BM; see Supplementary Fig. 8b) was transferred to lethally irradiated primary recipients (CD45.1/2) along with support BM cells (0.5 × 106 CD45.1), and the level of Tlr2CreERT2EYFP+ cells was monitored in PB of primary recipients until week 16 (upper left panel). The percentage of Tlr2CreERT2EYFP+ cells, their organ distribution and fate in primary recipients is shown (mean ± SEM; n = 6). Bar graphs show the reconstitution success and fate of Tlr2CreERT2EYFP+ cells in primary recipients (A–C’) of BM from eight individual donors (#1–8). Sorted Tlr2CreERT2EYFP+ cells (see Supplementary Fig. 8c) from Lin-depleted BM of 16-week old primary recipients were transferred to secondary, lethally irradiated recipients (CD45.1/2) along with support BM cells (0.5 × 106, CD45.1) and the frequency of Tlr2CreERT2EYFP+ cells in PB was monitored until week 16 (the outcome of BMT from one primary recipient (donor T) is shown (secondary recipients, upper row, left panel). The percentage of Tlr2CreERT2EYFP+ cells, their organ distribution and fate in secondary recipients is shown (mean ± SEM; n = 8). Bar graphs on the bottom indicate the reconstitution success and fate of Tlr2CreERT2EYFP+ cells in secondary recipients (1´−34´) of BM from four primary recipients. Source data are provided as a Source Data file

References

    1. Tober J, et al. The megakaryocyte lineage originates from hemangioblast precursors and is an integral component both of primitive and of definitive hematopoiesis. Blood. 2007;109:1433–1441. doi: 10.1182/blood-2006-06-031898. - DOI - PMC - PubMed
    1. Xu M-j, et al. Evidence for the presence of murine primitive megakarycytopoiesis in the early yolk sac. Blood. 2001;97:2016–2022. doi: 10.1182/blood.V97.7.2016. - DOI - PubMed
    1. Ferkowicz MJ, et al. CD41 expression defines the onset of primitive and definitive hematopoiesis in the murine embryo. Development. 2003;130:4393–4403. doi: 10.1242/dev.00632. - DOI - PubMed
    1. Palis J, Robertson S, Kennedy M, Wall C, Keller G. Development of erythroid and myeloid progenitors in the yolk sac and embryo proper of the mouse. Development. 1999;126:5073–5084. - PubMed
    1. Bertrand JY, et al. Three pathways to mature macrophages in the early mouse yolk sac. Blood. 2005;106:3004–3011. doi: 10.1182/blood-2005-02-0461. - DOI - PubMed

Publication types

Substances