. 2019 Nov 15;10(1):5172.
doi: 10.1038/s41467-019-13120-6.

Stroke among cancer patients

Affiliations

Stroke among cancer patients

Nicholas G Zaorsky et al. Nat Commun. .

Abstract

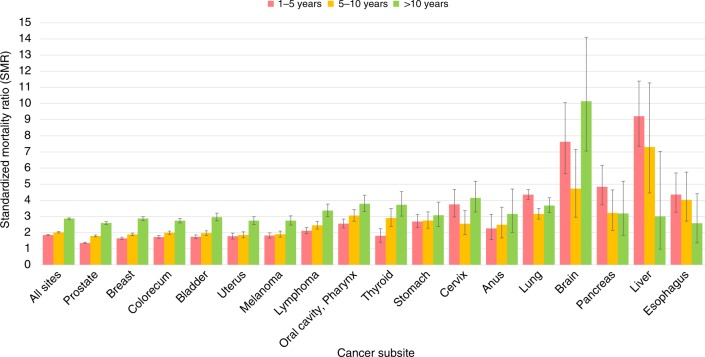
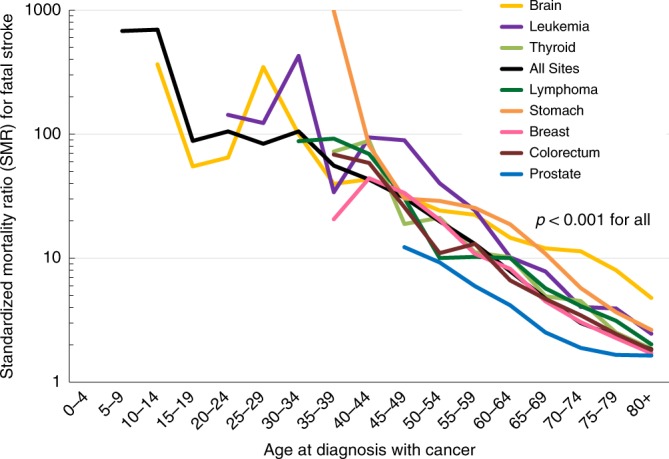
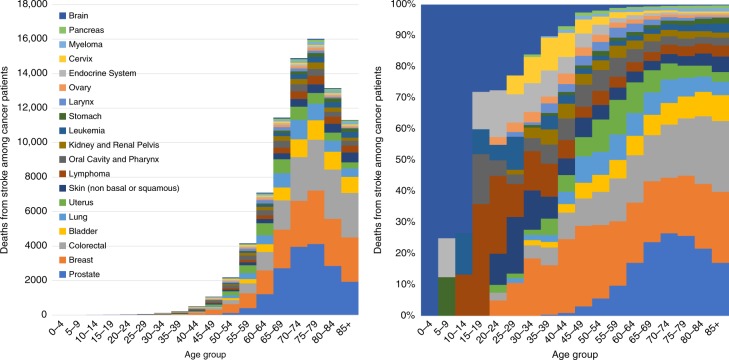
We identify cancer patients at highest risk of fatal stroke. This is a population-based study using nationally representative data from the Surveillance, Epidemiology, and End Results program, 1992-2015. Among 7,529,481 cancer patients, 80,513 died of fatal stroke (with 262,461 person-years at risk); the rate of fatal stroke was 21.64 per 100,000-person years, and the standardized mortality ratio (SMR) of fatal stroke was 2.17 (95% CI, 2.15, 2.19). Patients with cancer of the prostate, breast, and colorectum contribute to the plurality of cancer patients dying of fatal stroke. Brain and gastrointestinal cancer patients had the highest SMRs (>2-5) through the follow up period. Among those diagnosed at <40 years of age, the plurality of strokes occurs in patients treated for brain tumors and lymphomas; if >40, from cancers of the prostate, breast, and colorectum. For almost all cancers survivors, the risk of stroke increases with time.


Conflict of interest statement

The authors declare no competing interests.

Figures

Fig. 1
Fig. 1
Standardized mortality ratios (SMRs) of fatal stroke among cancer patients by subsite. The y-axis depicts the SMR with 95% CI, and the x-axis depicts the disease site. Different time periods after diagnosis (<1 year vs 5–10 years vs >10 years) are shown in different colors. The risk of stroke among cancer patients is two times that of the general population and rises with longer follow-up time. Certain cancer patients have relatively high SMR from stroke in the first year after diagnosis (e.g., brain, with SMR 7). Error bars represent 95% CI by subsite. Source data are provided as a Source Data file
Fig. 2
Fig. 2
Standardized mortality ratios (SMRs) of fatal stroke as a function of age of diagnosis. The y-axis depicts the SMR, and the x-axis depicts the age at diagnosis with cancer. SMRs compare the risk of death from stroke among a cancer subsite vs the general population, adjusted sex and race, within a particular age subgroup. Cancers are shown in different colors; for the purposes of this figure, key cancers were selected because of their high incidence and prevalence overall (e.g., prostate, breast, colorectum) and because of their relatively high incidence in pediatric populations (e.g., brain, leukemia); this was done so that SMRs between adult and pediatric populations may be juxtaposed. For pediatric patients, the population is enriched with brain tumors, and these contribute to the majority of person-years at risk. Children diagnosed with brain tumors are at an exceedingly high risk to die of stroke for the remainder of their life (SMRs > 100, p-values < 0.001). Adolescents and young adults who are diagnosed with leukemia are similarly at a high risk of death from fatal stroke (SMRs > 100, p-values < 0.001). Since most cancers are diagnosed in adults and the elderly, SMRs for the majority of other cancers are not plotted until age 40 and over. In general, the younger a patient’s age of diagnosis, the higher the SMR that the patient will die of stroke through their life. Source data are provided as a Source Data file
Fig. 3
Fig. 3
Fatal stroke among cancer patients as a function of age group. a The y-axis depicts the absolute number of strokes and the x-axis depicts the age group at time of diagnosis. The colors depict the disease sites. The majority of strokes are in patients diagnosed at an older age (i.e., 40–90-year-olds), and the plurality of strokes s occurs in patients diagnosed with prostate, breast, and colorectal cancer. b The y-axis depicts the relative number of strokes compared to all cancer patients, and the x-axis depicts the age group at time of diagnosis. The colors depict the disease sites. For children, adolescents, and young adults (i.e., <40 years old), the plurality of strokes is seen in brain tumor patients. In contrast, among older adults (i.e., >40 years old) the plurality of strokes occurs in patients with cancer of the prostate, breast, and colorectal cancer. Source data are provided as a Source Data file

References

    1. Siegel RL, Miller KD, Jemal A. Cancer Statistics, 2017. CA a cancer J. clinicians. 2017;67:7–30. doi: 10.3322/caac.21387. - DOI - PubMed
    1. Mozaffarian, D. et al. Heart disease and stroke statistics-2016 update: a report from the American Heart Association. Circulation 133, e38–e48 (2016). - PubMed
    1. Dearborn JL, Urrutia VC, Zeiler SR. Stroke and cancer—a complicated relationship. J. Neurol. Transl. Neurosci. 2014;2:1039. - PMC - PubMed
    1. Kernan WN, et al. Guidelines for the prevention of stroke in patients with stroke and transient ischemic attack: a guideline for healthcare professionals from the American Heart Association/American Stroke Association. Stroke. 2014;45:2160–2236. doi: 10.1161/STR.0000000000000024. - DOI - PubMed
    1. Powers WJ, et al. 2018 guidelines for the early management of patients with acute ischemic stroke: a guideline for healthcare professionals From the American Heart Association/American Stroke Association. Stroke. 2018;49:e46–e110. doi: 10.1161/STR.0000000000000158. - DOI - PubMed