. 2019 Dec;34(12):1131-1142.
doi: 10.1007/s10654-019-00580-9. Epub 2019 Nov 15.

Progress against inequalities in mortality: register-based study of 15 European countries between 1990 and 2015

Affiliations

Progress against inequalities in mortality: register-based study of 15 European countries between 1990 and 2015

Johan P Mackenbach et al. Eur J Epidemiol. 2019 Dec.

Abstract

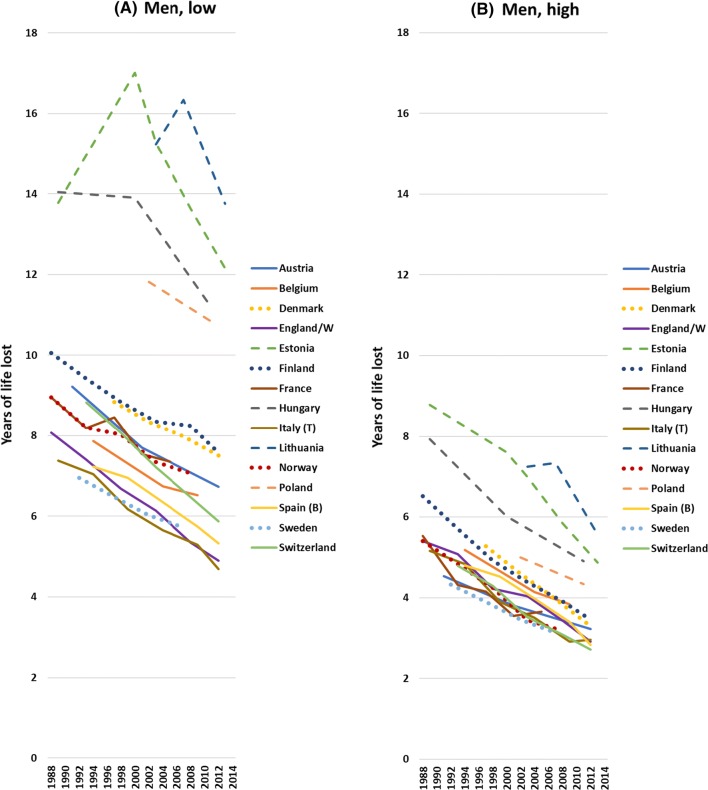
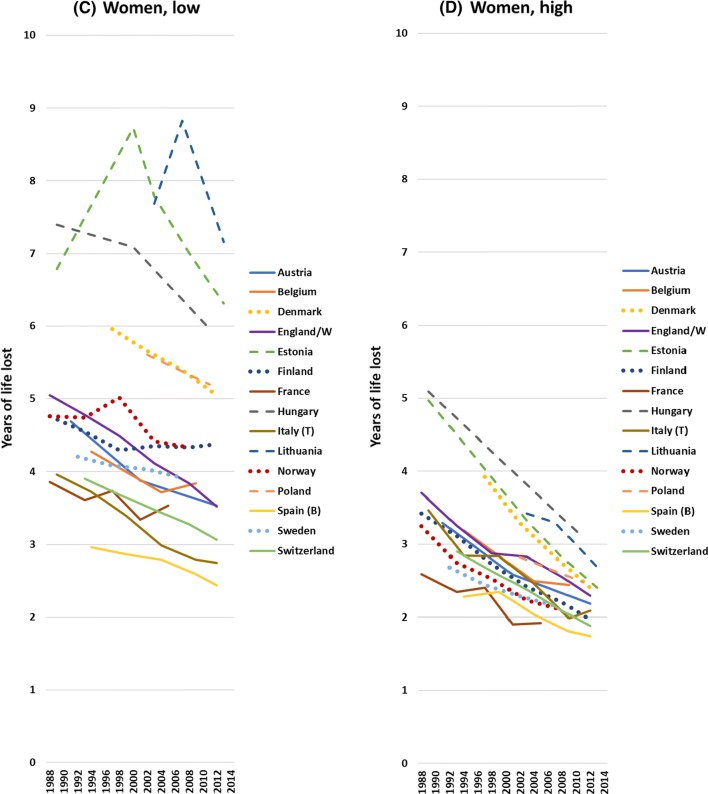
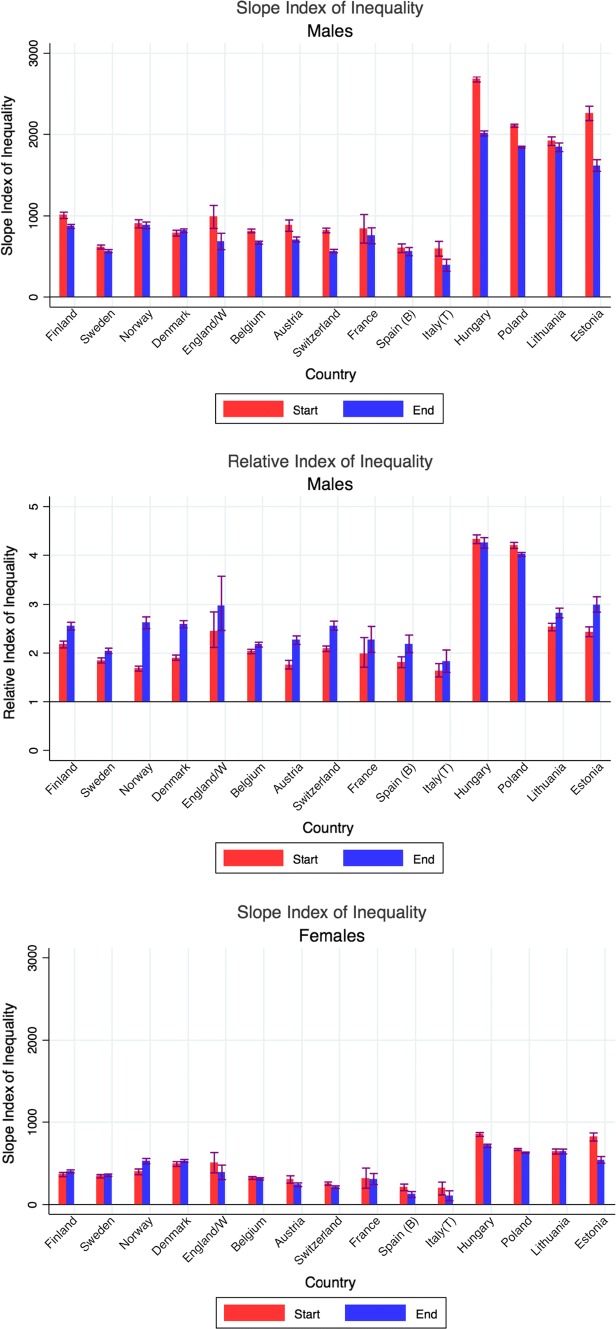
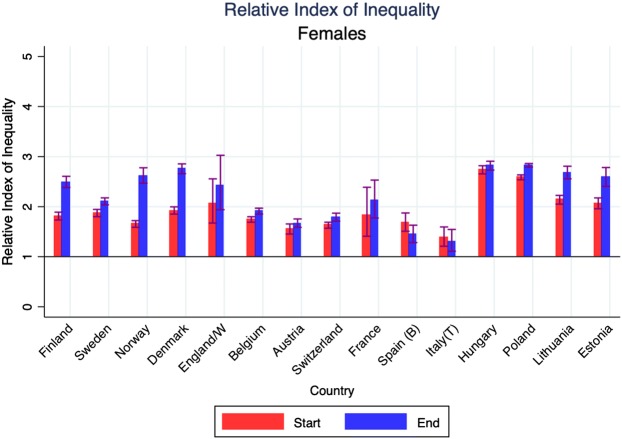
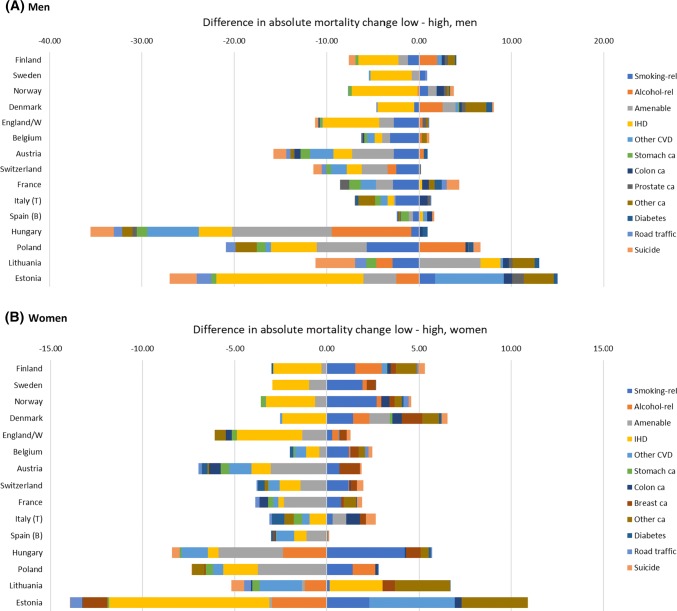
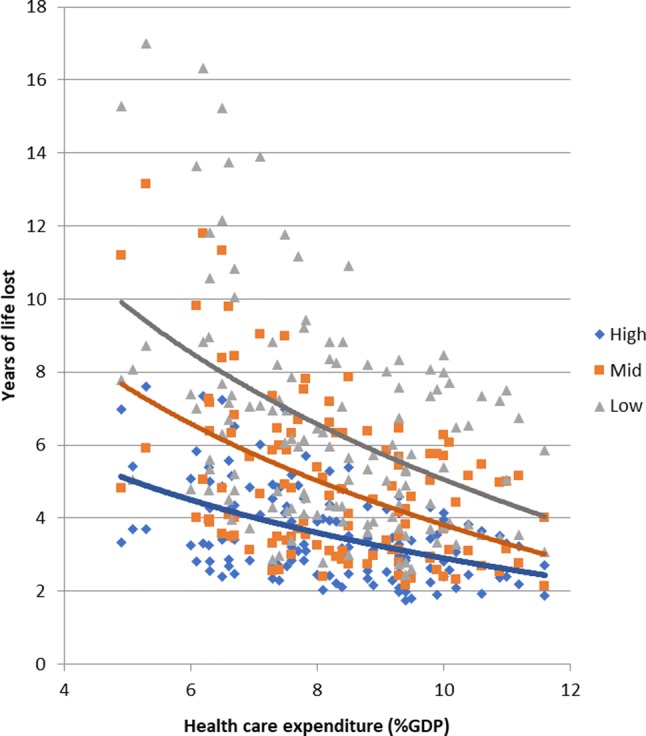
Socioeconomic inequalities in mortality are a challenge for public health around the world, but appear to be resistant to policy-making. We aimed to identify European countries which have been more successful than others in narrowing inequalities in mortality, and the factors associated with narrowing inequalities. We collected and harmonised mortality data by educational level in 15 European countries over the last 25 years, and quantified changes in inequalities in mortality using a range of measures capturing different perspectives on inequality (e.g., 'relative' and 'absolute' inequalities, inequalities in 'attainment' and 'shortfall'). We determined which causes of death contributed to narrowing of inequalities, and conducted country- and period-fixed effects analyses to assess which country-level factors were associated with narrowing of inequalities in mortality. Mortality among the low educated has declined rapidly in all European countries, and a narrowing of absolute, but not relative inequalities was seen in many countries. Best performers were Austria, Italy (Turin) and Switzerland among men, and Spain (Barcelona), England and Wales, and Austria among women. Ischemic heart disease, smoking-related causes (men) and amenable causes often contributed to narrowing inequalities. Trends in income inequality, level of democracy and smoking were associated with widening inequalities, but rising health care expenditure was associated with narrowing inequalities. Trends in inequalities in mortality have not been as unfavourable as often claimed. Our results suggest that health care expansion has counteracted the inequalities widening effect of other influences.

Keywords: Europe; Mortality; Social inequality; Trends.


Conflict of interest statement

The authors declare that they have no conflict of interest.

Figures

Fig. 1
Fig. 1
Trends in years of life lost between the ages of 35 and 80 years, by country, gender and level of education. Notes Years of life lost calculated as partial life expectancy (between the ages of 35 and 80 years) minus 45 years. Dashed lines: Eastern European countries; dotted lines: Northern European countries. Scale for men and women different
Fig. 1
Fig. 1
Trends in years of life lost between the ages of 35 and 80 years, by country, gender and level of education. Notes Years of life lost calculated as partial life expectancy (between the ages of 35 and 80 years) minus 45 years. Dashed lines: Eastern European countries; dotted lines: Northern European countries. Scale for men and women different
Fig. 2
Fig. 2
Changes in Slope Index of Inequality and in Relative Index of Inequality for mortality, by country and gender. Notes: Start = around 1990; end = around 2012. *Start = around 2000; end = around 2012. For exact timing of observation periods, see Table 1 and Web appendix Table A1
Fig. 2
Fig. 2
Changes in Slope Index of Inequality and in Relative Index of Inequality for mortality, by country and gender. Notes: Start = around 1990; end = around 2012. *Start = around 2000; end = around 2012. For exact timing of observation periods, see Table 1 and Web appendix Table A1
Fig. 3
Fig. 3
Contribution of 13 causes of death to changes in absolute inequalities in mortality between low and high educated. a Men, b Women. Notes: Difference between low and high expressed in annual mortality change, expressed as deaths per 100,000 person-years. For Eastern Europe changes have been calculated over the most recent observation period, with declining mortality. Excluding all other causes of death
Fig. 4
Fig. 4
Association between health care expenditure and years of life lost. Notes: Each dot represents one observation (years of life lost by country, period, gender, level of education). Similar results for other mortality measures (mortality rates, life expectancy)

References

    1. Mackenbach JP, Stirbu I, Roskam AJ, et al. Socioeconomic inequalities in health in 22 European countries. N Engl J Med. 2008;358(23):2468–2481. doi: 10.1056/NEJMsa0707519. - DOI - PubMed
    1. Toch-Marquardt M, Menvielle G, Eikemo TA, et al. Occupational class inequalities in all-cause and cause-specific mortality among middle-aged men in 14 European populations during the early 2000s. PLoS ONE. 2014;9(9):e108072. doi: 10.1371/journal.pone.0108072. - DOI - PMC - PubMed
    1. Mortensen LH, Rehnberg J, Dahl E, et al. Shape of the association between income and mortality: a cohort study of Denmark, Finland, Norway and Sweden in 1995 and 2003. BMJ Open. 2016;6(12):e010974. doi: 10.1136/bmjopen-2015-010974. - DOI - PMC - PubMed
    1. Mackenbach JP. The persistence of health inequalities in modern welfare states: the explanation of a paradox. Soc Sci Med. 2012;75(4):761–769. doi: 10.1016/j.socscimed.2012.02.031. - DOI - PubMed
    1. Mackenbach JP, Kulhánová I, Artnik B, et al. Changes in mortality inequalities over two decades: register based study of European countries. Br Med J. 2016;353:i1732. doi: 10.1136/bmj.i1732. - DOI - PMC - PubMed