. 2019 Nov 15;7(1):305.
doi: 10.1186/s40425-019-0770-2.

Mechanisms regulating PD-L1 expression on tumor and immune cells

Affiliations

Mechanisms regulating PD-L1 expression on tumor and immune cells

Shuming Chen et al. J Immunother Cancer. .

Abstract

Background: The PD-1/PD-L1 checkpoint is a central mediator of immunosuppression in the tumor immune microenvironment (TME) and is primarily associated with IFN-g signaling. To characterize other factors regulating PD-L1 expression on tumor and/or immune cells, we investigated TME-resident cytokines and the role of transcription factors in constitutive and cytokine-induced PD-L1 expression.

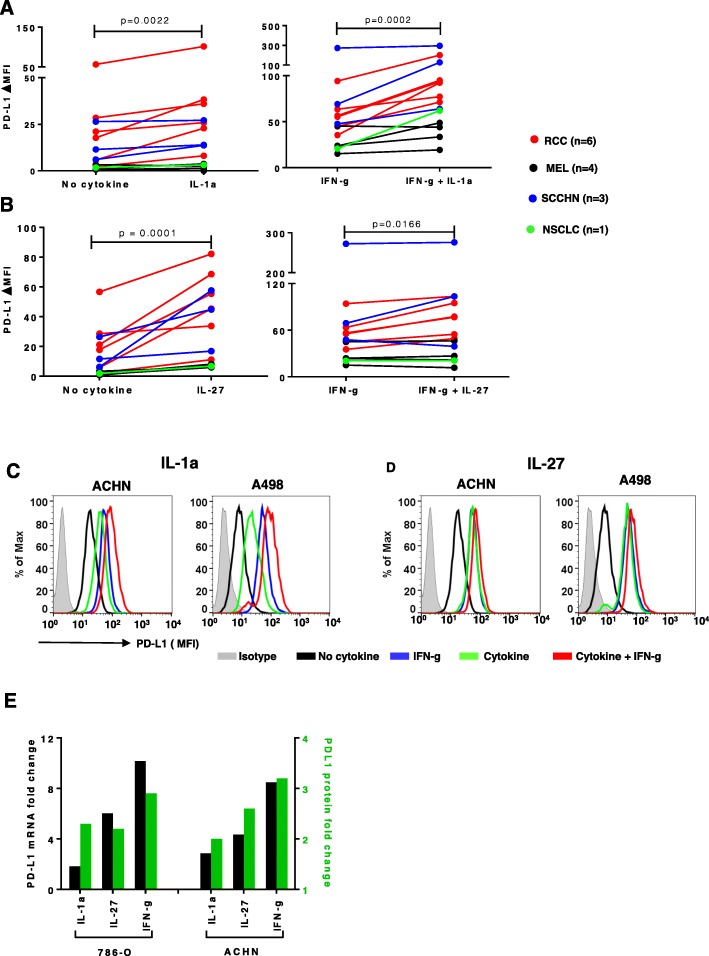
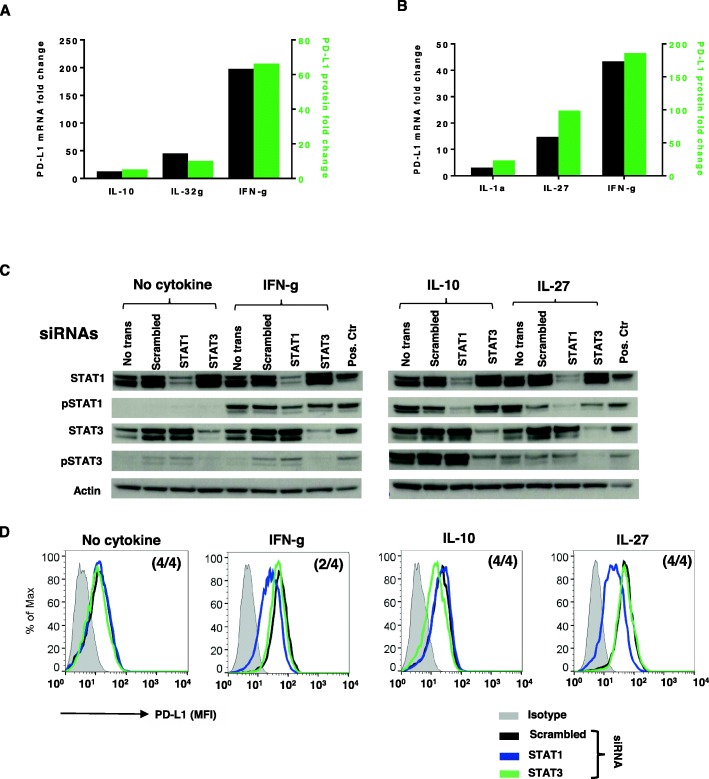
Methods: Thirty-four cultured human tumor lines [18 melanomas (MEL), 12 renal cell carcinomas (RCC), 3 squamous cell carcinomas of the head and neck (SCCHN), and 1 non-small-cell lung carcinoma (NSCLC)] and peripheral blood monocytes (Monos) were treated with cytokines that we detected in the PD-L1+ TME by gene expression profiling, including IFN-g, IL-1a, IL-10, IL-27 and IL-32g. PD-L1 cell surface protein expression was detected by flow cytometry, and mRNA by quantitative real-time PCR. Total and phosphorylated STAT1, STAT3, and p65 proteins were detected by Western blotting, and the genes encoding these proteins were knocked down with siRNAs. Additionally, the proximal promoter region of PDL1 (CD274) was sequenced in 33 cultured tumors.

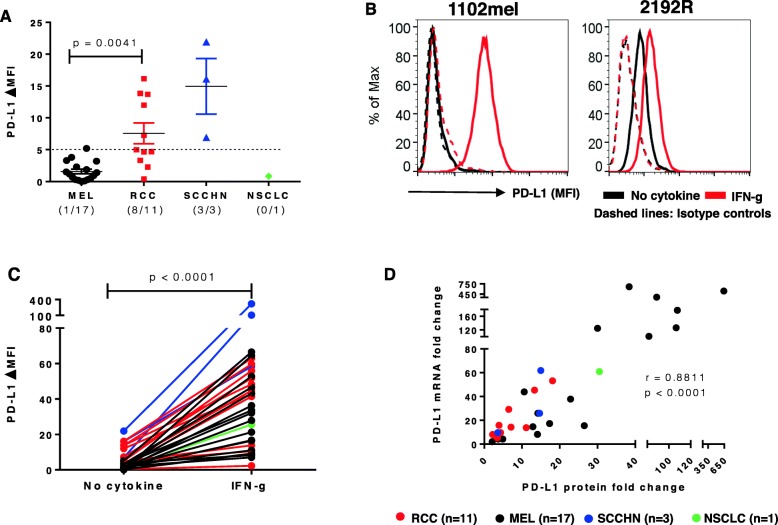
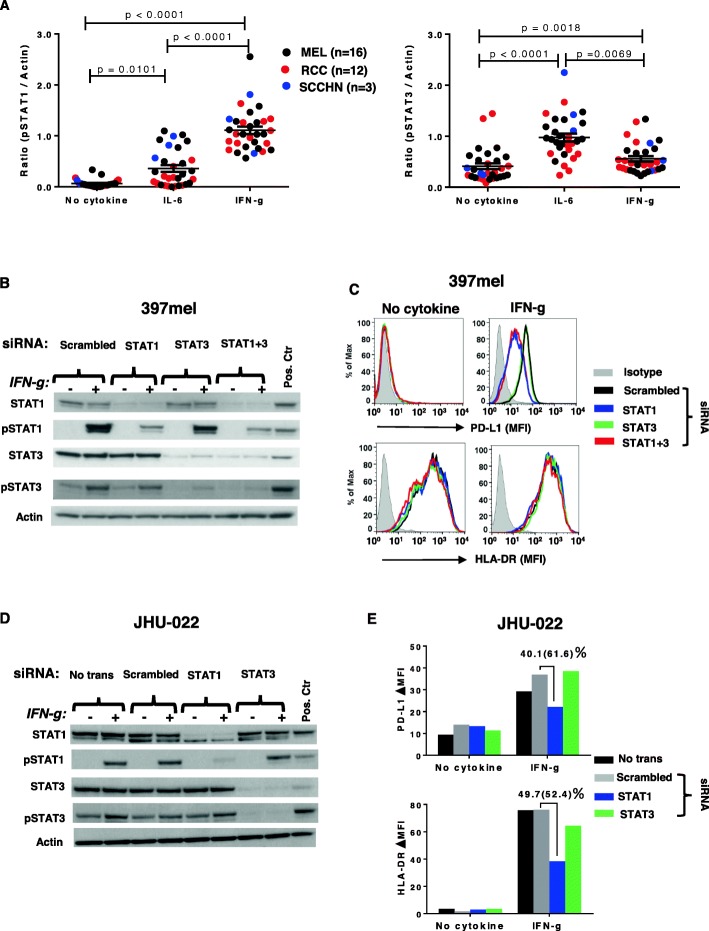
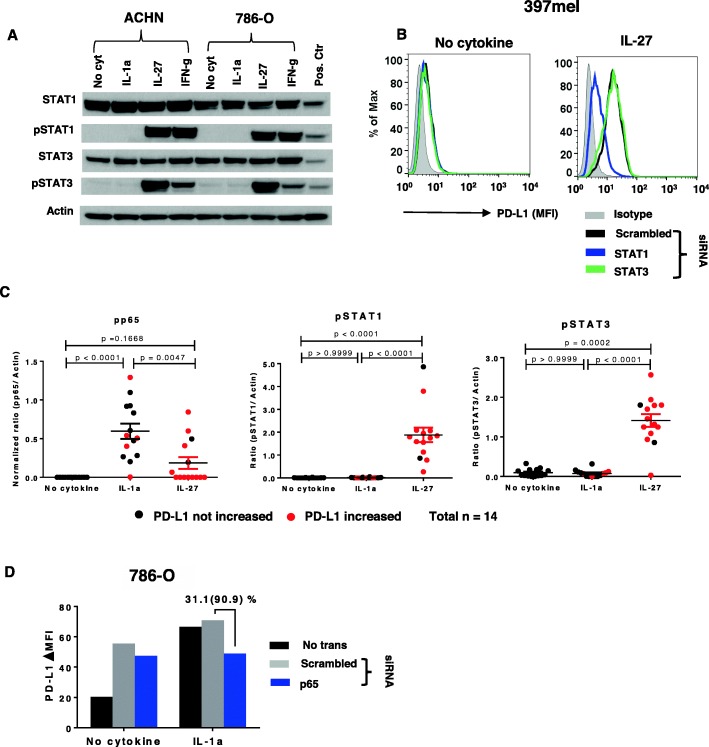
Results: PD-L1 was constitutively expressed on 1/17 cultured MELs, 8/11 RCCs, 3/3 SCCHNs, and on Monos. Brief IFN-g exposure rapidly induced PD-L1 on all tumor cell lines and Monos regardless of constitutive PD-L1 expression. PD-L1 mRNA levels were associated with protein expression, which was diminished by exposure to transcriptional inhibitors. siRNA knockdown of STAT1 but not STAT3 reduced IFN-g- and IL-27-induced PD-L1 protein expression on tumor cells. In contrast, STAT3 knockdown in Monos reduced IL-10-induced PD-L1 protein expression, and p65 knockdown in tumor cells reduced IL-1a-induced PD-L1 expression. Notably, constitutive PD-L1 expression was not affected by knocking down STAT1, STAT3, or p65. Differential effects of IFN-g, IL-1a, and IL-27 on individual tumor cell lines were not due to PDL1 promoter polymorphisms.

Conclusions: Multiple cytokines found in an immune-reactive TME may induce PD-L1 expression on tumor and/or immune cells through distinct signaling mechanisms. Factors driving constitutive PD-L1 expression were not identified in this study. Understanding complex mechanisms underlying PD-L1 display in the TME may allow treatment approaches mitigating expression of this immunosuppressive ligand, to enhance the impact of PD-1 blockade.

Keywords: Cancer immunotherapy; Cytokines; Interferon gamma; Interleukins; PD-L1; Transcription factors; Tumor microenvironment.


Conflict of interest statement

DMP and SLT report stock and other ownership interests from Aduro Biotech, Compugen, DNAtrix, Dragonfly Therapeutics, ERVAXX, Five Prime Therapeutics, FLX Bio, Jounce Therapeutics, Potenza Therapeutics, Tizona Therapeutics, and WindMIL; consulting or advisory role with AbbVie, Amgen, Bayer, Compugen, DNAtrix, Dragonfly Therapeutics, Dynavax, ERVAXX, Five Prime Therapeutics, FLX Bio, lmmunomic Therapeutics, Janssen Oncology, Medlmmune, Merck, Tizona Therapeutics, and Wind MIL; research funding from Bristol-Myers Squibb, Compugen, and Potenza Therapeutics; patents, royalties, and other intellectual property from Aduro Biotech, Bristol-Myers Squibb, and lmmunonomic Therapeutics; and travel, accommodations, expenses from Bristol-Myers Squibb, and Five Prime Therapeutics. SC, GAC, TSP, PW, TLM and FP have no conflicts of interest to disclose.

Figures

Fig. 1
Fig. 1
IFN-g-induced PD-L1 protein expression is associated with new PDL1 mRNA transcription in 32 cultured human tumors. a. Constitutive expression of cell surface PD-L1 protein by select tumor lines, detected by flow cytometry. RCCs expressed significantly more PD-L1 than MELs (p = 0.0041). Kruskal-Wallis test (Dunn’s multiple comparisons test), 2-sided p-value. ΔMFI, mean fluorescence of specific staining – isotype staining. Cell lines with ∆MFI ≥ 5, indicated by horizontal dotted line, were considered to be PD-L1 positive. b. Representative examples of IFN-g-induced (left panel) or IFN-g-enhanced (right panel) PD-L1 protein expression. Cultured tumor cells (1102mel, melanoma; 2192R, RCC) were treated with IFN-g 250 U/ml for 48 h, then cell surface PD-L1 protein was detected by flow cytometry. Histograms from two representative cell lines with or without constitutive PD-L1 expression are shown. c. IFN-g significantly increased PD-L1 protein expression on all types of tumor cells tested. Wilcoxon matched-pairs signed rank test, 2-sided p-value. d. IFN-g-induced PD-L1 protein expression is significantly associated with new PDL1 mRNA transcription. Thirty-two cultured tumor lines were treated with IFN-g 250 U/ml. PD-L1 mRNA and cell surface protein expression were detected by qRT-PCR and flow cytometry after 14 h and 48 h, respectively. Fold changes in PD-L1 protein (ΔMFI) and mRNA (ΔCt) were calculated, compared to pretreatment values. Spearman correlation r value, 2-sided p-value. A, C and D, data combined from 3 separate experiments
Fig. 2
Fig. 2
STAT1, but not STAT3 phosphorylation is necessary for IFN-g-induced PD-L1 protein expression on tumor cells. a. IFN-g had a major effect on STAT1 phosphorylation (left panel) but only a minor effect on STAT3 phosphorylation (right panel) in 31 tumor cell lines tested, including MELs, RCCs, and SCCHNs. IL-6 had a reciprocal effect in the same cell lines. Cultured cells were treated with IFN-g 250 U/ml or IL-6 20 ng/ml. Cells were harvested after 15 min and phosphorylation of STAT1 and STAT3 was detected by Western blotting. Protein bands were quantified by ImageJ and results were normalized to beta-actin expression. Kruskal-Wallis test (Dunn’s multiple comparisons test), 2-sided p-values. b and c. Specific siRNA knockdown of STAT1, but not STAT3 mRNA expression in 397mel cells significantly reduced total and phosphorylated STAT1 proteins and reduced IFN-g-induced cell surface PD-L1 protein expression. Cultured tumor cells were transfected with 100 pmol of the indicated siRNAs and were treated 2 days later with IFN-g 250 U/ml. Total and phosphorylated STAT proteins were detected by Western blotting after 15 min of IFN-g treatment, and flow cytometry for cell surface PD-L1 was conducted 1 day later. 397mel expressed HLA-DR constitutively, and this was not affected by STAT knockdown (c). d and e. In JHU-022 cultured SCCHN cells, STAT1 knockdown reduced IFN-g-induced but not constitutive (“no cytokine”) cell surface PD-L1 protein expression. IFN-g also induced HLA-DR expression on JHU-022, which was reduced by STAT1 but not STAT3 knockdown. Percentages represent reduction in total PD-L1 or HLA-DR expression with STAT1 knockdown compared to scrambled siRNA control; numbers in parentheses represent reduction in the amount of PD-L1 or HLA-DR expression that was induced by IFN-g above “no cytokine” baseline expression. Data in panels B-E are representative of 6 tumor lines (4 MELs and 2 SCCHNs). No trans, no transfection; Pos. Ctr., positive control cell lines, mixture of equal amounts of IFN-treated PC-3 cells as pSTAT1 positive control and IL-6-treated COS-7 cells as pSTAT3 positive control; Scrambled, non-specific siRNA mixture
Fig. 3
Fig. 3
IL-1a- and IL-27-induced PD-L1 protein expression are associated with new PD-L1 mRNA transcription in tumor cells. Fourteen cultured tumor lines were treated with IL-1a (10 ng/ml) or IL-27 (50 ng/ml) for 48 h, and cell surface PD-L1 protein was detected by flow cytometry. a. IL-1a alone (left panel) or in combination with IFN-g (right panel) increased PD-L1 expression on tumor cells. ΔMFI, mean fluorescence intensity of PD-L1 staining – isotype control staining. Wilcoxon matched-pairs signed rank test, 2-sided p-values. b. IL-27 independently increased PD-L1 protein expression on tumor cells (left panel), and a further increase was observed when IL-27 was combined with IFN-g (right panel). c. Overlay of flow cytometry histograms from two representative RCC cell lines (ACHN and A498). Either IL-1a or IFN-g independently increased PD-L1 expression, and a greater increase was observed when these cytokines were combined. Note that ACHN and A498 both show constitutive PD-L1 expression in the absence of cytokine treatment. d. Overlay of flow cytometry histograms of ACHN and A498 cells treated with IL-27 or IFN-g, alone or in combination. e. Increased PD-L1 protein expression induced by IL-1a or IL-27 was associated with new PDL1 mRNA transcription in 2 RCCs tested. PD-L1 mRNA and cell surface protein were measured by qRT-PCR and flow cytometry at 16 h or 48 h after cytokine exposure, respectively
Fig. 4
Fig. 4
p65 and STAT1 are involved in IL-1a- and IL-27-induced PD-L1 expression, respectively, in tumor cells. Cultured tumor cells were treated with IL-1a (10 ng/ml), IL-27 (50 ng/ml), or IFN-g (100 IU/ml). STAT1, STAT3, and p65 phosphorylation was detected by Western blotting 15 min after cytokine exposure. In experiments to inhibit phosphorylation, transcription factors first were knocked down by transfecting specific siRNAs; after 2 days, transfected cells were treated with cytokines and knockdown effects were assessed with Western blotting. PD-L1 cell surface protein expression was detected by flow cytometry 1 day after cytokine treatment. a. In two RCC cell lines, IL-27 exposure caused phosphorylation of both STAT1 and STAT3, while IFN-g selectively phosphorylated STAT1, and IL-1a did not phosphorylate either STAT1 or STAT3. Pos ctr, positive control; mixture of equal amounts of IFN-treated PC-3 cells as a pSTAT1 positive control, and IL-6-treated COS-7 cells as a pSTAT3 positive control. b. In 397mel, STAT1 but not STAT3 knockdown significantly reduced IL-27-induced PD-L1 expression. Results representative of 2 tumor cell lines (one MEL, one SCCHN). c. IL-1a increased p65 phosphorylation, but not STAT1 or STAT3 phosphorylation, in 14 tumor cell lines. After cytokine exposure, phosphorylation of the indicated transcription factors was detected by Western blotting. Protein bands were quantified by ImageJ and results were normalized to beta-actin expression. Because all cell lines expressed phosphorylated p65 constitutively in the absence of cytokines, values for constitutive normalized ratios have been subtracted from the data depicted for pp65. PD-L1 increased, cytokine-induced enhancement of PD-L1 cell surface expression of ≥5 MFI detected with flow cytometry (red symbols); no or lower levels of PD-L1 enhancement indicated by black symbols. Kruskal-Wallis test (Dunn’s multiple comparisons test), 2-sided p-values. d. Knocking down p65 reduced IL-1a-induced PD-L1 protein expression in 786-O. Percentage represents reduction in total PD-L1 expression with p65 knockdown compared to scrambled siRNA control; number in parentheses represents reduction in the amount of PD-L1 expression that was induced by IL-1a above the “no cytokine” baseline expression. Results in panel D are representative of 3 separate experiments with 786-O. Corresponding Western blot is provided in Additional file 2: Fig. S2. ΔMFI, mean fluorescence of specific PD-L1 staining – isotype control staining
Fig. 5
Fig. 5
Roles of STAT1 and STAT3 in cytokine-induced PD-L1 protein expression on monocytes. a and b. Cytokine-induced PD-L1 protein expression on Monos was associated with new PDL1 mRNA transcription. Monos were treated with IL-1a, IL-10, IL-27, IL-32 g or IFN-g. PD-L1 mRNA and surface protein were measured by q-RT-PCR and flow cytometry after 16 h or 48 h, respectively. Fold changes in PD-L1 protein and mRNA were calculated. Representative data from Monos derived from one of two normal donors are shown. a. Fold changes in PD-L1 protein and mRNA levels in normal donor Monos after IL-10 (100 ng/ml), IL-32 g (100 ng/ml) or IFN-g (100 IU/ml) exposure. b. Fold changes of PD-L1 protein and mRNA levels in normal donor Monos after IL-1a (10 ng/ml), IL-27 (50 ng/ml) or IFN-g (100 IU/ml) treatment. c and d. Fresh isolated Monos were transfected with 300 pmol STAT1 or STAT3 siRNA and treated with the indicated cytokines 2 days later. Total or phosphorylated STATs and cell surface PD-L1 expression were assessed with Western blotting and flow cytometry after 15 min or 1 day, respectively. c. siRNA knockdown significantly reduced total and phosphorylated STAT1 and STAT3. d. STAT1 knockdown reduced IFN-g- and IL27-induced PD-L1 protein expression, while STAT3 knockdown reduced IL10-induced PD-L1 expression. Numbers in parentheses indicate number of normal donors having Monos with these findings

References

    1. Topalian SL, Weiner GJ, Pardoll DM. Cancer immunotherapy comes of age. J Clin Oncol. 2011;29(36):4828–36. doi: 10.1200/JCO.2011.38.0899. - DOI - PMC - PubMed
    1. Dong H, Strome SE, Salomao DR, Tamura H, Hirano F, Flies DB, et al. Tumor-associated B7-H1 promotes T-cell apoptosis: a potential mechanism of immune evasion. Nat Med. 2002;8(8):793–800. doi: 10.1038/nm730. - DOI - PubMed
    1. Topalian SL, Taube JM, Anders RA, Pardoll DM. Mechanism-driven biomarkers to guide immune checkpoint blockade in cancer therapy. Nat Rev Cancer. 2016;16(5):275–287. doi: 10.1038/nrc.2016.36. - DOI - PMC - PubMed
    1. Pardoll DM. The blockade of immune checkpoints in cancer immunotherapy. Nat Rev Cancer. 2012;12(4):252–264. doi: 10.1038/nrc3239. - DOI - PMC - PubMed
    1. Marzec M, Zhang Q, Goradia A, Raghunath PN, Liu X, Paessler M, et al. Oncogenic kinase NPM/ALK induces through STAT3 expression of immunosuppressive protein CD274 (PD-L1, B7-H1) Proc Natl Acad Sci U S A. 2008;105(52):20852–20857. doi: 10.1073/pnas.0810958105. - DOI - PMC - PubMed

Publication types