. 2019 Dec 16;32(12):2466-2478.
doi: 10.1021/acs.chemrestox.9b00293. Epub 2019 Dec 3.

Metabolism of Benzalkonium Chlorides by Human Hepatic Cytochromes P450

Affiliations

Metabolism of Benzalkonium Chlorides by Human Hepatic Cytochromes P450

Ryan P Seguin et al. Chem Res Toxicol. .

Abstract

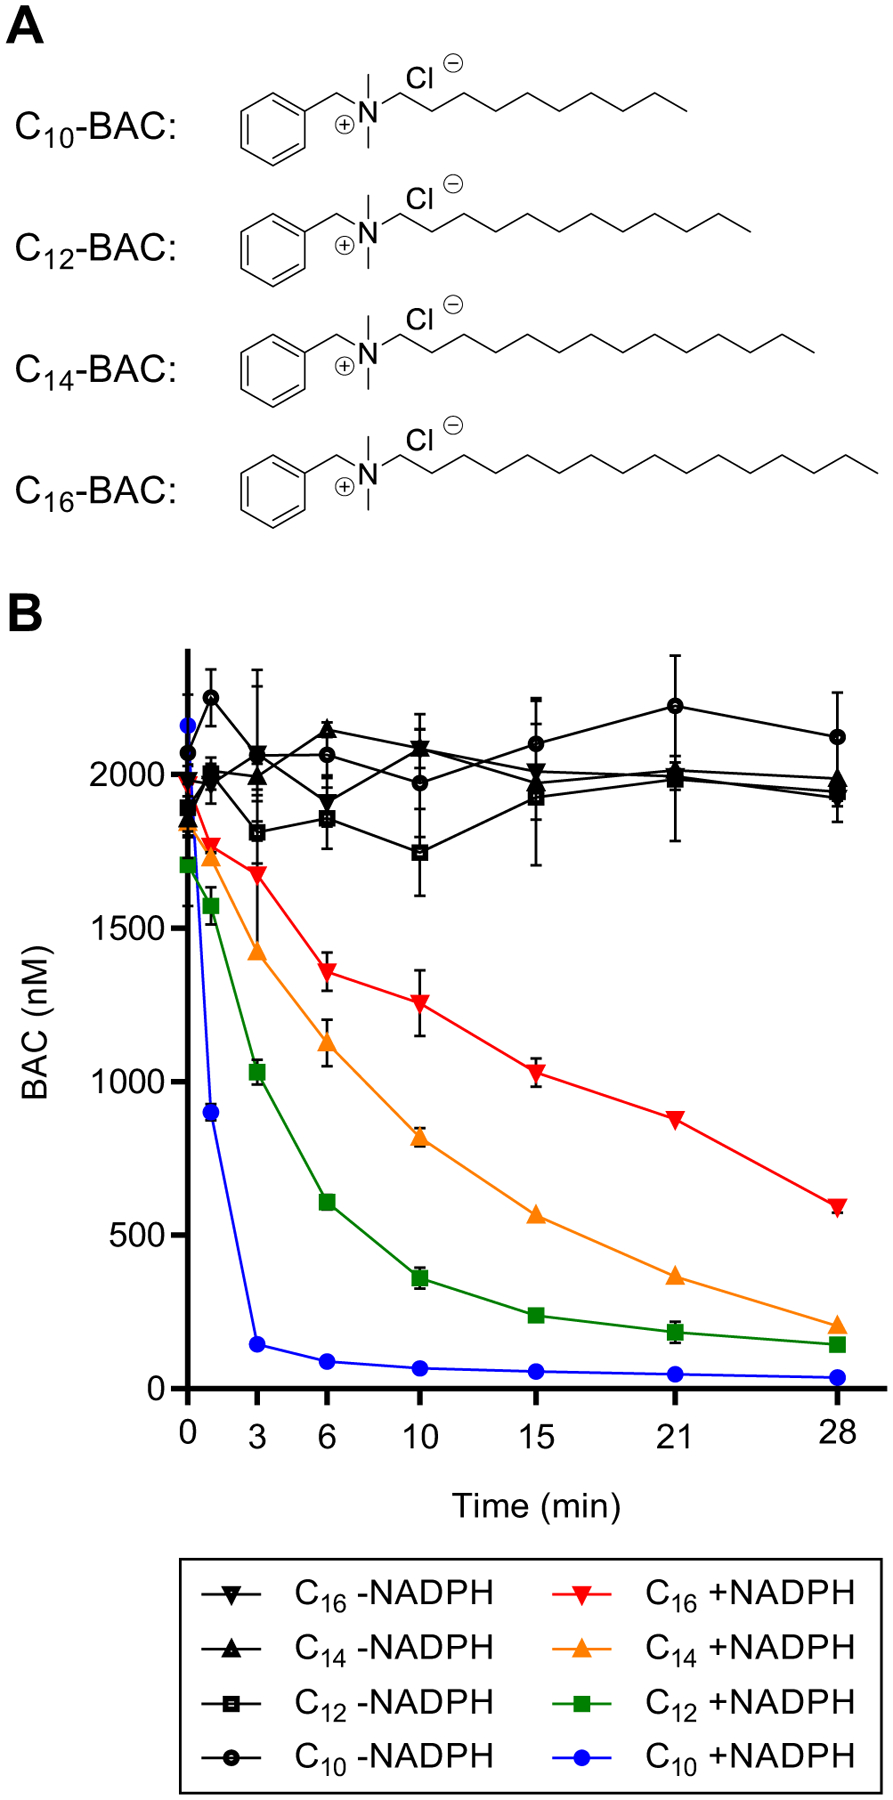
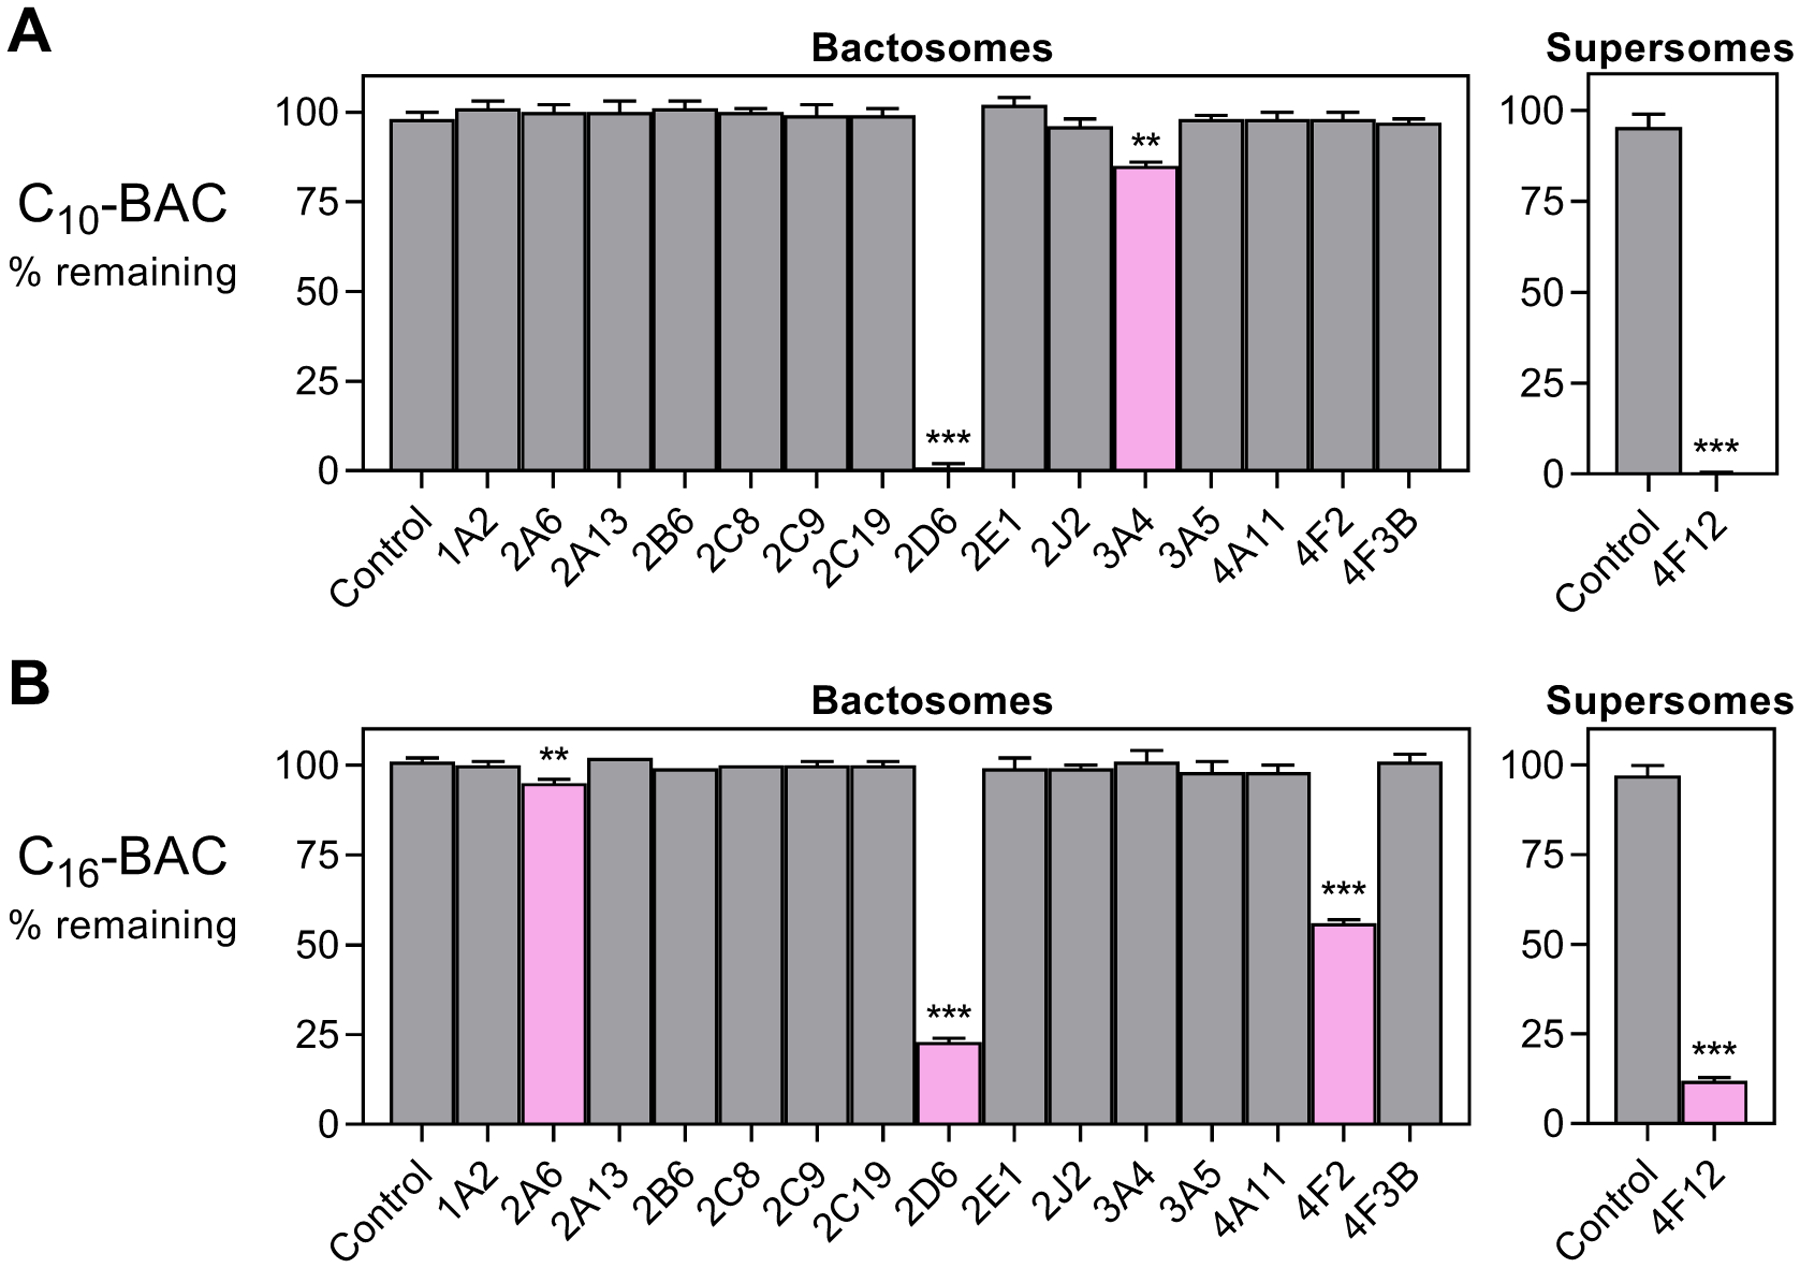
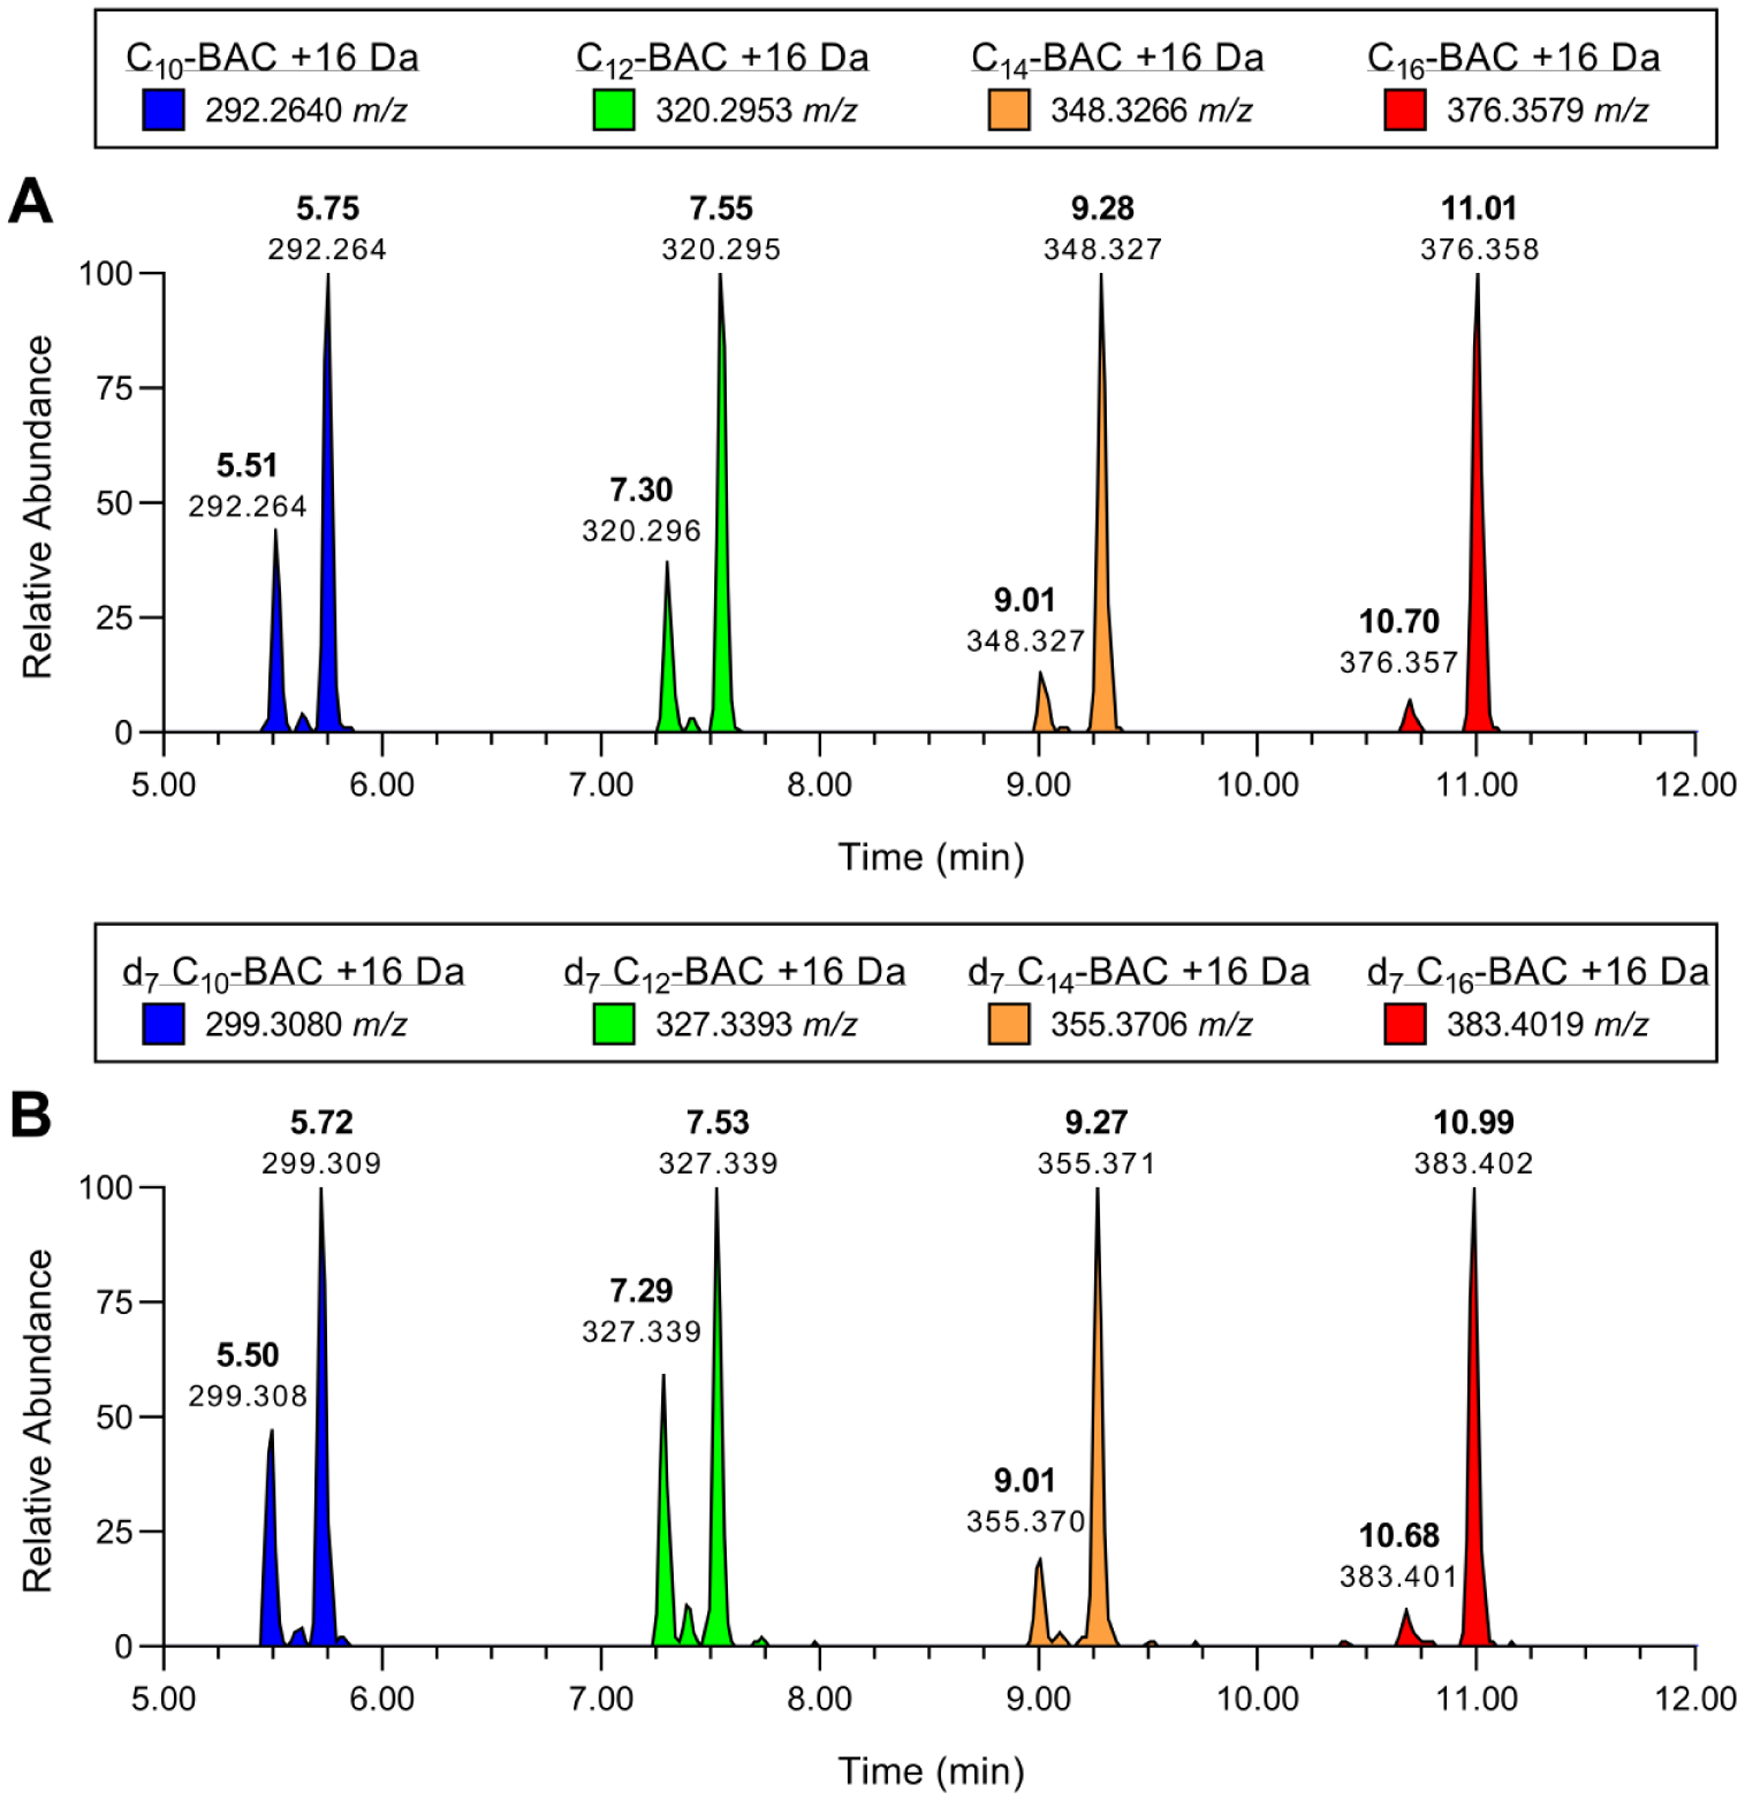
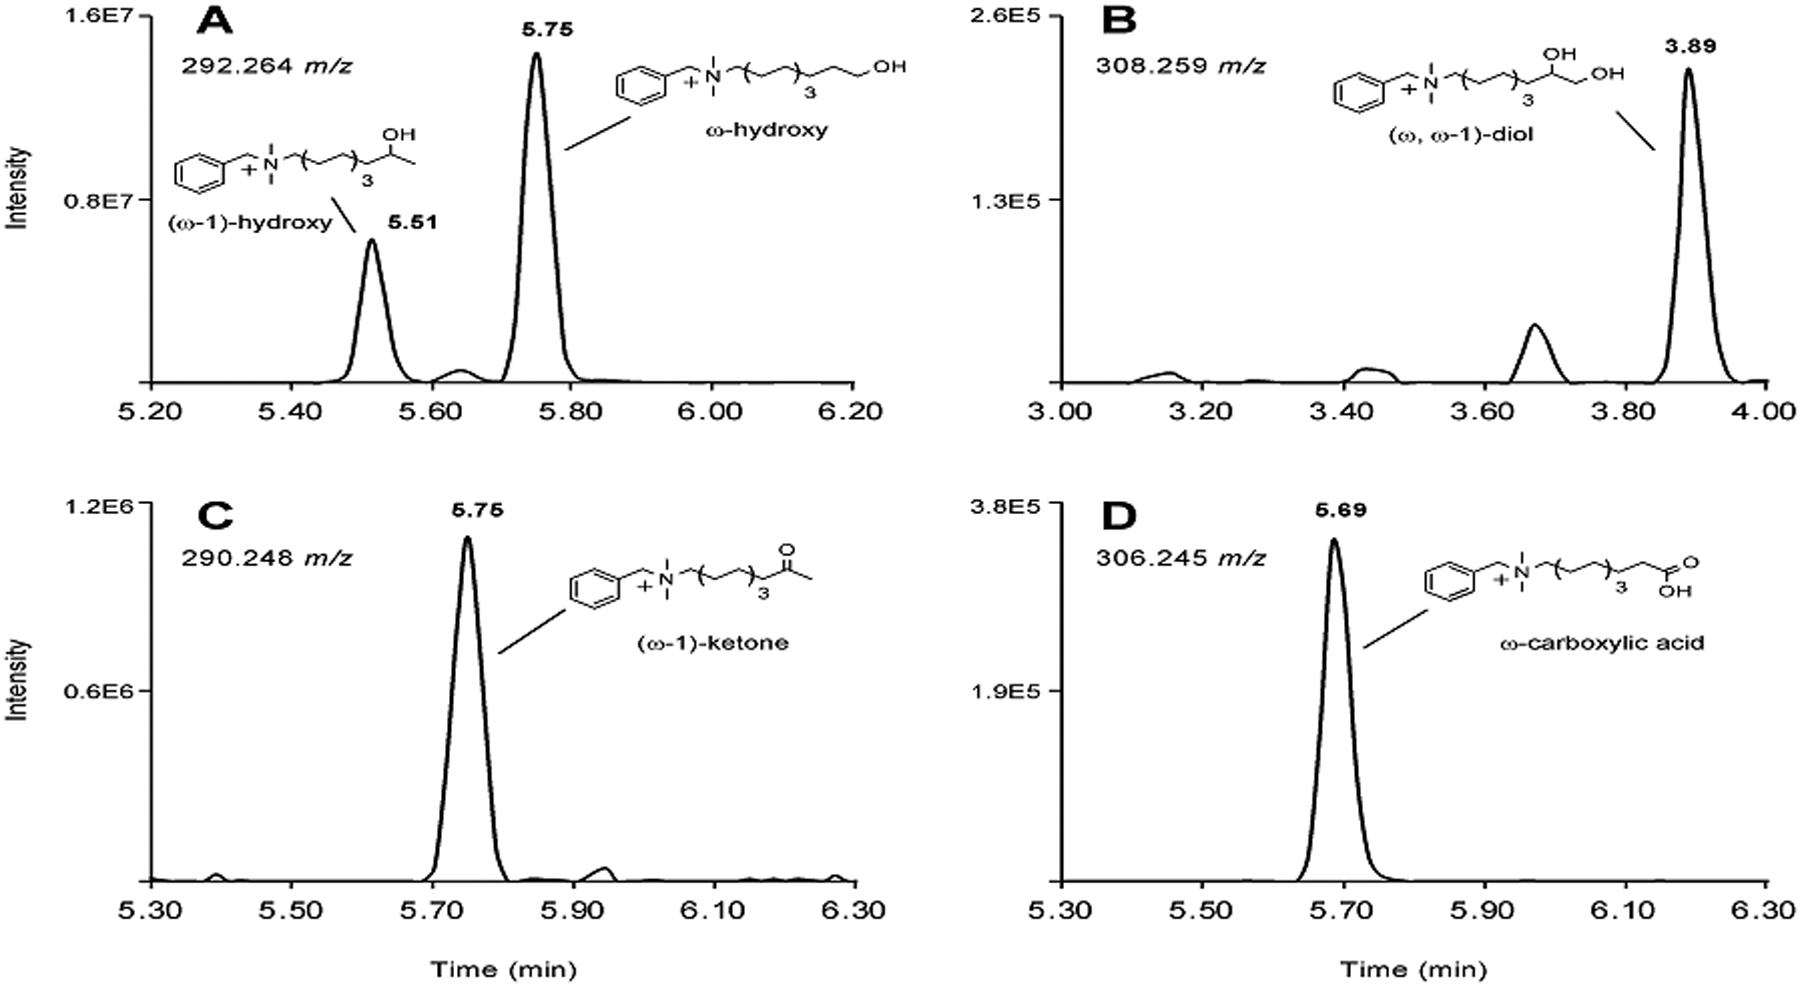
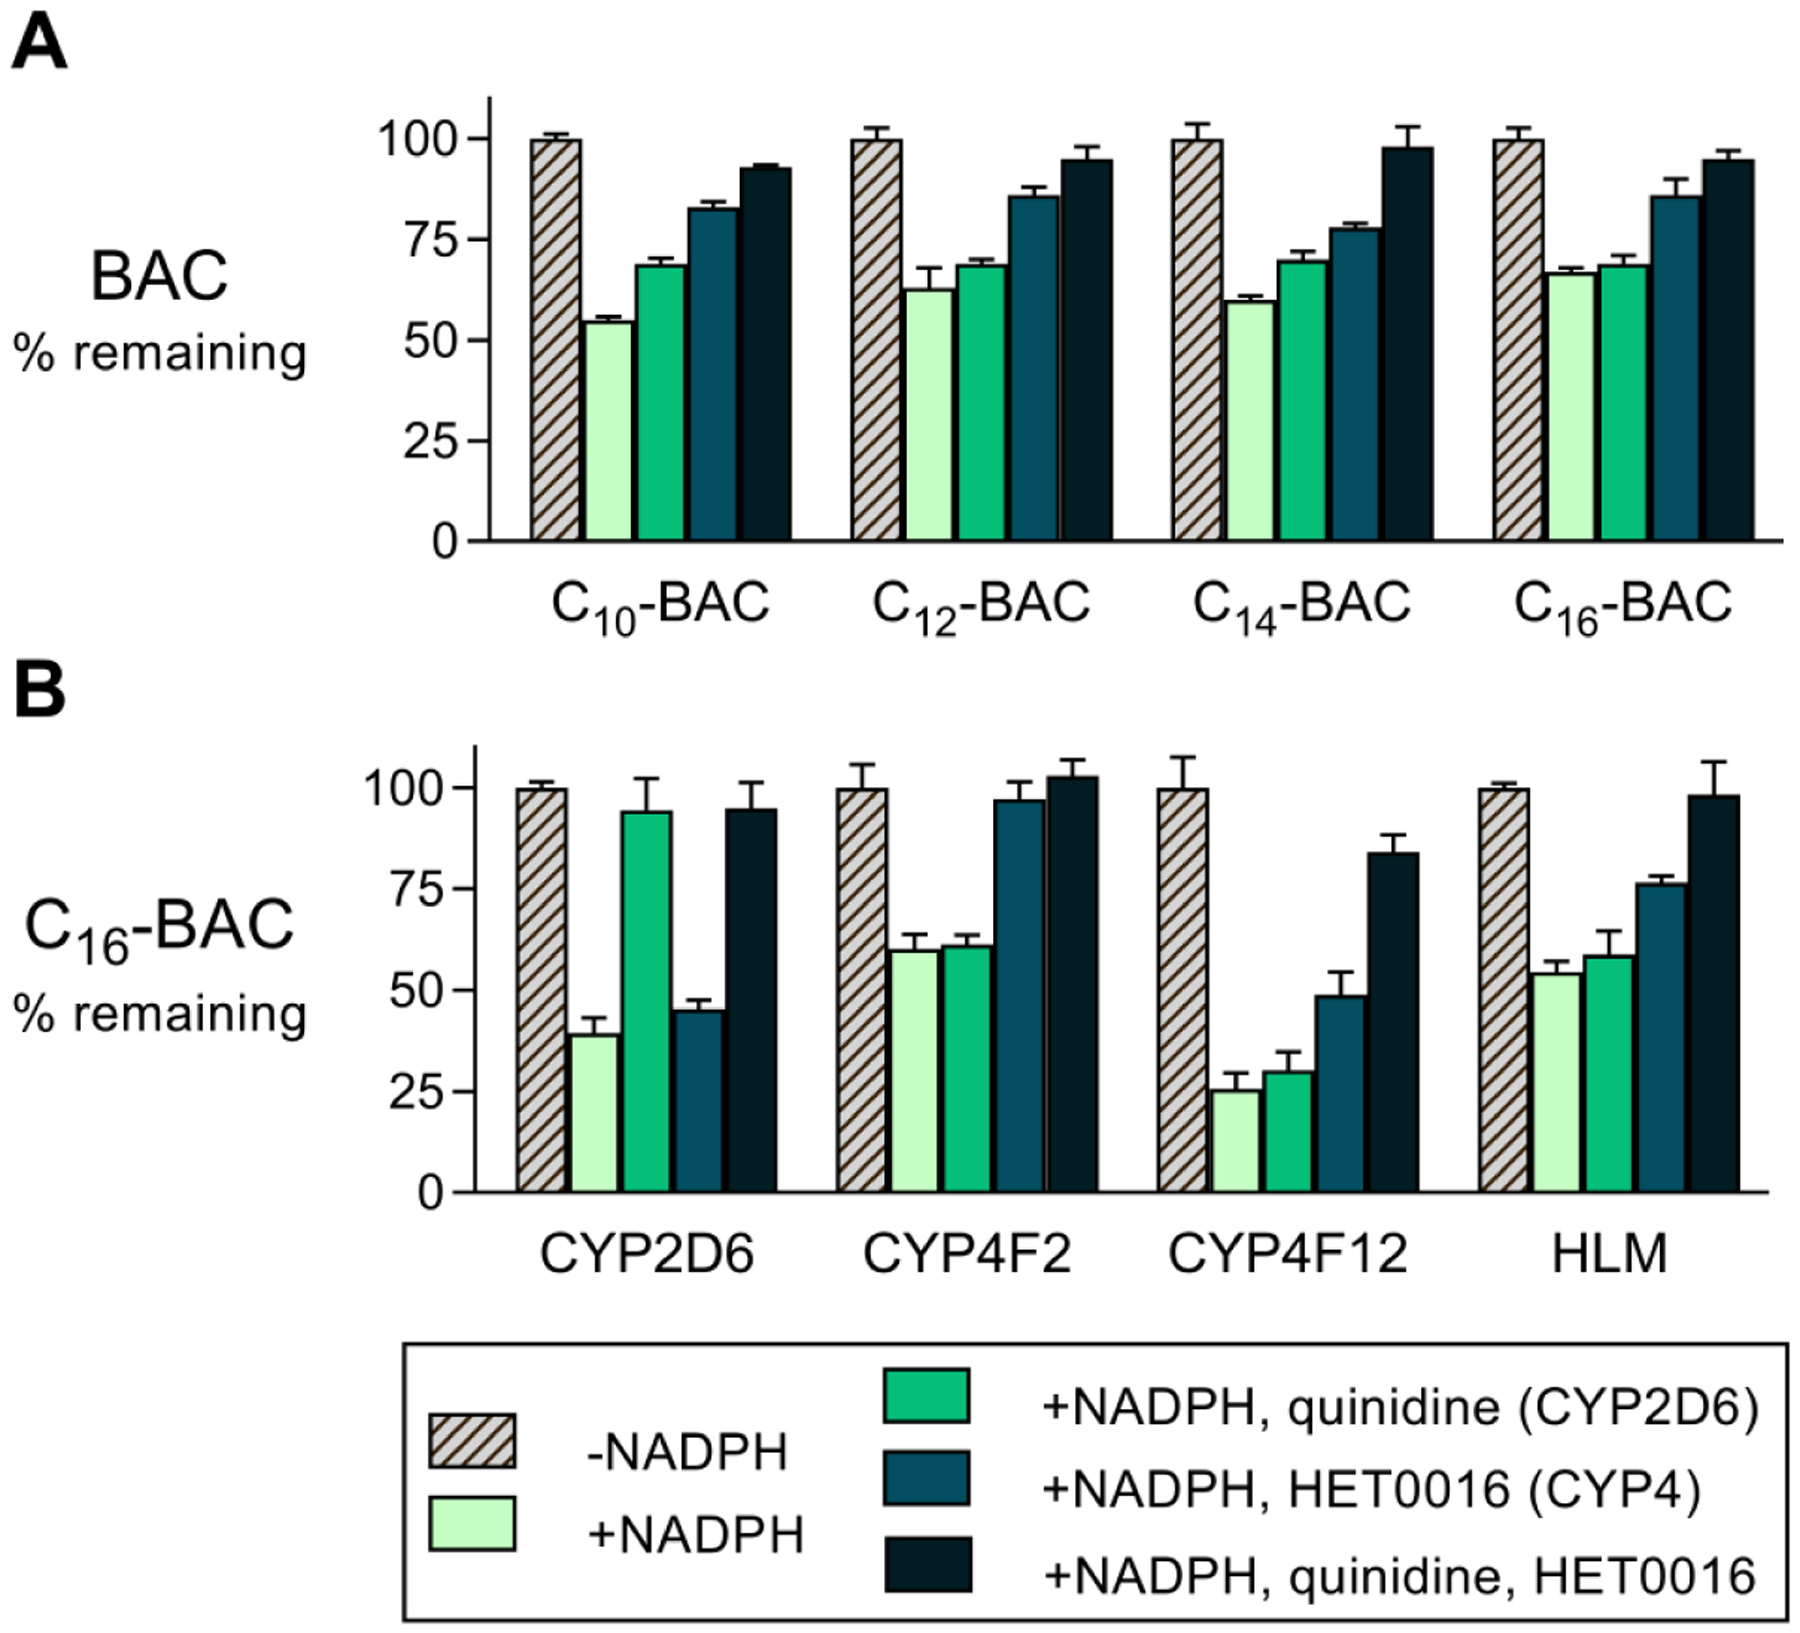
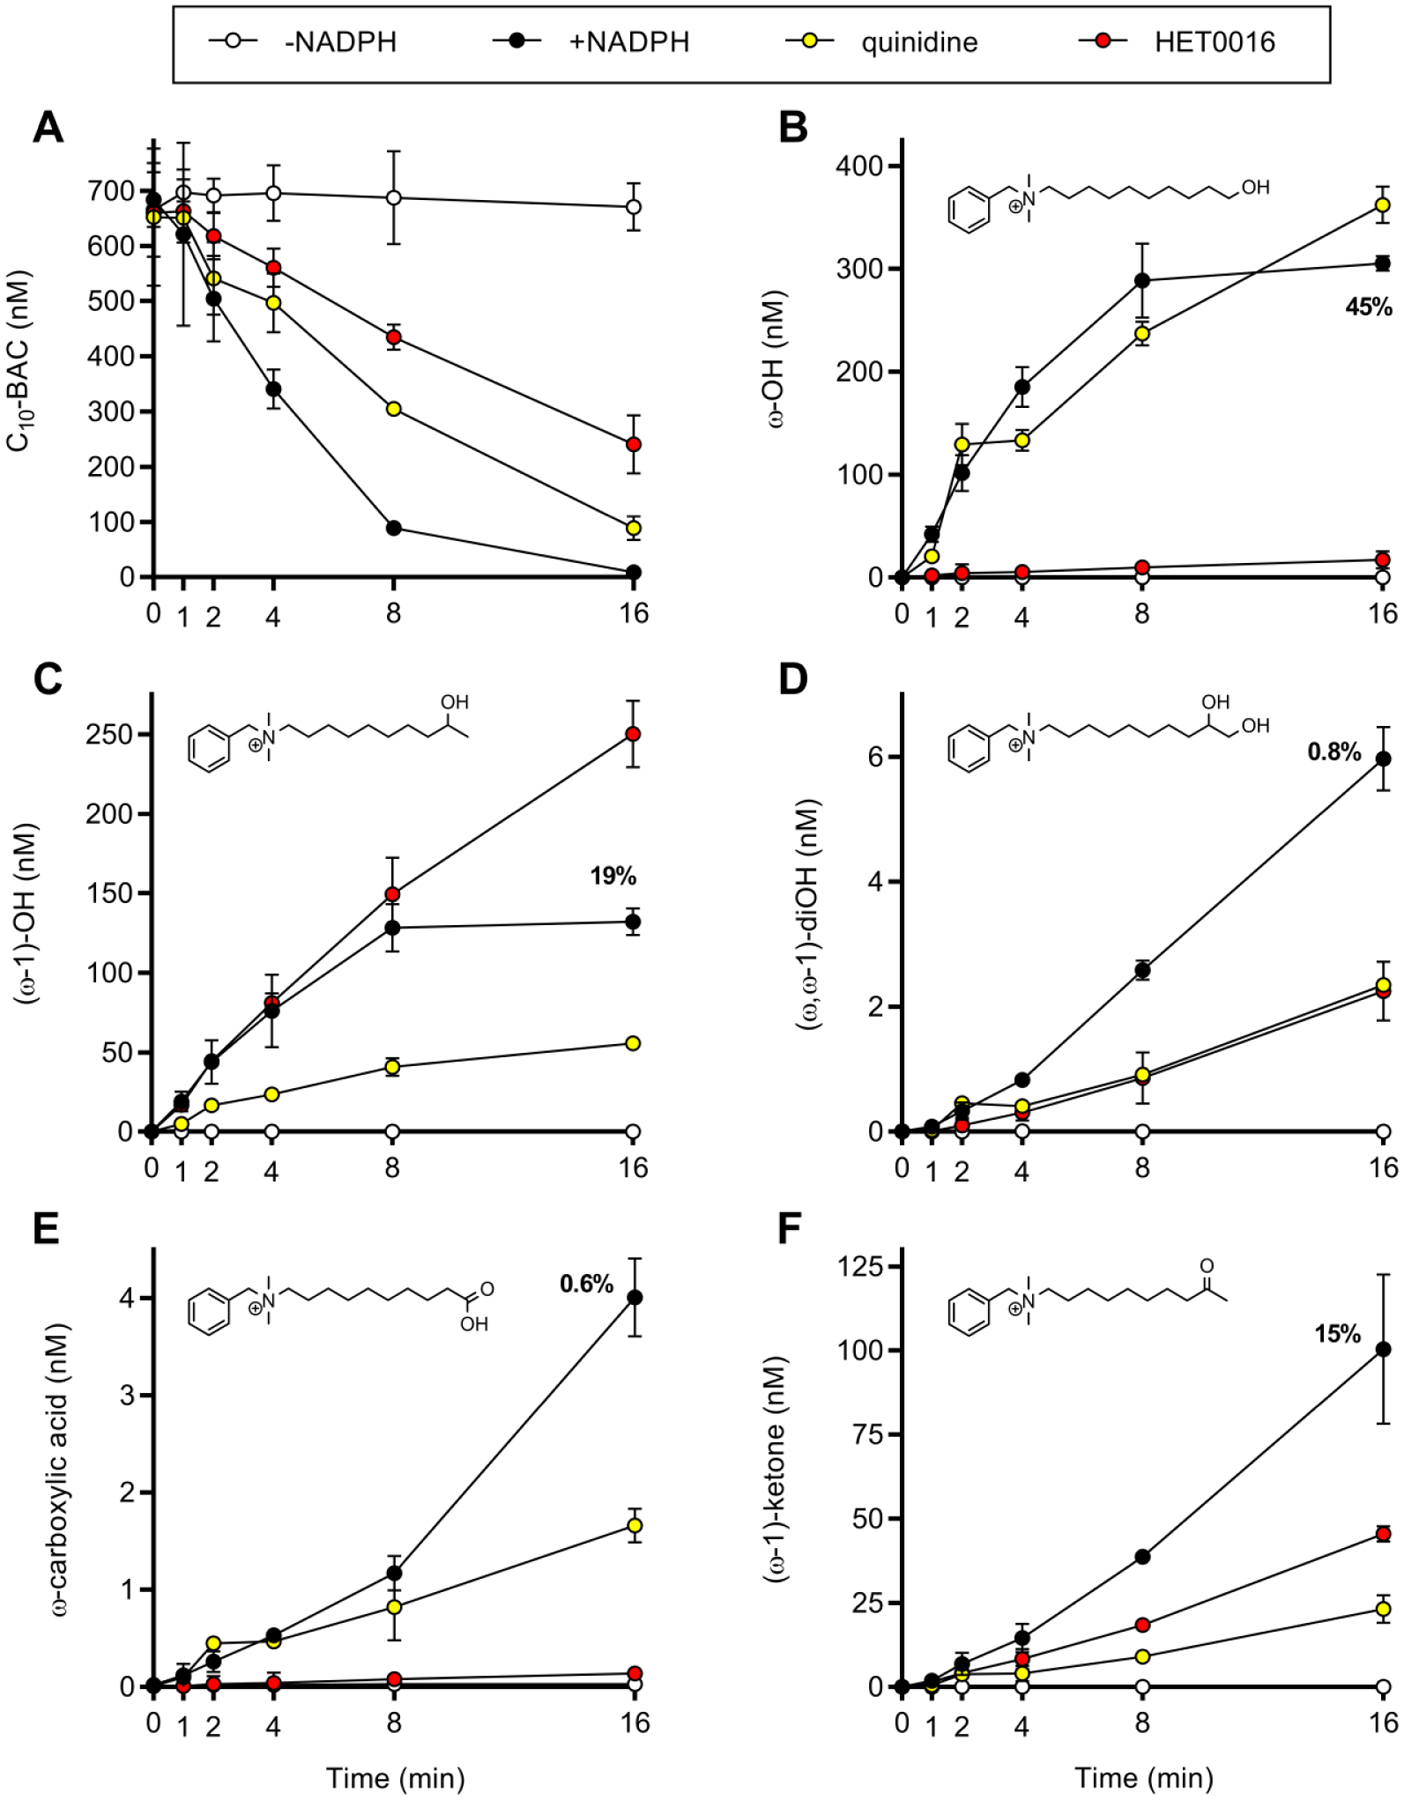
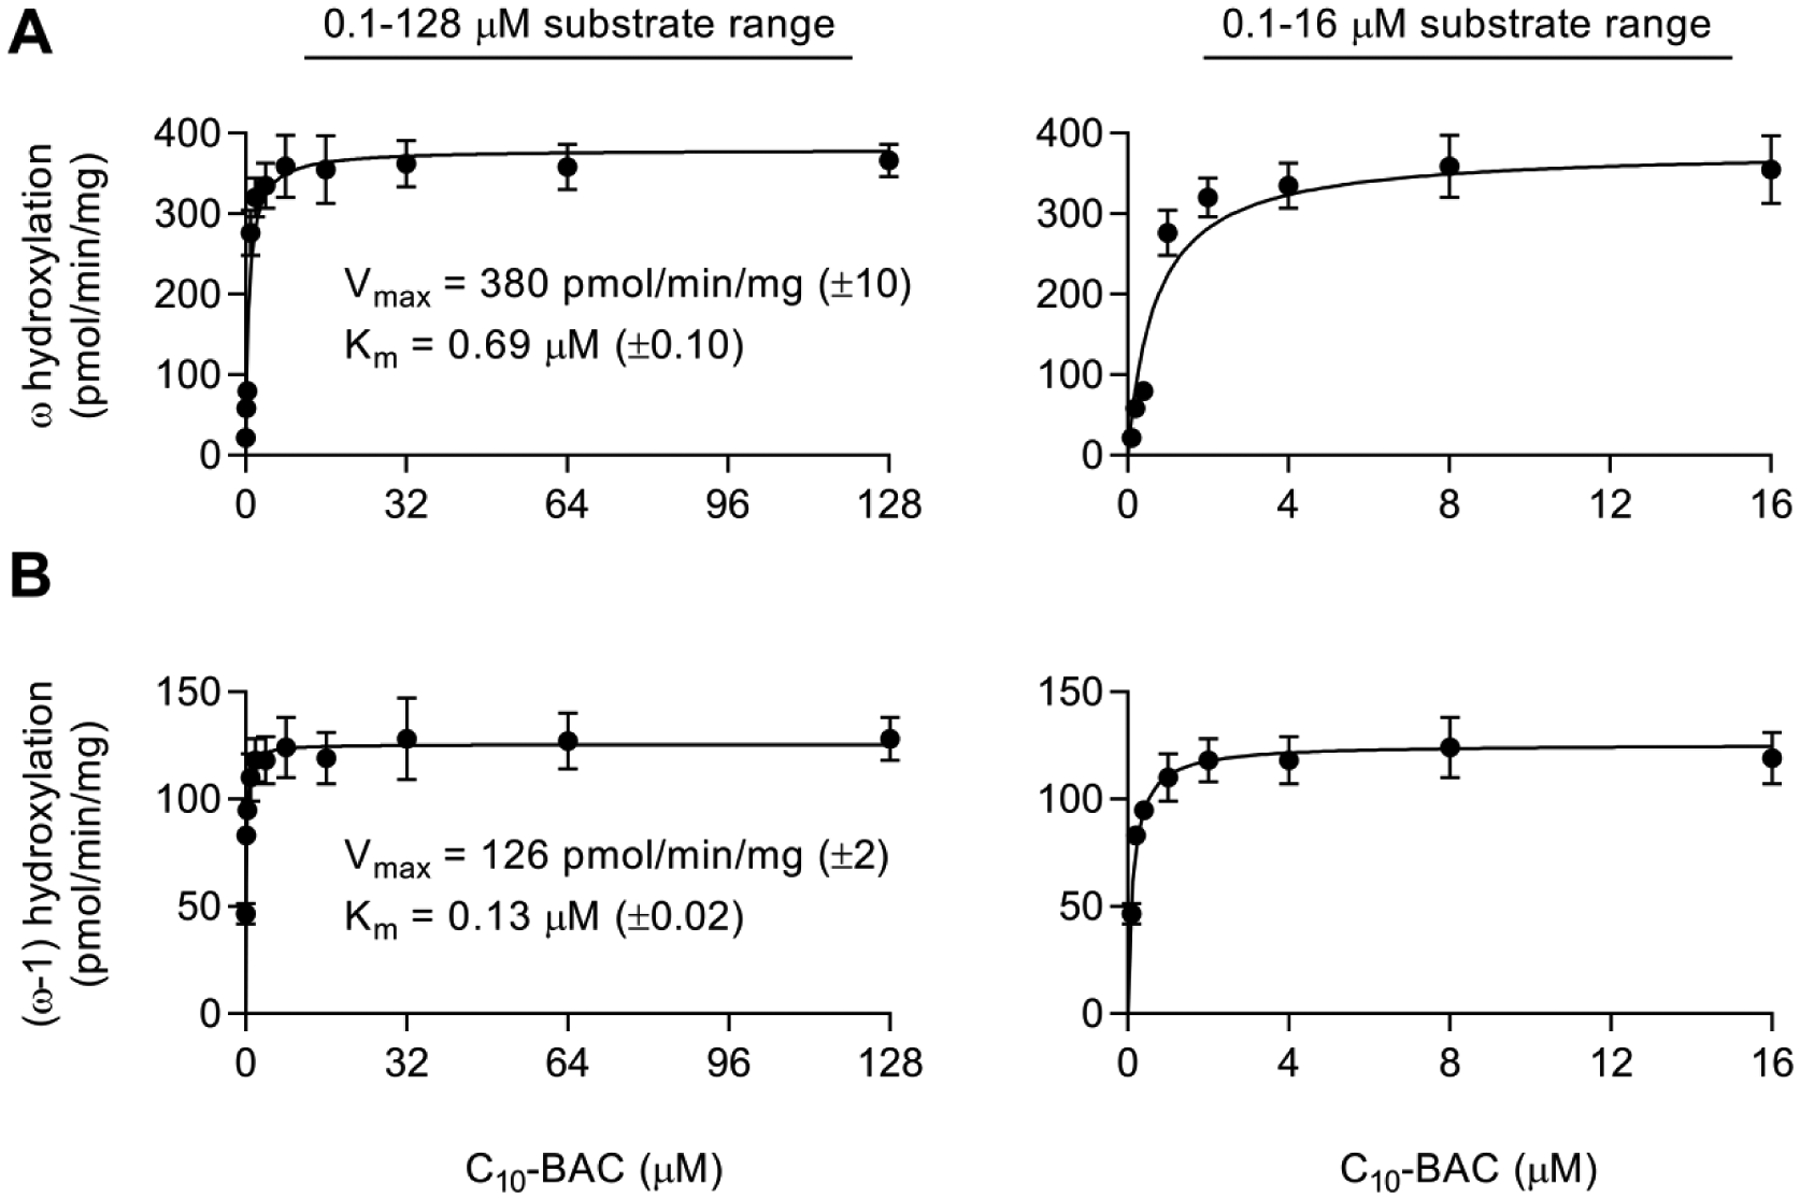
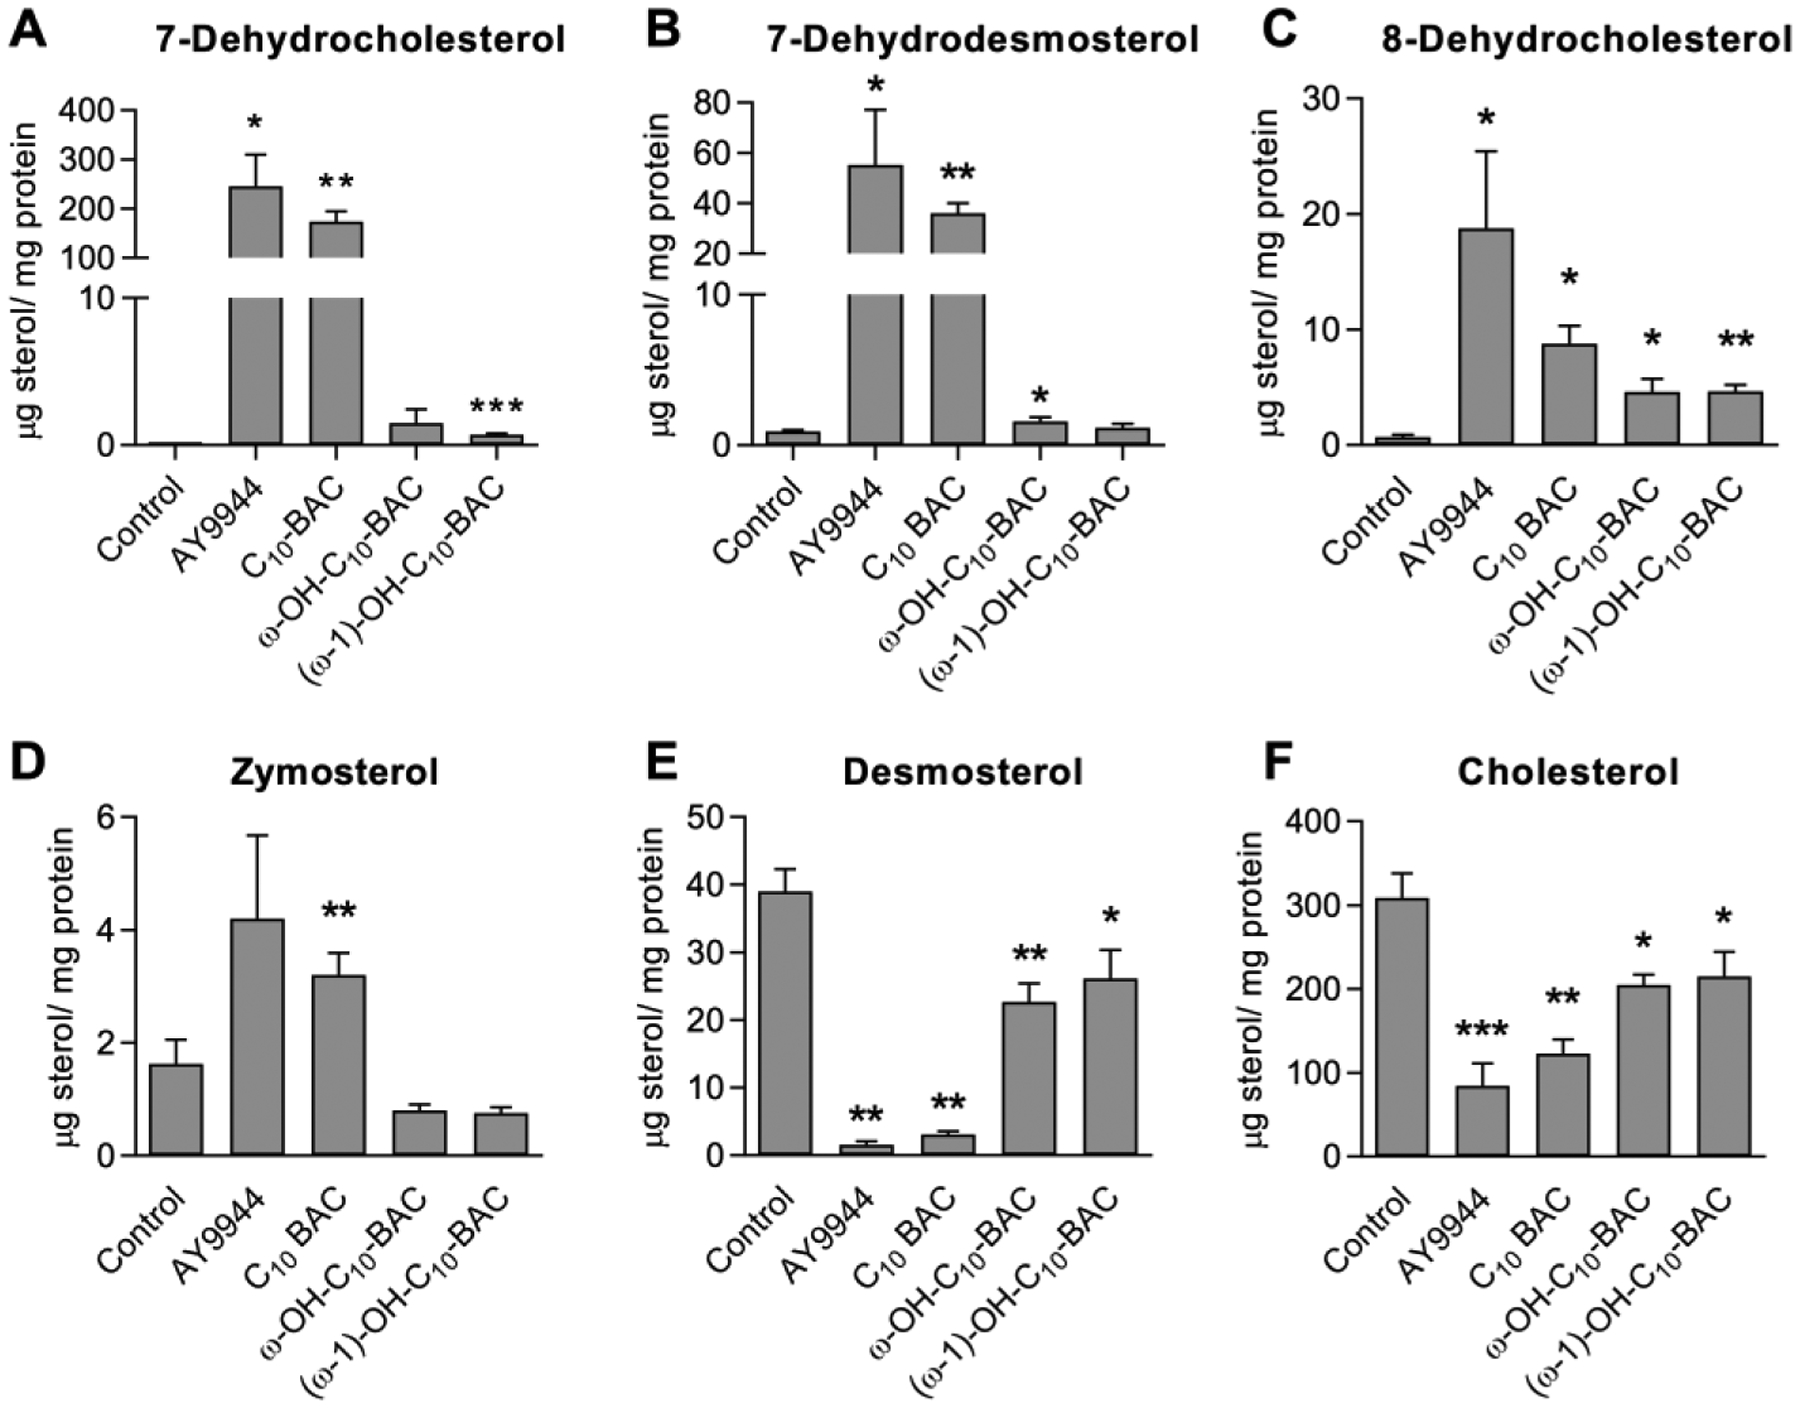
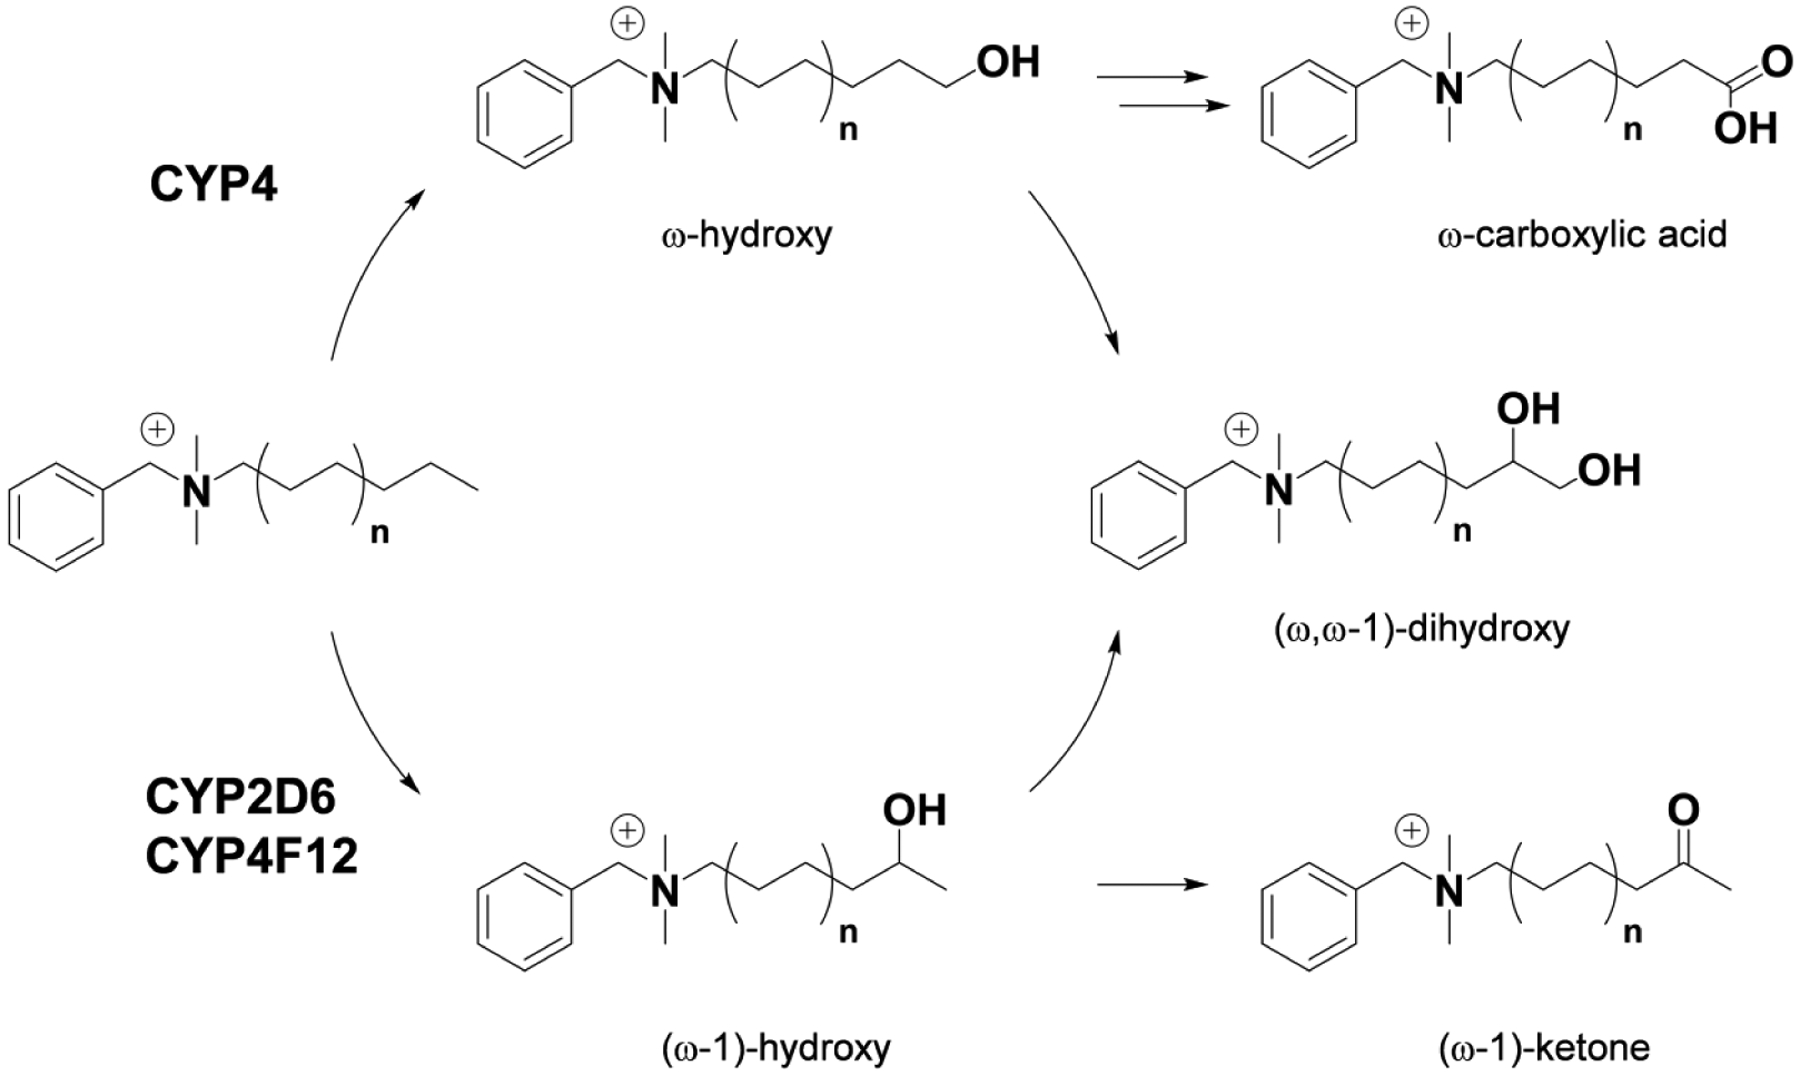
Benzalkonium chlorides (BACs) are widely used as disinfectants in cleaning products, medical products, and the food processing industry. Despite a wide range of reported toxicities, limited studies have been conducted on the metabolism of these compounds in animal models and none in human-derived cells or tissues. In this work, we report on the metabolism of BACs in human liver microsomes (HLM) and by recombinant human hepatic cytochrome P450 (CYP) enzymes. BAC metabolism in HLM was NADPH-dependent and displayed apparent half-lives that increased with BAC alkyl chain length (C10 < C12 < C14 < C16), suggesting enhanced metabolic stability of the more lipophilic, longer chain BACs. Metabolites of d7-benzyl labeled BAC substrates retained all deuteriums and there was no evidence of N-dealkylation. Tandem mass spectrometry fragmentation of BAC metabolites confirmed that oxidation occurs on the alkyl chain region. Major metabolites of C10-BAC were identified as ω-hydroxy-, (ω-1)-hydroxy-, (ω, ω-1)-diol-, (ω-1)-ketone-, and ω-carboxylic acid-C10-BAC by liquid chromatography-mass spectrometry comparison with synthetic standards. In a screen of hepatic CYP isoforms, recombinant CYP2D6, CYP4F2, and CYP4F12 consumed substantial quantities of BAC substrates and produced the major microsomal metabolites. The use of potent pan-CYP4 inhibitor HET0016, the specific CYP2D6 inhibitor quinidine, or both confirmed major contributions of CYP4- and CYP2D6-mediated metabolism in the microsomal disappearance of BACs. Kinetic characterization of C10-BAC metabolite formation in HLM demonstrated robust Michaelis-Menten kinetic parameters for ω-hydroxylation (Vmax = 380 pmol/min/mg, Km = 0.69 μM) and (ω-1)-hydroxylation (Vmax = 126 pmol/min/mg, Km = 0.13 μM) reactions. This work illustrates important roles for CYP4-mediated ω-hydroxylation and CYP2D6/CYP4-mediated (ω-1)-hydroxylation during the hepatic elimination of BACs, an environmental contaminant of emerging concern. Furthermore, we demonstrate that CYP-mediated oxidation of C10-BAC mitigates the potent inhibition of cholesterol biosynthesis exhibited by this short-chain BAC.


Figures

Figure 1.
Figure 1.. Chemical structures and microsomal stability of BACs.
(A) Chemical structures of BACs with 10, 12, 14, and 16 carbon alkyl chain lengths. (B) Time-courses of NADPH-dependent depletion of BACs (2 μM) incubated separately in HLM (1 mg/mL) out to 28 minutes. Data points represent the mean ± SD (n = 3). When not visible, error bars are contained within the data point.
Figure 2.
Figure 2.. BAC consumption by human recombinant CYP isoforms.
Recombinant CYP isoforms were screened for NADPH-dependent consumption of (A) C10-BAC (2 μM) and (B) C16-BAC (2 μM) in 30 minutes incubations with each individually-expressed CYP enzyme (50 nM P450). Refer to Materials and Methods for details on the commercially-available “Bactosomes” and “Supersomes” recombinant enzyme expression systems. Quantities represent the mean ± SD (n = 3). Bars colored magenta indicate statistically-significantly consumption of BAC substrate relative to the Control (without CYP) preparation: p ≤0.05 (*); p ≤0.01 (**); p ≤0.001 (***).
Figure 3.
Figure 3.. Hydroxylated BAC metabolites produced in HLM.
LC-MS extracted ion chromatograms displaying +1O metabolites of (A) d0-BACs and (B) d7-BACs produced by individually incubating each substrate (2 μM) in HLM (0.5 mg/mL) for 30 minutes with NADPH. Extracted theoretical m/z values (±0.005 m/z) of BAC +1O metabolites are indicated in each figure legend. Metabolite peaks are labeled with retention times and observed m/z values.
Figure 4.
Figure 4.. Identification of C10-BAC microsomal metabolites.
LC-MS extracted ion chromatograms displaying (A) +1O, (B) +2O, (C) +1O, −2H, and (D) +2O, −2H metabolites of C10-BAC produced by metabolism of C10-BAC (2 μM) in NADPH-supplemented HLM (0.5 mg/mL) after 30 minutes. Extracted theoretical m/z values (±0.005 m/z) of the specified metabolites are noted in each chromatogram. The identities of several metabolites were confirmed by comparison with synthetic standards prepared in-house and these analyte peaks are labeled with retention times and metabolite structures.
Figure 5.
Figure 5.. Inhibitory effects of quinidine and HET0016 on BAC consumption in HLM and recombinant CYPs.
(A) Inhibition of BAC (2 μM) consumption in NADPH-supplemented HLM (0.5 mg/mL) by quinidine (1 μM; CYP2D6 inhibitor) and HET0016 (1 μM; CYP4 inhibitor) applied individually or in combination. Incubation times were 2, 5, 10, and 20 minutes, respectively, for C10-, C12-, C14-, and C16-BAC substrates. (B) Inhibition of C16-BAC (2 μM) consumption in recombinant CYP incubations (2D6, 4F2, and 4F12; 50 nM P450 enzyme) and in HLM (0.5 mg/mL) by the inhibitors quinidine (1 μM) and HET0016 (1 μM) in 20 minute incubations. Note, in panels A and B, the rightmost groups are identical experiments performed in HLM on different days to assess reproducibility of the inhibitor effects upon C16-BAC consumption. Each quantity represents the mean ± SD (n = 3).
Figure 6.
Figure 6.. Inhibitory effects of quinidine and HET0016 on C10-BAC metabolite formation in HLM.
Time-courses of (A) C10-BAC (680 nM) depletion and (B) ω-hydroxy, (C) (ω−1)-hydroxy, (D) (ω, ω−1)-dihydroxy, (E) ω-carboxylic acid, and (F) (ω−1)-ketone metabolite formation in HLM (0.2 mg/mL) were measured in the absence (open circles) and presence (closed circles) of NADPH out to 16 minutes. The 16-minute data points for the +NADPH condition are annotated with the percentage amount of metabolite formed relative to the amount of C10-BAC consumed at 16 minutes. Time-courses were also performed in the presence of quinidine (1 μM; CYP2D6 inhibitor; yellow circles) and HET0016 (1 μM; CYP4 inhibitor; red circles). Data points represent the mean ± SD (n = 3). When not visible, error bars are contained within the data point.
Figure 7.
Figure 7.. C10-BAC ω- and (ω−1)-hydroxylation rates in HLM.
Initial rates of C10-BAC (A) ω-hydroxylation and (B) (ω−1)-hydroxylation in NADPH-supplemented HLM (0.04 mg/mL) determined at substrate concentrations of 0.1, 0.2, 0.4, 1, 2, 4, 8, 16, 32, 64, and 128 μM. In panels A and B, the left-side graphs display rates obtained from the full substrate concentration range and the right-side graphs display the rates of only the lower substrate concentrations (0.1–16 μM). Michaelis-Menten kinetic parameters (Vmax, Km) were estimated by nonlinear regression. Data points represent the mean ± SD (n = 3). When not visible, error bars are contained within the data point.
Figure 8.
Figure 8.. Cellular sterol levels following exposure to AY9944, C10-BAC, and ω- and (ω−1)-hydroxylated C10-BAC metabolites.
Neuro2a cells were exposed to 100 nM test compound over 72 hours in serum-free media: Control (0.1% DMSO), AY9944 (positive control; DHCR7 inhibitor), C10-BAC, ω-hydroxy C10-BAC, and (ω−1)-hydroxy C10-BAC. Levels of the indicated sterols in lipid extracts from treated cells were measured by LC-MS and normalized to protein content. Data represent the mean ± SD (n = 3). Statistical-significance is relative to the Control group: p ≤0.05 (*); p ≤0.01 (**); p ≤0.001 (***).
Figure 9.
Figure 9.. Proposed summary of BAC metabolism by hepatic CYP enzymes.
Metabolite structures were confirmed for C10-BAC (n=3) microsomal metabolism with authentic standards. Similar metabolism of longer alkyl chain BAC substrates (n=4, 5, and 6) and the assignment of the responsible CYP isoforms is supported by recombinant enzyme experiments and inhibitor studies described herein.

References

    1. Neu TR (1996) Significance of bacterial surface-active compounds in interaction of bacteria with interfaces. Microbiological reviews 60, 151–166. - PMC - PubMed
    1. Kummerer K, Eitel A, Braun U, Hubner P, Daschner F, Mascart G, Milandri M, Reinthaler F, and Verhoef J (1997) Analysis of benzalkonium chloride in the effluent from European hospitals by solid-phase extraction and high-performance liquid chromatography with post-column ion-pairing and fluorescence detection. J Chromatogr A 774, 281–286. - PubMed
    1. Tezel U, Pierson JA, and Pavlostathis SG (2006) Fate and effect of quaternary ammonium compounds on a mixed methanogenic culture. Water research 40, 3660–3668. - PubMed
    1. Dean-Raymond D, and Alexander M (1977) Bacterial metabolism of quaternary ammonium compounds. Applied and environmental microbiology 33, 1037–1041. - PMC - PubMed
    1. Games LM, King JE, and Larson RJ (1982) Fate and Distribution of a Quaternary Ammonium Surfactant, Octadecyltrimethylammonium Chloride (Otac), in Wastewater-Treatment. Environ Sci Technol 16, 483–488.

Publication types

MeSH terms