. 2019 Nov 14;179(5):1191-1206.e21.
doi: 10.1016/j.cell.2019.10.028.

B Cells and T Follicular Helper Cells Mediate Response to Checkpoint Inhibitors in High Mutation Burden Mouse Models of Breast Cancer

Affiliations

B Cells and T Follicular Helper Cells Mediate Response to Checkpoint Inhibitors in High Mutation Burden Mouse Models of Breast Cancer

Daniel P Hollern et al. Cell. .

Abstract

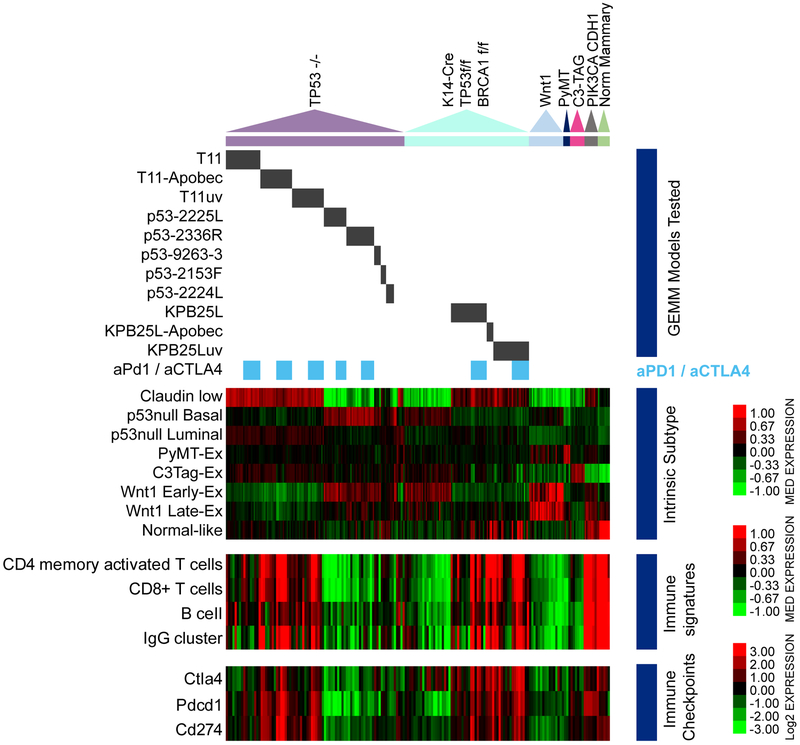
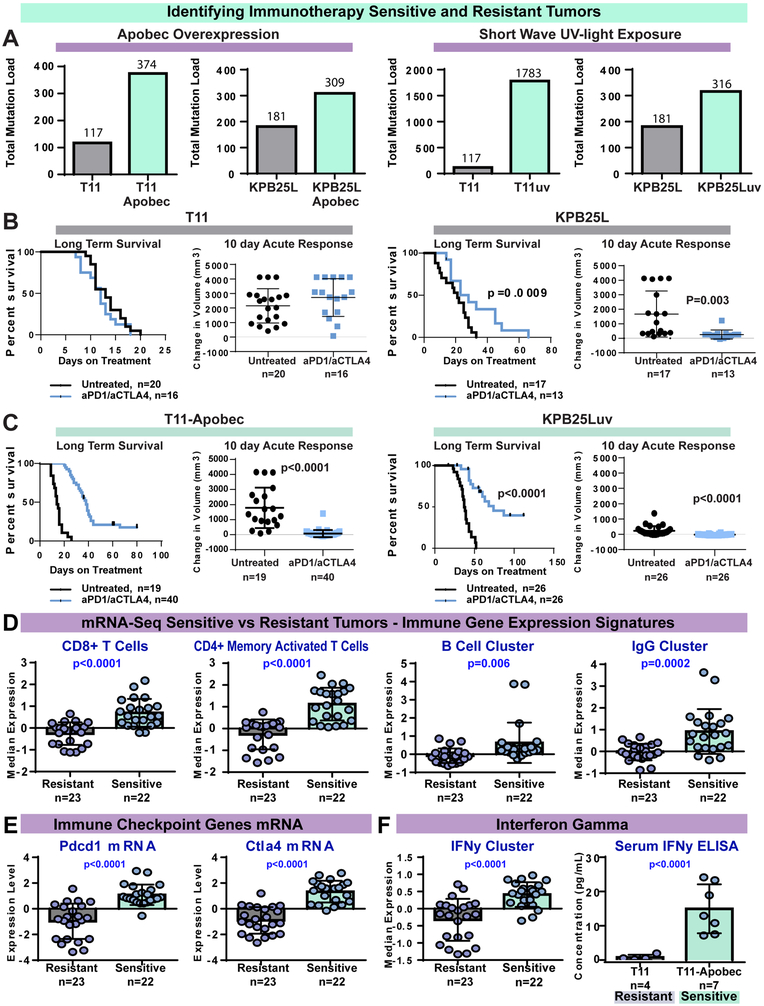
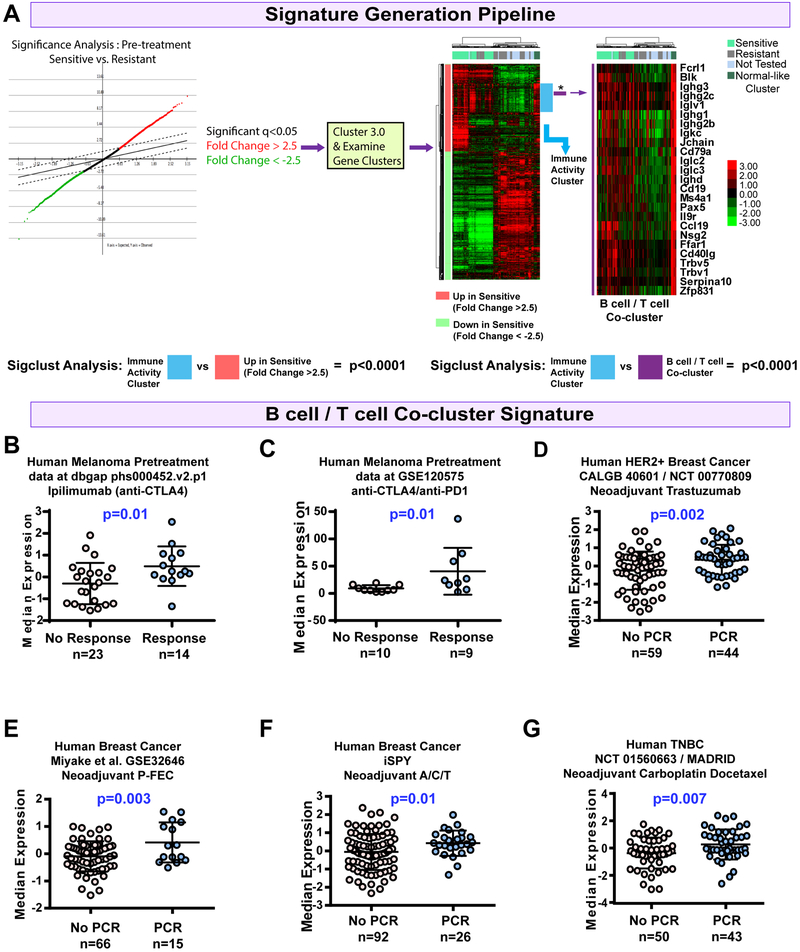
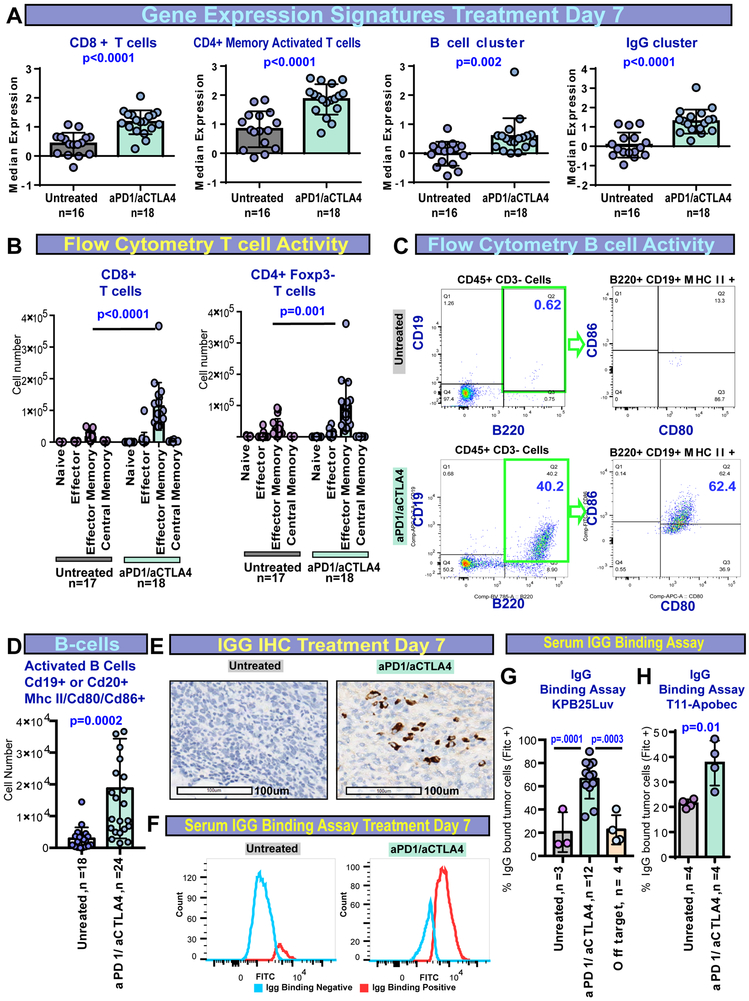
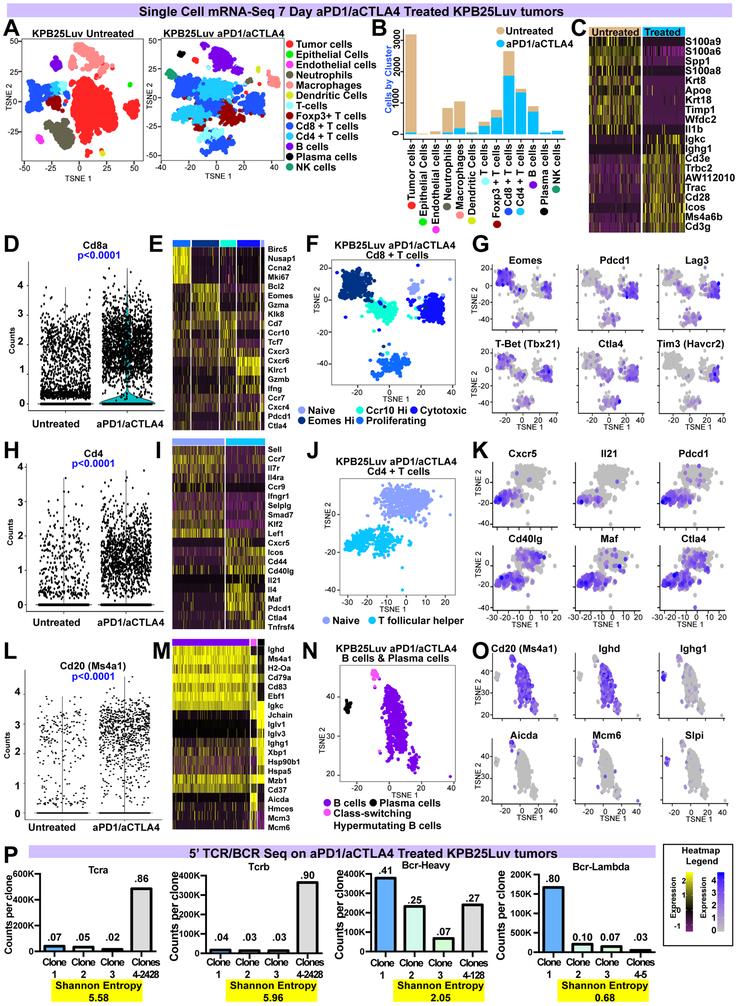
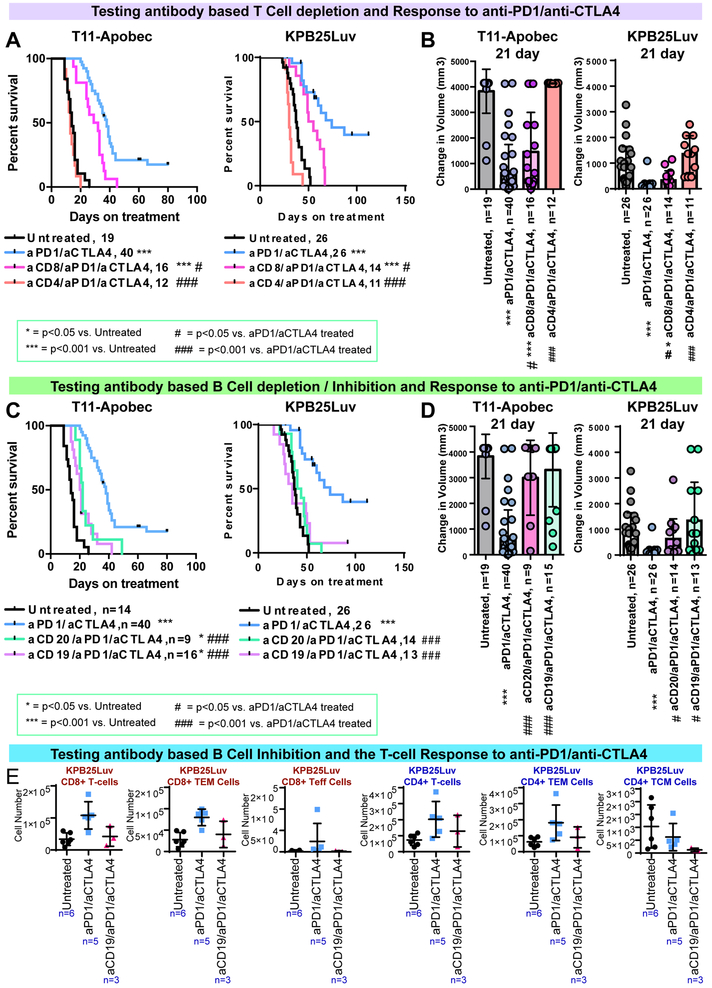
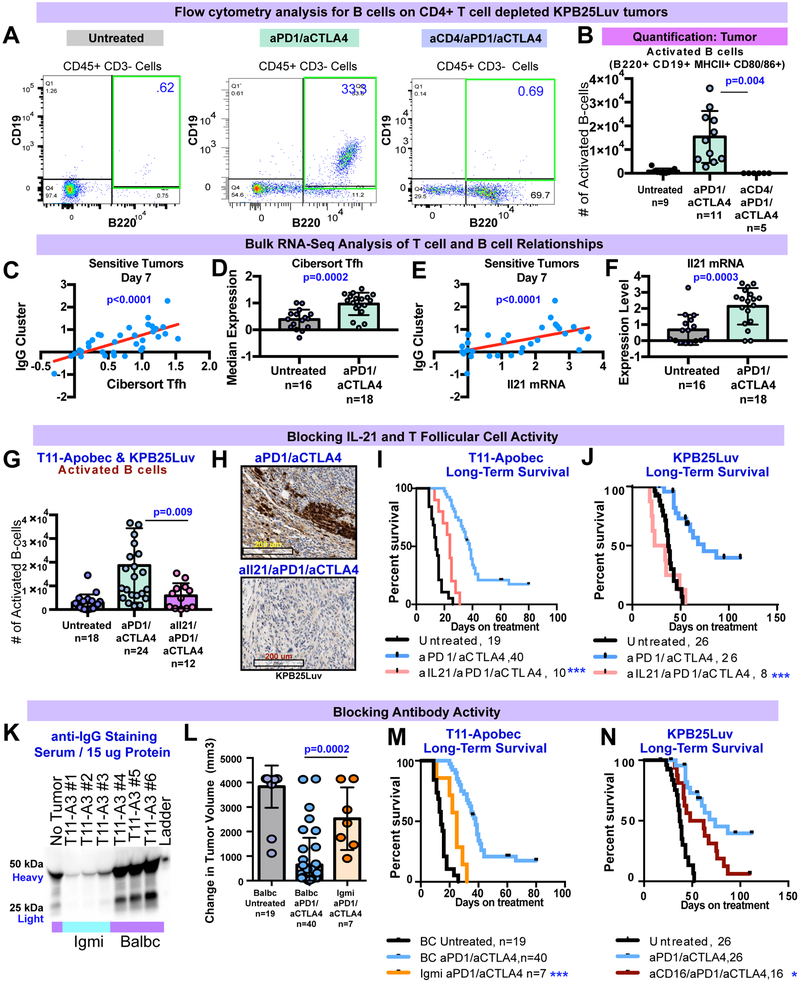
This study identifies mechanisms mediating responses to immune checkpoint inhibitors using mouse models of triple-negative breast cancer. By creating new mammary tumor models, we find that tumor mutation burden and specific immune cells are associated with response. Further, we developed a rich resource of single-cell RNA-seq and bulk mRNA-seq data of immunotherapy-treated and non-treated tumors from sensitive and resistant murine models. Using this, we uncover that immune checkpoint therapy induces T follicular helper cell activation of B cells to facilitate the anti-tumor response in these models. We also show that B cell activation of T cells and the generation of antibody are key to immunotherapy response and propose a new biomarker for immune checkpoint therapy. In total, this work presents resources of new preclinical models of breast cancer with large mRNA-seq and single-cell RNA-seq datasets annotated for sensitivity to therapy and uncovers new components of response to immune checkpoint inhibitors.

Keywords: B cells; CTLA4; PD1; T cells; TMB; breast cancer; genomics; immune checkpoints; immunotherapy; mouse models; tumor mutation burden.


Conflict of interest statement

Disclosure of Potential Conflicts of Interest

C.M.P is an equity stock holder and Board of Director Member of BioClassifier, LLC and GeneCentric Therapeutics. C.M.P and J.P. are also listed as an inventor on patent applications on the Breast PAM50. C.M.P, B.G.V., and J.P. are equity stock holders in GeneCentric Therapeutics.

Figures

Figure 1-
Figure 1-. Intrinsic tumor and immune cell gene expression features in mouse mammary tumor models.
Gene expression patterns of tumor and immune cell features. The triangles mark the position of major tumor models in the heatmaps. Black bars mark tumor lines from each model. Blue bars to the side note models in the treatment study. Below this, blue bars show samples getting anti-PD1/anti-CTLA4 therapy. The heatmaps show median expression values for subtype and immune cell signatures. The lower heatmap is expression values of immune checkpoint mRNAs as shown by the color bar.
Figure 2-
Figure 2-. Intentional elevation of tumor mutation burden sensitizes tumors to anti-PD1/anti-CTLA4 combination therapy.
(A) Left: Total somatic mutation burden in ectopic Apobec3 overexpressing lines and parental control lines. Right: somatic mutation burden from parental lines and lines exposed to short-wave ultra violet radiation. (B) Survival and 10 day acute response to anti-PD1/anti-CTLA4 immune checkpoint therapy in mice bearing tumors from parental T11 cell line and KPB25L cell lines. (C) Survival and acute response in T11-Apobec and KPB25Luv lines. (D) Immune cell gene expression signature expression levels. (E) Immune checkpoint gene mRNA expression levels. (F) Left, interferon gamma signature expression levels. Right, serum interferon gamma as measured by ELISA. In boxplots, bars mark the average and standard deviation. The p-values mark are two-tailed from unmatched T-tests. In Kaplan-Meier plots, p-values are from Log-rank (Mantel-Cox) tests. Signature levels are calculated as median value of genes within and mRNA is the median centered Log2 expression level.
Figure 3-
Figure 3-. Signature testing on human studies.
(A) Signature development pipeline. The immune activity signature is noted by the blue bar near the heatmap. The B cell/T cell co-cluster is marked by the purple bar and featured. (B) Boxplot for the B cell/T cell co-cluster in pretreatment samples from a human melanoma study of anti-CTLA4 therapy(Van Allen et al., 2015). (C) Boxplot of the B cell/T cell co-cluster in pretreatment samples from a human melanoma study of anti-PD1/ anti-CTLA4 therapy (Sade-Feldman et al., 2018). (D) Boxplot of the B cell/T cell co-cluster in pretreatment breast cancer samples from CALGB40601, trastuzumab arm (Tanioka et al., 2018). (E) Boxplot of the B cell/T cell co-cluster in pretreatment samples from the human breast cancer dataset GSE32646, P-FEC = neoadjuvant paclitaxel followed by 5-fluorouracil/epirubicin/cyclophosphamide(Miyake et al., 2012). (F) Boxplot of the B cell/T cell co-cluster in pretreatment samples from the human breast cancer iSPY clinical trial; A/C/T arm = Doxorubicin hydrochloride and cyclophosphamide, followed by treatment with paclitaxel(Esserman et al., 2012). (G) Boxplot of the B cell/T cell co-cluster in pretreatment samples from the TNBC NCT 01560663 clinical trial(Echavarria et al., 2018). Boxplots mark the mean and standard deviation. All panels except C, the p-values show two-tailed p-value from standard T-tests; in panel C the data is non-gaussian and thus a Mann-Whitney test was used.
Figure 4-
Figure 4-. Features of response to anti-PD1/anti-CTLA4 therapy in murine tumors.
(A) RNA-seq signatures for sensitive tumors at 7 days (5mm= day 0/ treatment initiation) without or with anti-PD1/anti-CTLA4 therapy. (B) Flow cytometry results for CD8+ cells and CD4+ using memory markers (Cd44, Cd62L). (C) Flow cytometry of tumor infiltrating B cells with or without ICI therapy. On the right shows staining for B cells gated for activation markers. (D) Quantification of flow cytometry for activated B cells (B220+, Cd19+ or Cd20+, MHC II +, Cd80+ or Cd86+). (E) IHC staining for IgG-kappa chain in KPB25Luv tumors. (F) IgG binding assay showing serum-IgG binding (Fitc+) to KPB25Luv cells. (G) Quantification of Fitc+ cells in IgG binding assay for KP25Luv cells and off-target binding. (H) Quantification of Fitc+ IgG binding assay for T11-Apobec cells following reabsorption on off-target cells. In boxplots, bars signify the mean and standard deviation. The p-values are two-tailed from unmatched T-tests. All tumors collected after 7days of treatment or non-treatment.
Figure 5-
Figure 5-. Single cell RNA-seq of KPB25Luv tumors with or without anti-PD1/anti-CTLA4 therapy.
(A) TSNE analysis of cells that passed quality checks in KPB25Luv tumors. Cells/clusters are color coded by the major cell type found.(B) The distribution of cell types between treated and non-treated tumor cells. (C) Heatmap of mRNA variance between treated and non-treated tumor cells. (D) Violin plot of Cd8a mRNA levels. (E) Heatmap of significant genes (plus Pdcd1, Ctla4) in clusters of ICI treated CD8+ T cells. (F) Classification of ICI treated CD8+ T cell clusters. Classes are coded to the heatmap in E. (G) Feature plot showing expression of key genes across CD8+ T cell clusters. (H) Violin plot of Cd4 mRNA levels. (I) Heatmap of significant genes(plus Ctla4) in clusters of ICI treated CD4+ T cells (n=20) (J) Classification of ICI treated CD4+ T cell clusters. Classes are coded to the heatmap in I. (K) Feature plot showing expression of key genes across CD4+ T cell clusters. (L) Violin plot of Cd20 mRNA levels.(M) Heatmap of significant genes in clusters of ICI treated B cells (n=20). (N) Classification of ICI treated B cell clusters. Classes are coded to the heatmap in M. (O) Feature plot showing expression of key markers in B cell clusters. (P) Results of 5’ TCR/BCR sequencing. In bar-plots, read counts for each clone is shown along with the calculated Shannon entropy (where higher values indicate high diversity/low clonality). Above each bar, the percent of all reads occupied by a clone(s). Heatmap values are depicted in the legend. Violin plots mark the mean and SEM. Markers were identified using Seurat and Wilcoxon rank sum testing.
Figure 6-
Figure 6-. Immune cell depletion of key immune cell populations during immune checkpoint therapy.
(A) Survival for mice given anti-PD1/anti-CTLA4 therapy with anti-Cd4 or anti-Cd8 antibodies (B) 21 day acute response for mice given anti-PD1/anti-CTLA4 with anti-Cd4 or anti-Cd8 antibodies. (C) Survival for mice given anti-PD1/anti-CTLA4 therapy with anti-Cd19 or anti-Cd20 antibodies (D) 21 day acute response for mice given anti-PD1/anti-CTLA4 with anti-Cd19 or anti-Cd20 antibodies. (E) Flow cytometry results for T cell subsets after 7days of aPD1/aCTLA4 therapy with/without anti-CD19 based B cell inhibition. In Kaplan-Meier plots, p-value show results of Log-rank (Mantel-Cox) tests. Boxplots show the mean and standard deviation. The p-values are two-tailed from unmatched T tests.
Figure 7-
Figure 7-. Testing B Cell Activation and IgG Functionality during immune checkpoint therapy.
(A) Flow cytometry for B cells in KPB25Luv tumors after 7 days of ICI and CD4+ T cell depletion. (B) Quantification of results from A. (C) X-Y plot of IgG and CIBERSORT Tfh T cell signatures in mRNA-seq of sensitive tumors at day 7. (D) Boxplot of CIBERSORT Tfh T cell signature levels in sensitive tumors (mRNA-seq) at day 7. (E) X-Y plot of IgG signature and Il21 mRNA in mRNA-seq of sensitive tumors at day 7. (F) Boxplot of Il21 mRNA levels in sensitive tumors (mRNA-seq) at day 7. (G) Flow cytometry results for activated B cells in T11-Apobec & KPB25Luv tumors during Tfh/IL21 blockade. (H) IHC staining for IgG-kappa chain in KPB25Luv tumors during Tfh/IL21 blockade. (I) Survival for T11-Apobec bearing mice during ICI therapy and Tfh/IL21 blockade. (J) Survival for KPB25Luv bearing mice during ICI therapy and Tfh/IL21 blockade. (K) Western blot for serum IgG in Igmi and Balbc mice with T11-Apobec tumors. The blue bars mark Igmi mouse sera, purple note Balbc sera. (L) 21 day acute response in Igmi and Balbc control mice with T11-Apobec tumors. (M) Survival of Igmi mice withT11-Apobec tumors and treated with anti-PD1/anti-CTLA4 therapy in contrast to Balbc controls. (N) Survival in KPB25Luv tumor bearing mice treated with ICI therapy or ICI therapy with CD16/32 blockade . In Kaplan-Meier plots, p-values are from Log-rank (Mantel-Cox) tests. Boxplots show the mean and standard deviation. The p-values are two-tailed from standard T-tests. In X-Y plots, p-values were determined by linear regression analysis. The asterisks denote significance (***, p<0.0001, *, P<0.05).

References

    1. An Y, Adams JR, Hollern DP, Zhao A, Chang SG, Gams MS, Chung PE, He X, Jangra R, and Shah JS (2018). Cdh1 and Pik3ca Mutations Cooperate to Induce Immune-Related Invasive Lobular Carcinoma of the Breast. Cell reports 25, 702–714. e706. - PMC - PubMed
    1. Bindea G, Mlecnik B, Tosolini M, Kirilovsky A, Waldner M, Obenauf AC, Angell H, Fredriksen T, Lafontaine L, and Berger A (2013). Spatiotemporal dynamics of intratumoral immune cells reveal the immune landscape in human cancer. Immunity 39, 782–795. - PubMed
    1. Bischof J, and Ibrahim SM (2016). bcRep: R package for comprehensive analysis of B cell receptor repertoire data. PLoS One 11, e0161569. - PMC - PubMed
    1. Bolotin DA, Poslavsky S, Mitrophanov I, Shugay M, Mamedov IZ, Putintseva EV, and Chudakov DM (2015). MiXCR: software for comprehensive adaptive immunity profiling. Nature methods 12, 380–381. - PubMed
    1. Budczies J, Seidel A, Christopoulos P, Endris V, Kloor M, Gyorffy B, Seliger B, Schirmacher P, Stenzinger A, and Denkert C (2018). Integrated analysis of the immunological and genetic status in and across cancer types: impact of mutational signatures beyond tumor mutational burden. OncoImmunology, 1–13. - PMC - PubMed

Publication types

MeSH terms