. 2020 Jan 24;17(1):016036.
doi: 10.1088/1741-2552/ab581a.

Open source silicon microprobes for high throughput neural recording

Affiliations

Open source silicon microprobes for high throughput neural recording

Long Yang et al. J Neural Eng. .

Abstract

Objective: Microfabricated multielectrode arrays are widely used for high throughput recording of extracellular neural activity, which is transforming our understanding of brain function in health and disease. Currently there is a plethora of electrode-based tools being developed at higher education and research institutions. However, taking such tools from the initial research and development phase to widespread adoption by the neuroscience community is often hindered by several obstacles. The objective of this work is to describe the development, application, and open dissemination of silicon microprobes for recording neural activity in vivo.

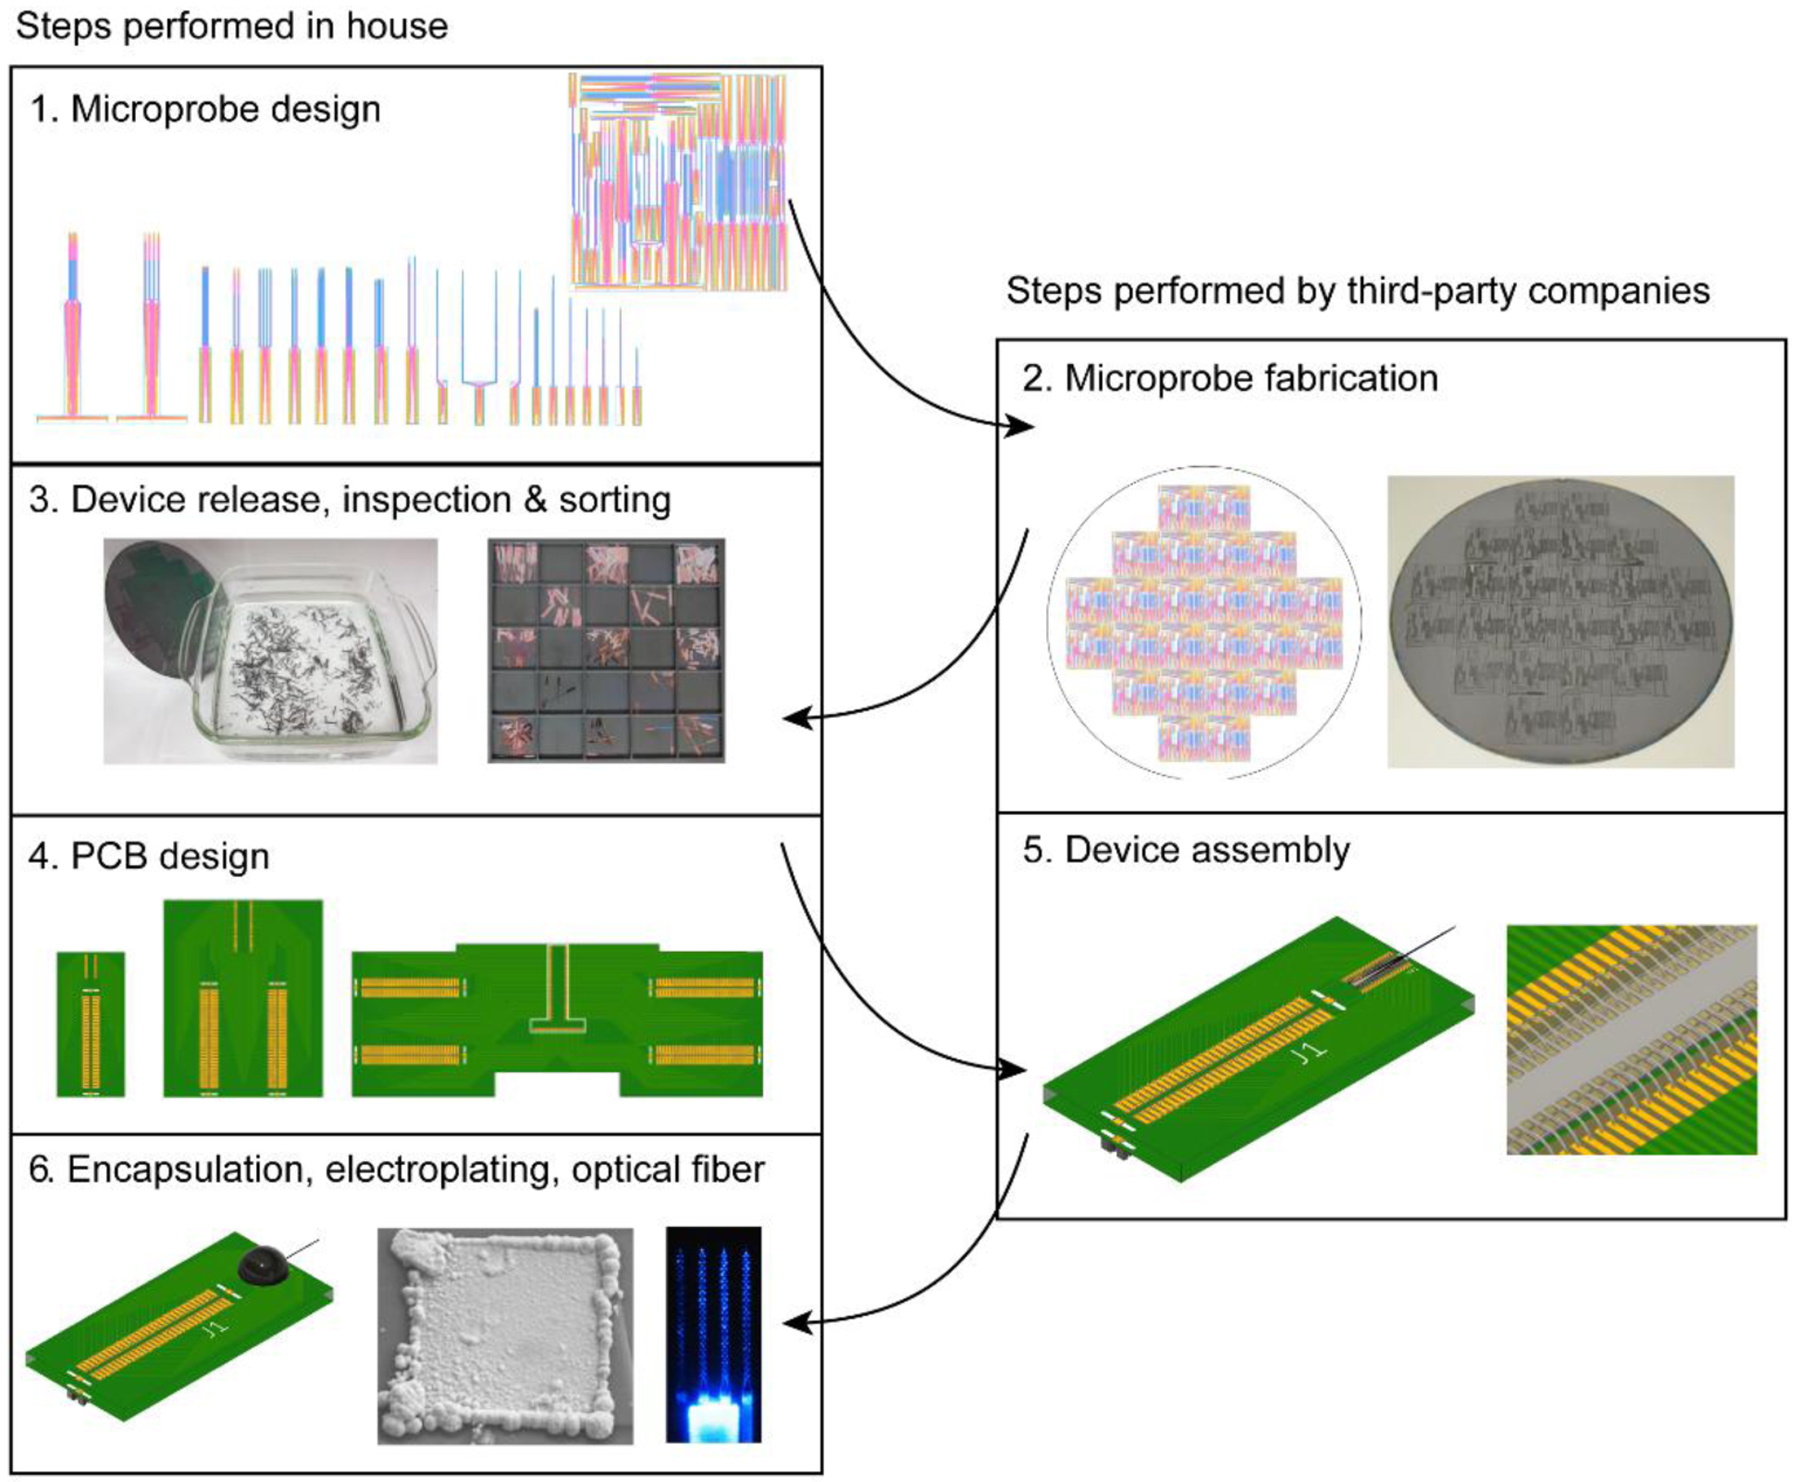
Approach: We propose an open source dissemination platform as an alternative to commercialization. This framework promotes recording tools that are openly and inexpensively available to the community. The silicon microprobes are designed in house, but the fabrication and assembly processes are carried out by third party companies. This enables mass production, a key requirement for large-scale dissemination.

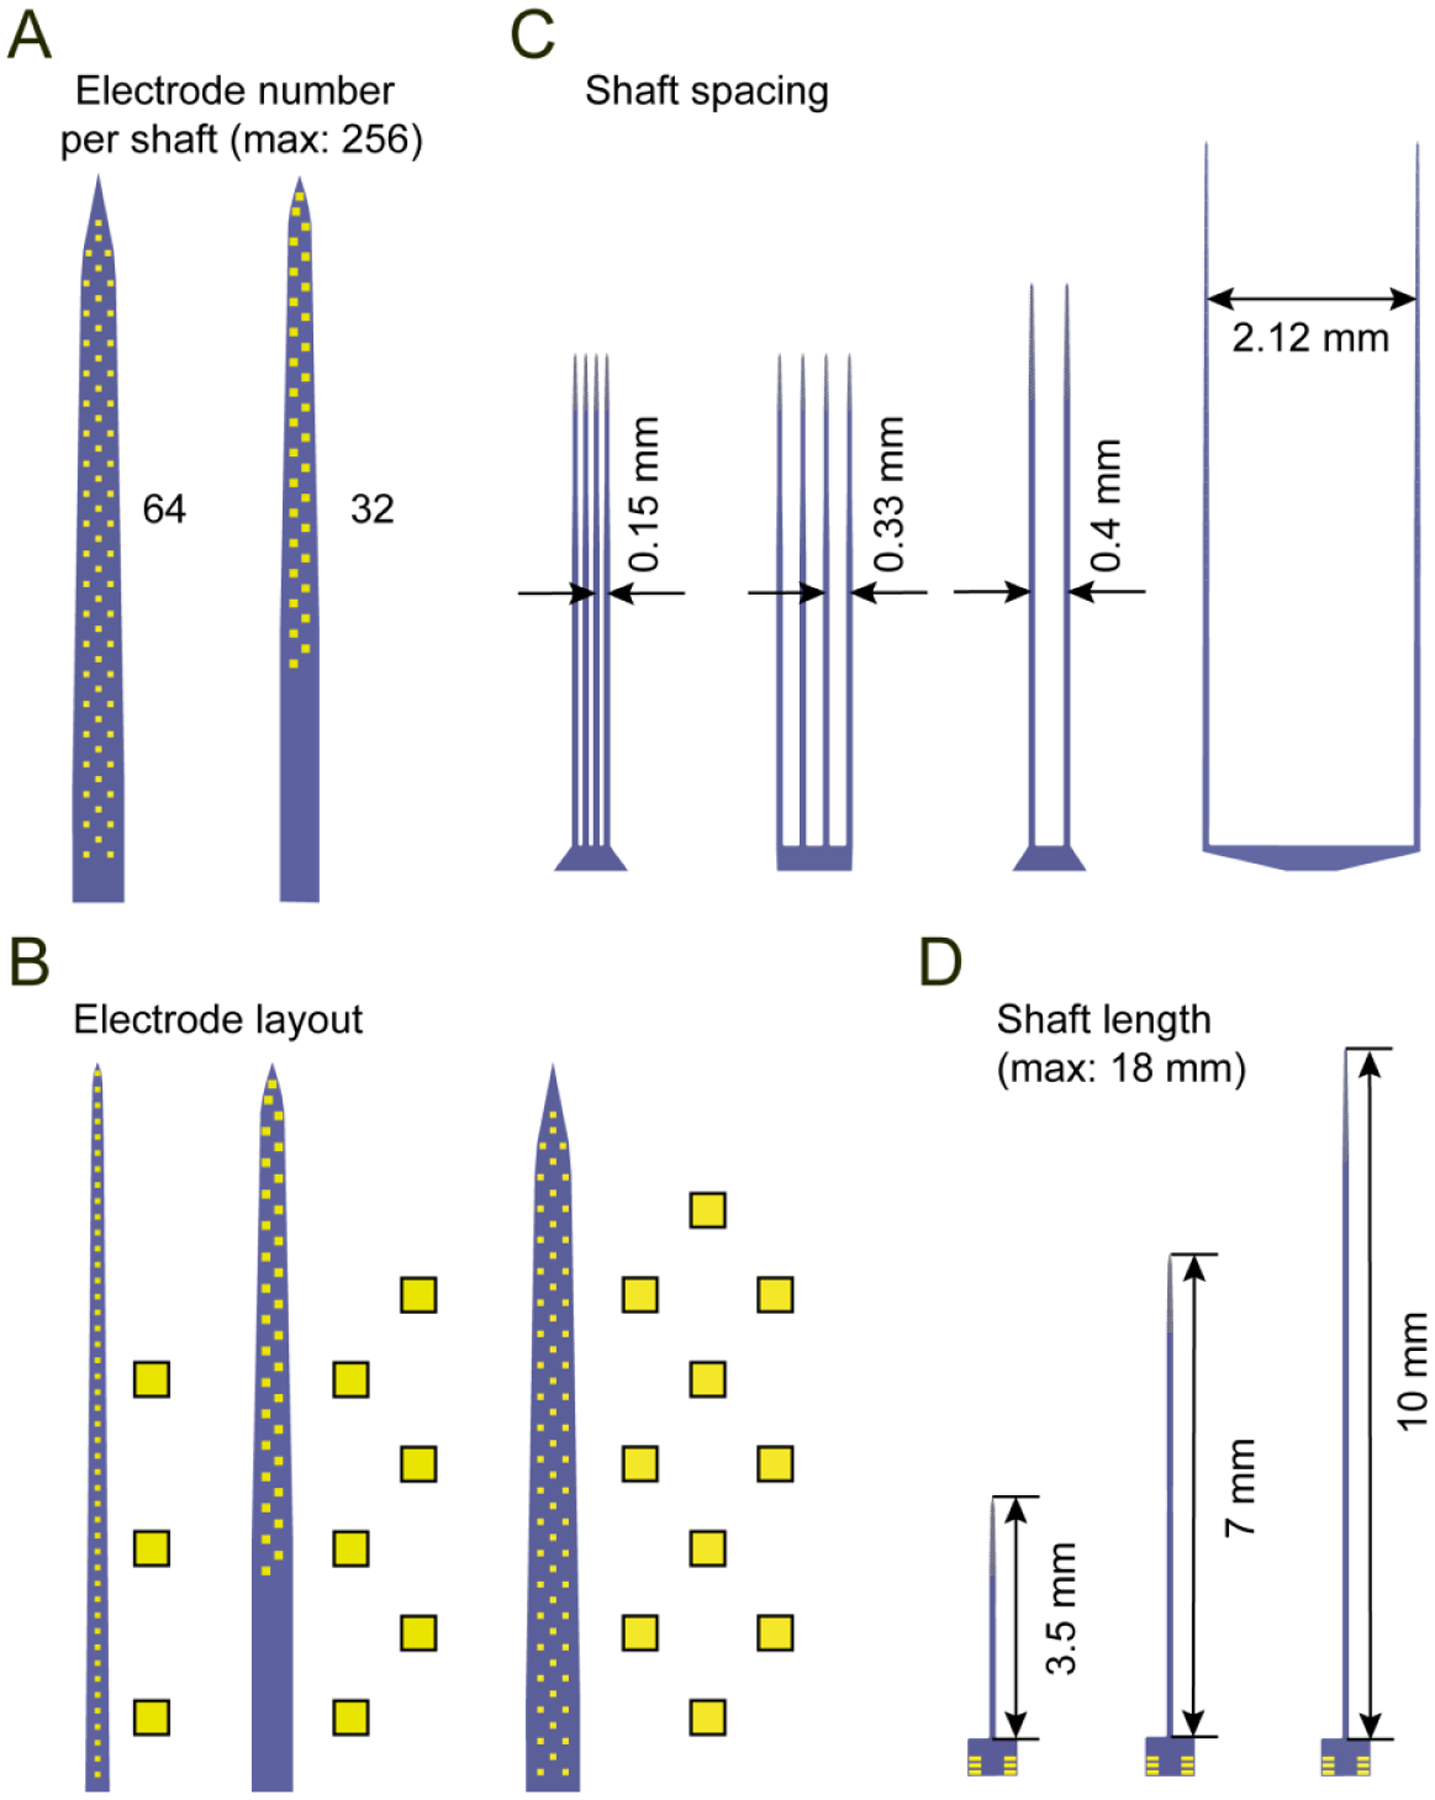
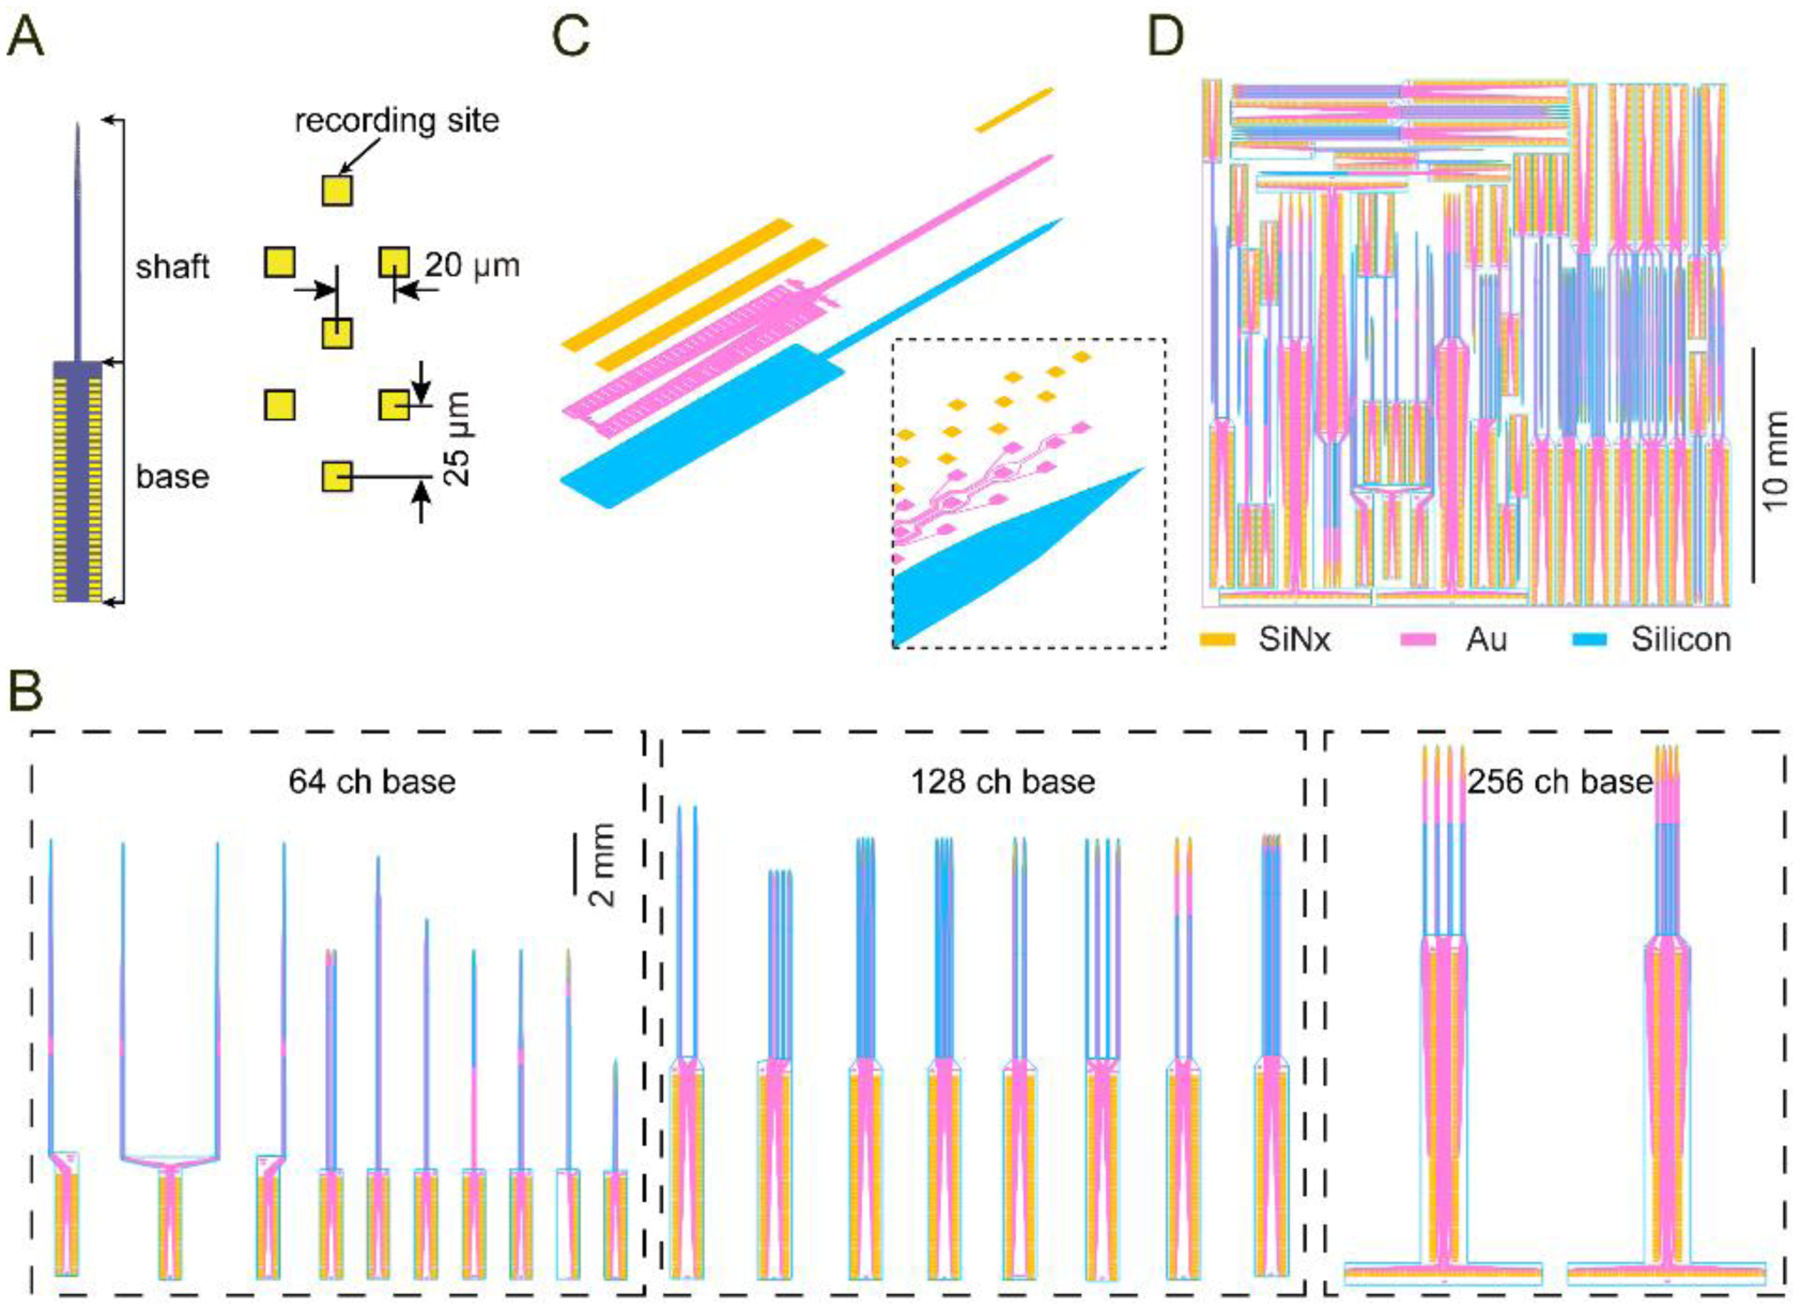
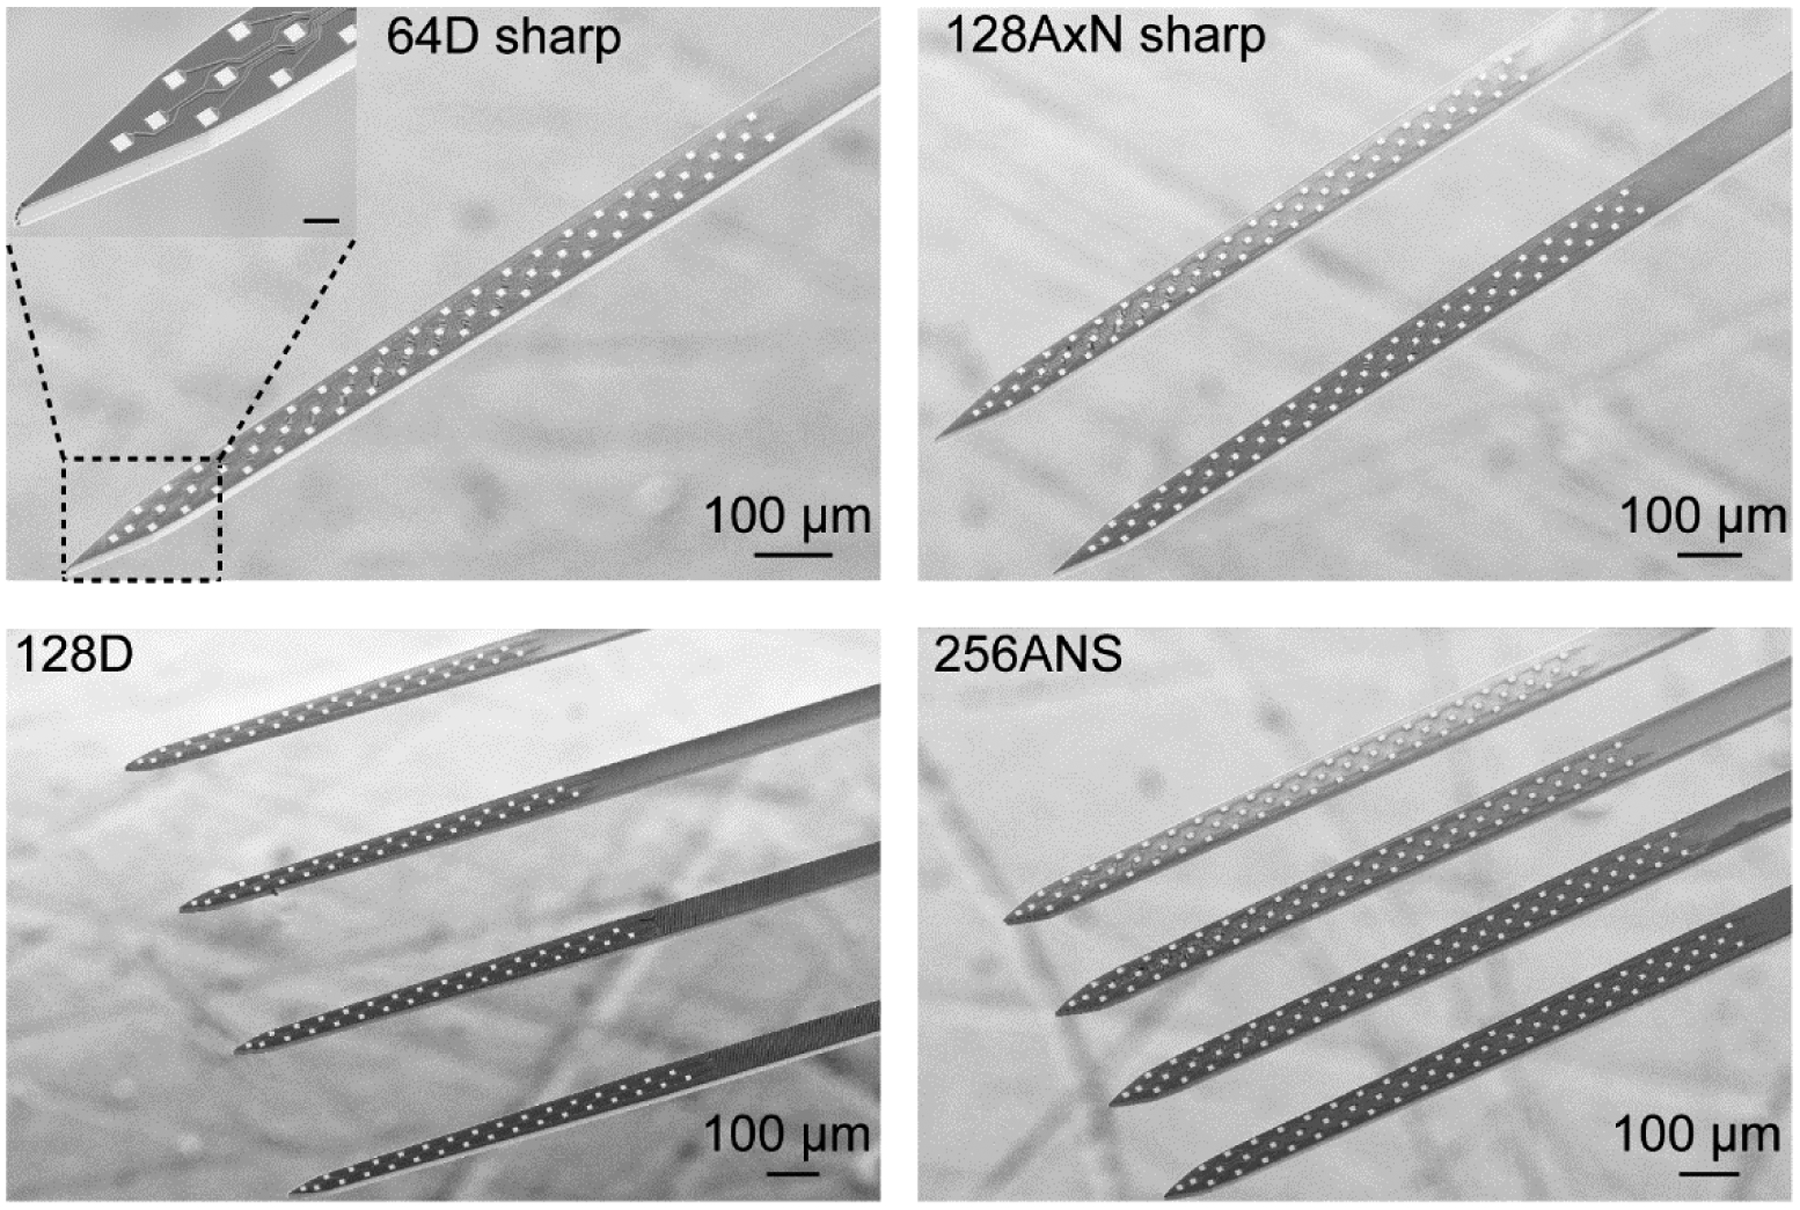
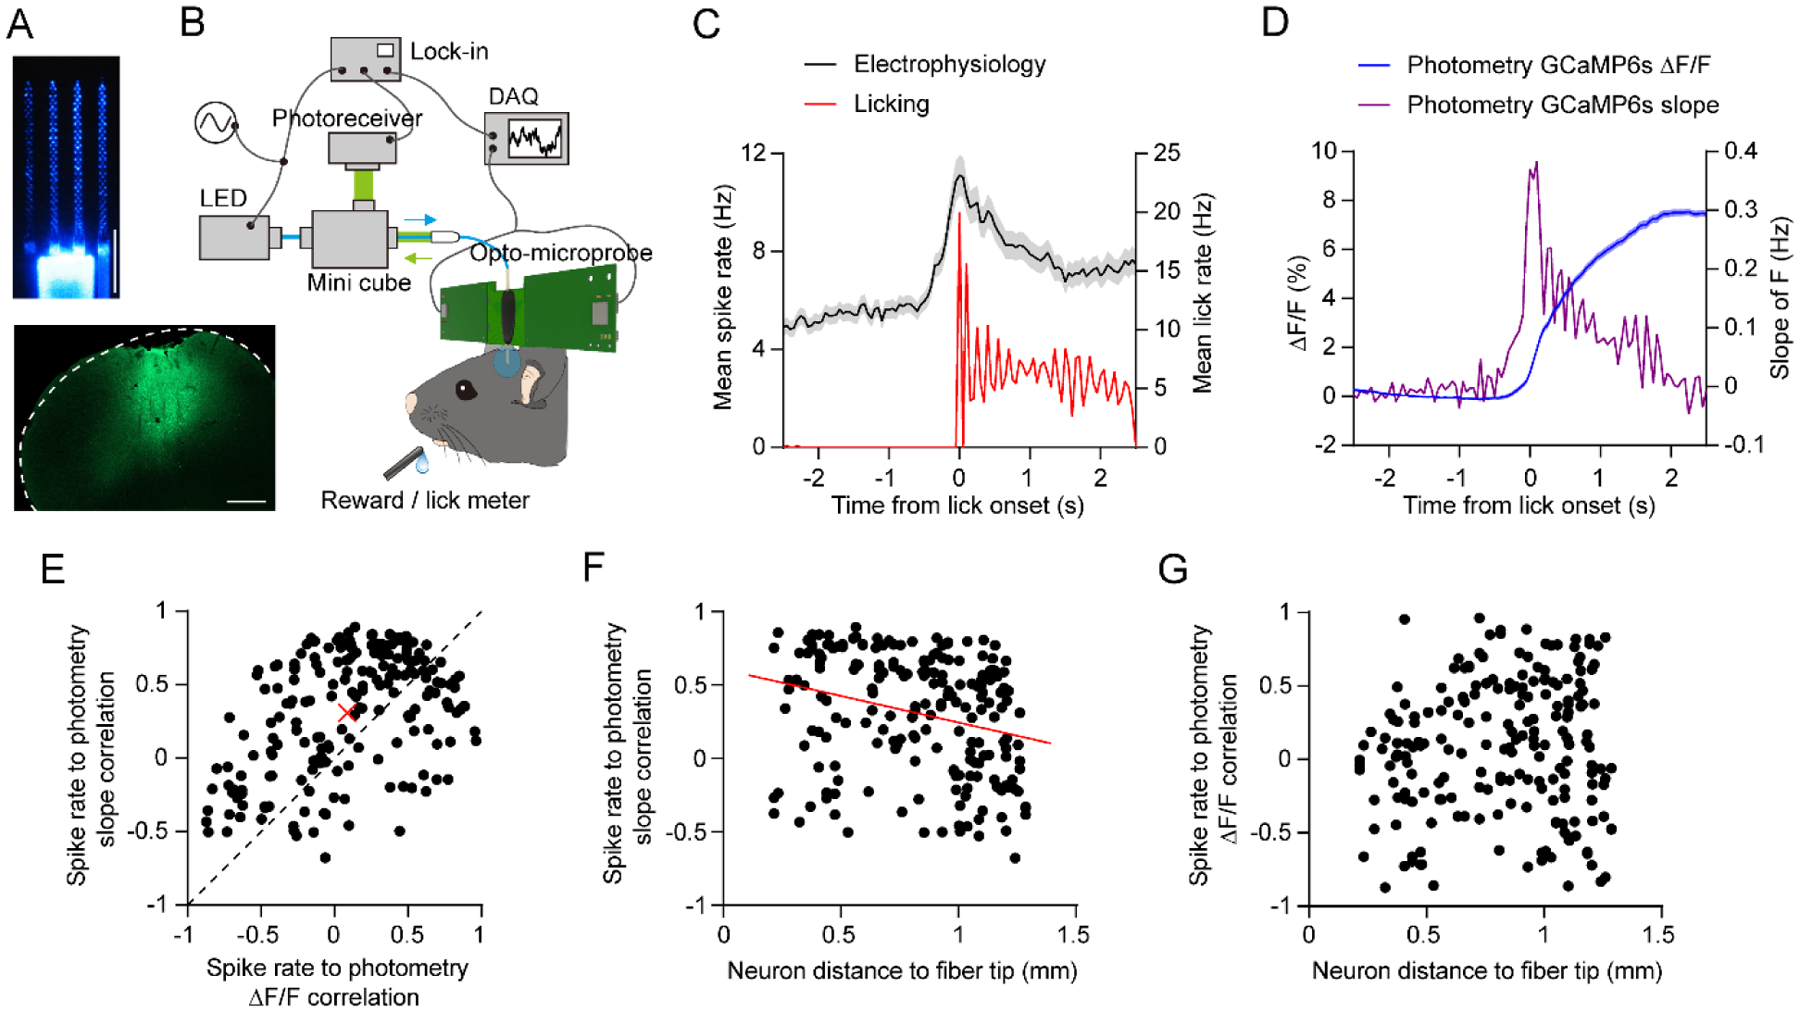
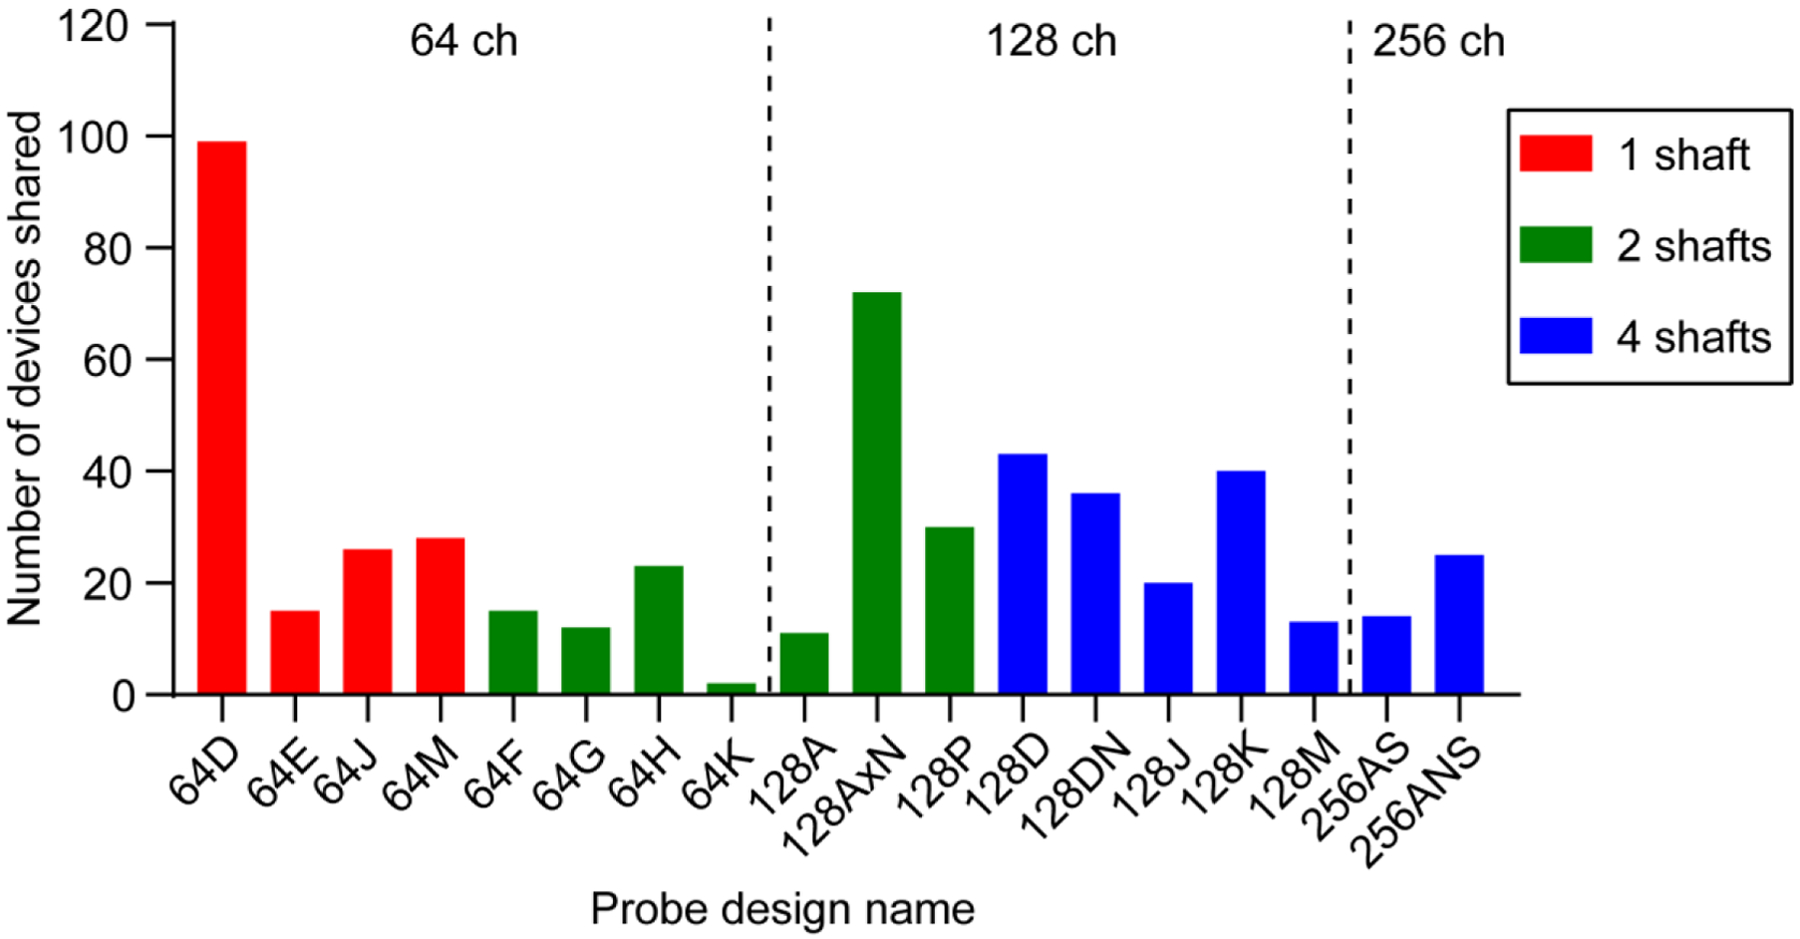
Main results: We demonstrate the operation of silicon microprobes containing up to 256 electrodes in conjunction with optical fibers for optogenetic manipulations or fiber photometry. These data provide new insights about the relationship between calcium activity and neural spiking activity. We also describe the current state of dissemination of these tools. A file repository of resources related to designing, using, and sharing these tools is maintained online.

Significance: This paper is likely to be a valuable resource for both current and prospective users, as well as developers of silicon microprobes. Based on their extensive usage by a number of labs including ours, these tools present a promising alternative to other types of electrode-based technologies aimed at high throughput recording in head-fixed animals. This work also demonstrates the importance of validating fiber photometry measurements with simultaneous electrophysiological recordings.


Conflict of interest statement

Disclosures

The authors declare the absence of any conflict of interest.

Figures

Figure 1.
Figure 1.. Overview of the main steps involved in silicon microprobe development.
The numbered steps on the left side are performed in house or by the end user, while the steps on the right side are performed by third-party companies. Step 1 shows CAD drawings of the individual probes and reticle. Step 2 shows the reticle copied multiple times across a wafer, and a photograph of a processed wafer. Step 3 shows hot water release of the probes from the carrier wafer, and sorting the devices by design into trays for storage. Step 4 shows the three standard PCB designs. Step 5 shows a probe assembled onto a PCB with wire bonding. Step 6 shows an assembled probe with epoxy encapsulation, a gold-plated electrode, and an opto-microprobe.
Figure 2.
Figure 2.. Common design variables for the implantable shaft section.
(A) Two possible shaft designs containing 64 and 32 electrodes. The maximum number of total electrodes is 256. (B) Three possible electrode layouts. Left: linear, middle: staggered, right: honeycomb. (C) Four possible shaft spacings. (D) Three possible shaft lengths. The default length is 7 mm. The maximum possible length is ~ 18 mm imposed by the reticle size.
Figure 3.
Figure 3.. Design of individual microprobes and the reticle.
(A) A 64 ch microprobe (64D short) illustrating the shaft and base sections, and the honeycomb electrode layout. (B) Assortment of different microprobe designs grouped by base section (64, 128, or 256 ch). (C) Expanded view of the three structural layers used for microfabrication (orange: silicon nitride window for exposing the electrodes and wire bond contact pads; magenta: metal layer comprising the electrodes, interconnecting wires, and wire bond contact pads; blue: silicon microprobe 2D profile). The inset shows a closeup of the probe tip. (D) Reticle layout containing an assortment of individual devices arranged closely together to minimize empty space.
Figure 4.
Figure 4.. High electrode density silicon microprobes.
Scanning electron microscope images of four popular silicon microprobes (64D sharp, 128AxN sharp, 128D, 256ANS). Note that three of the probes use the same honeycomb electrode layout. The scale bar in the inset represents 20 μm.
Figure 5.
Figure 5.. PCB design, device assembly, and micromanipulator holders.
(A) Top: three standard PCB designs. The connector solder pads connect to a Molex Slimstack connector (part # 5024306410). Bottom: images of the corresponding PCBs after assembly and epoxy encapsulation. Note that the connectors on the lower right device are assembled in the bottom mode. (B) Illustration of the top and bottom connector assembly modes. (C) Illustration of the plug-in and permanent holders. The drawing of the 128 ch amplifier board was downloaded from www.intantech.com. (D) 32 ch PCB with Omnetics connector for freely moving animal recordings. (E) Omnetics-to-Molex connector adapter for the 32 ch PCB in (D).
Figure 6.
Figure 6.. Device electroplating and noise characterization.
(A) Scanning electron microscope image of an uncoated (left) and gold-plated (right) electrode. (B) Impedance of 128 electrodes before and after electroplating, measured at 1 kHz in saline (paired t-test, p < 0.0001). (C) Root mean square noise of 128 electrodes before and after electroplating, measured in saline after applying a 0.3 – 7 kHz bandpass filter (paired t-test, p < 0.0001). Values in B and C represent mean ± SD.
Figure 7.
Figure 7.. High electrode density neural recording in head-fixed mice.
(A) Illustration of a recording setup for head-fixed mice. (B) Confocal microscope image of the microprobe insertion site in M2. The red signal is DiD fluorescence marking the shaft position. The approximate electrode positions are superimposed in white. The slice is labeled with DAPI (blue). (C) Left: Spike waveforms corresponding to three putative single units (mean ± SD). Each unit is color-coded according to its position on the electrode array (middle). Right: Voltage versus time traces from 24 electrodes filtered from 0.3 – 7 kHz.
Figure 8.
Figure 8.. Simultaneous electrophysiology and optogenetics with opto-microprobes.
(A) Left: Illustration of opto-microprobe consisting of a 64 electrode silicon probe (64D sharp) combined with a 200 μm diameter optical fiber. Right: Photograph of the electrodes under 589 nm illumination from the fiber. (B) Top left: Expression of ChR2-eYFP in M2 (scale bar: 0.5 mm). Right: spike raster and mean firing rate versus time of a cortical neuron from a ChR2-expressing mouse during application of 1 s continuous light pulses (10 mW, 473 nm). Bottom left: average spike waveform of the same unit under light off (black) and light on (blue) conditions. (C) Left: Mean firing rate during laser off versus laser on of 32 cortical neurons recorded from ChR2-expressing mice. The firing rate was significantly higher during laser on (paired t-test, p < 0.0001). The light intensity was 10 mW. Right: Rate modulation index distribution of 32 cortical neurons recorded from ChR2-expressing mice. Dashed line represents the diagonal. (D) Top left: Expression of eNpHR3.0-eYFP in M2 (scale bar: 0.5 mm). Right: spike raster and mean firing rate versus time of a cortical neuron from a eNpHR3.0-expressing mouse during application of 1 s continuous light pulses (10 mW, 589 nm). Bottom left: average spike waveform of the same unit under light off (black) and light on (orange) conditions. (E) Left: Mean firing rate during laser off versus laser on of 43 cortical neurons recorded from eNpHR3.0-expressing mice. The firing rate was significantly lower during laser on (paired t-test, p = 0.001). The light intensity was 10 mW. Right: Rate modulation index distribution of 43 cortical neurons recorded from eNpHR3.0-expressing mice. (F) There was no significant effect of optical power on the rate modulation in ChR2-expressing mice (one-way ANOVA, F4,149 = 0.51, p = 0.73). (G) There was a significant effect of optical power on the rate modulation in eNpHR3.0-expressing mice (one-way ANOVA, F4,210 = 3.41, p = 0.01). Data in F and G represent mean ± SEM. (H) Pearson correlation coefficient between each unit’s spike waveform during laser off and on conditions (mean correlation coefficient = 0.93). The light intensity was 10 mW. (I) Pearson correlation coefficient between each unit’s spike waveform during laser off and on conditions (mean correlation coefficient = 0.92). Note that 28 out of 43 units had zero spikes during the laser on period, and thus could not be included in this analysis. The light intensity was 10 mW.
Figure 9.
Figure 9.. Simultaneous electrophysiology and fiber photometry with opto-microprobes.
(A) Top: Image of the opto-microprobe used for simultaneous electrophysiology with a 256 ch probe and photometry with a 430 μm outer diameter optical fiber. The image was taken under 465 nm LED illumination from the fiber. Bottom: GCaMP6s expression in M2. Scale bars: 0.5 mm. (B) Setup for performing recordings in mice trained on a self-initiated operant licking task. (C) Black curve represents the mean firing rate versus time of 204 cortical neurons recorded from one mouse using the opto-microprobe, aligned to lick onset on rewarded trials. Red curve represents the mean licking rate during the same time period. (D) Blue curve represents the fractional change in photometry fluorescence signal (ΔF/F) versus time. Violet curve represents the slope, or derivative, of the photometry fluorescence signal. Electrophysiological, licking, and photometry data in C and D were measured simultaneously from the same animal. (E) Pearson correlation coefficient of each neuron’s firing rate to the photometry slope signal, versus each neuron’s firing rate to the photometry ΔF/F signal. Each black circle represents one neuron (n = 204). The correlation is significantly higher for the slope (paired t-test, p < 0.0001). Red cross represents the mean value. Dashed line represents the diagonal. (F) Pearson correlation coefficient of each neuron’s firing rate to the photometry slope signal, versus the neuron’s diagonal distance to the optical fiber tip. There is a significant negative correlation with distance (n = 204, r = −0.27, p = 0.0001). Red line represents the best line fit. (G) Pearson correlation coefficient of each neuron’s firing rate to the photometry ΔF/F signal, versus the neuron’s diagonal distance to the optical fiber tip. There is no significant correlation with distance (n = 204, r = 0.09, p = 0.18).
Figure 10.
Figure 10.. Open source silicon microprobe dissemination.
Quantity of each probe design shared with external users (n = 524 total probes). The tally is over an 18 month period from July 1 2018 to October 1 2019. The probes are grouped by electrode number and color coded by the number of shafts.

Similar articles

Cited by

References

    1. Wise KD, Sodagar AM, Yao Y, Gulari MN, Perlin GE, and Najafi K, Microelectrodes, microelectronics, and implantable neural microsystems. Proceedings of the Ieee, 2008. 96(7): p. 1184–1202.
    1. Wise KD and Angell JB, Low-Capacitance Multielectrode Probe for Use in Extracellular Neurophysiology. Ieee Transactions on Biomedical Engineering, 1975. Bm22(3): p. 212–219. - PubMed
    1. Seymour JP and Kipke DR, Neural probe design for reduced tissue encapsulation in CNS. Biomaterials, 2007. 28(25): p. 3594–607. - PubMed
    1. Blanche TJ, Spacek MA, Hetke JF, and Swindale NV, Polytrodes: high-density silicon electrode arrays for large-scale multiunit recording. J Neurophysiol, 2005. 93(5): p. 2987–3000. - PubMed
    1. Du J, Blanche TJ, Harrison RR, Lester HA, and Masmanidis SC, Multiplexed, high density electrophysiology with nanofabricated neural probes. PLoS One, 2011. 6(10): p. e26204. - PMC - PubMed

Publication types