. 2019 Nov 19;51(5):899-914.e7.
doi: 10.1016/j.immuni.2019.10.010. Epub 2019 Nov 12.

Tissue-Specific Macrophage Responses to Remote Injury Impact the Outcome of Subsequent Local Immune Challenge

Affiliations

Tissue-Specific Macrophage Responses to Remote Injury Impact the Outcome of Subsequent Local Immune Challenge

Friedrich Felix Hoyer et al. Immunity. .

Abstract

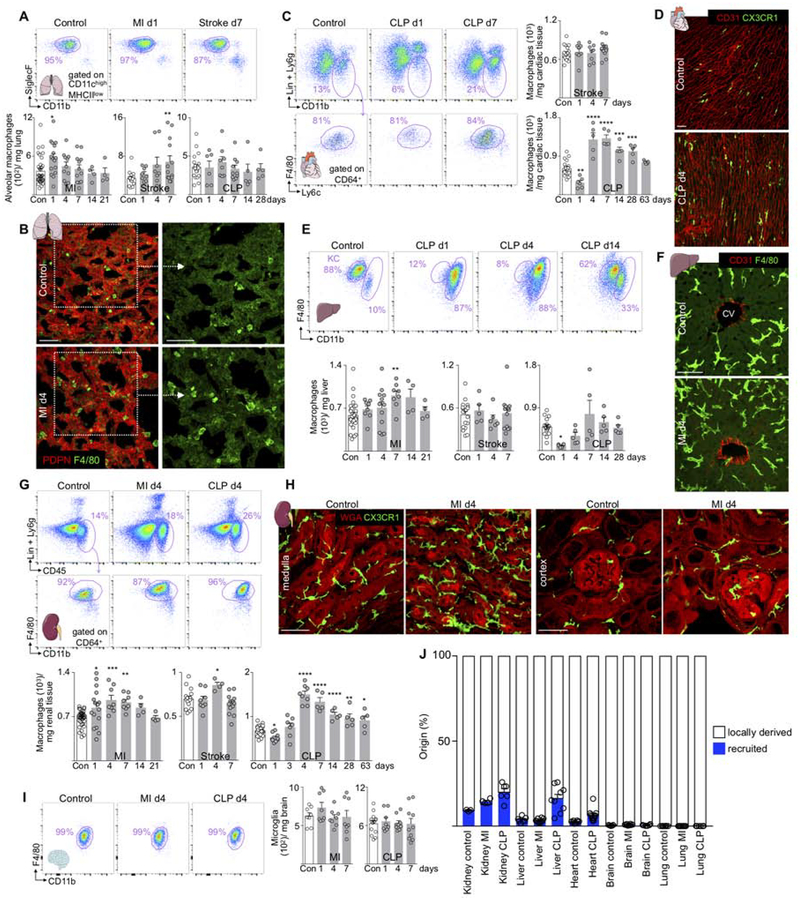
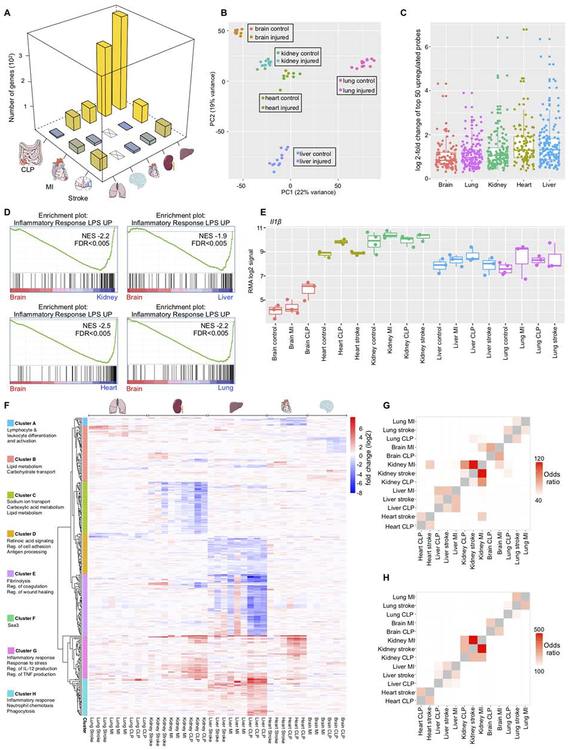
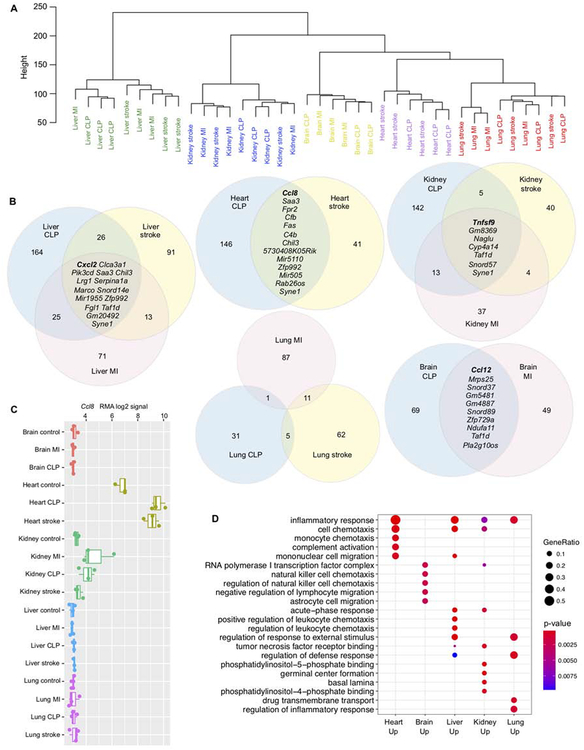
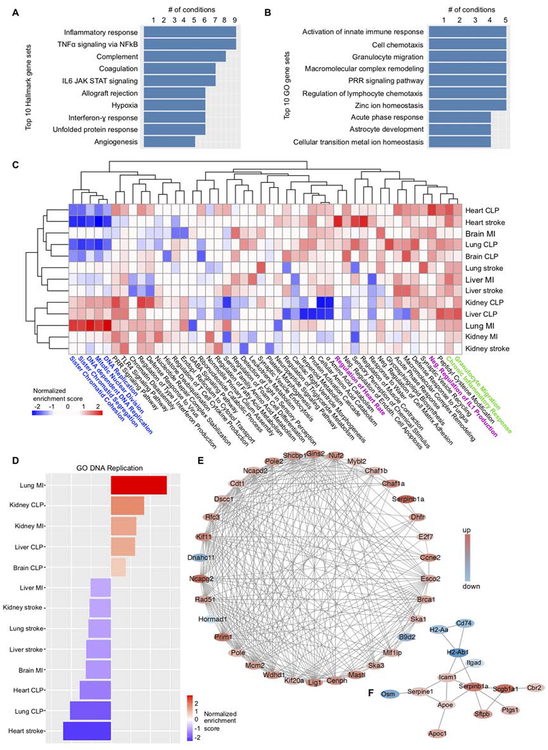
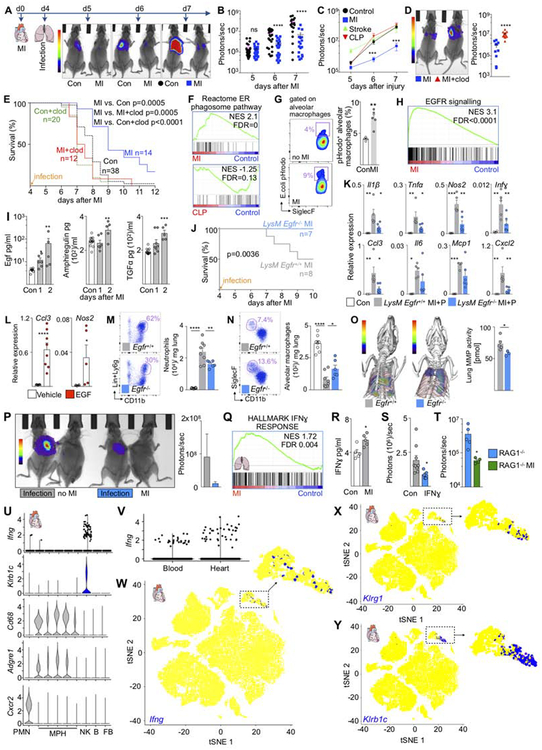
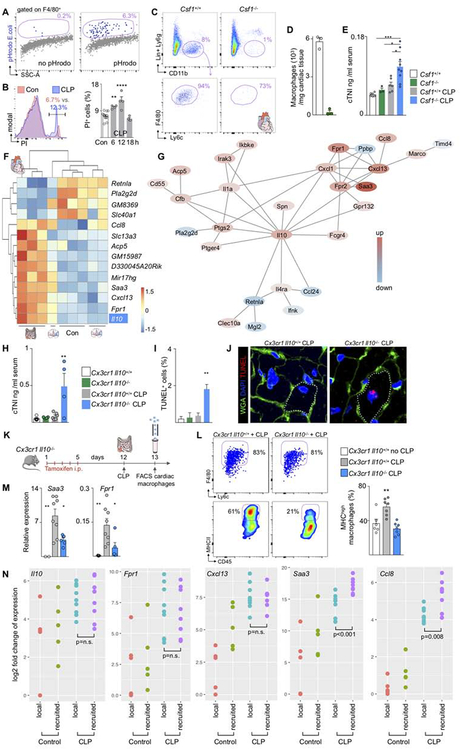
Myocardial infarction, stroke, and sepsis trigger systemic inflammation and organism-wide complications that are difficult to manage. Here, we examined the contribution of macrophages residing in vital organs to the systemic response after these injuries. We generated a comprehensive catalog of changes in macrophage number, origin, and gene expression in the heart, brain, liver, kidney, and lung of mice with myocardial infarction, stroke, or sepsis. Predominantly fueled by heightened local proliferation, tissue macrophage numbers increased systemically. Macrophages in the same organ responded similarly to different injuries by altering expression of tissue-specific gene sets. Preceding myocardial infarction improved survival of subsequent pneumonia due to enhanced bacterial clearance, which was caused by IFNɣ priming of alveolar macrophages. Conversely, EGF receptor signaling in macrophages exacerbated inflammatory lung injury. Our data suggest that local injury activates macrophages in remote organs and that targeting macrophages could improve resilience against systemic complications following myocardial infarction, stroke, and sepsis.

Keywords: macrophage; myocardial infarction; sepsis; stroke.


Conflict of interest statement

DECLARATION OF INTERESTS

M.N. has been a paid a consultant fee or received research support from Alnylam, GSK, IFM Therapeutics, Medtronic, Molecular Imaging, Novartis, Sigilon and Verseaux.

Figures

Figure 1.
Figure 1.. Macrophage numbers fluctuate in distant sites after MI, stroke and CLP.
(A) Alveolar macrophages, control n=19–34, MI n=4–16, stroke n=8–13, CLP n=5–10. (B) Lung macrophages at baseline and d4 after MI. Scale bar, 50 μm. (C) Heart macrophages after stroke and CLP. Control n=18–20, stroke n=8–13, CLP n=5–6. (D) Histology of heart macrophages at baseline and d4 after CLP. (E) Liver macrophages after CLP (KC, Kupffer cells), MI and stroke. Control n=16–32, MI n=4–12, stroke n=5–13, CLP n=5–6. (F) Liver macrophages around central veins (CV) at baseline and day 4 after MI. (G) Renal macrophages. Control n=16–34, MI n=4–16, stroke n=4–13, CLP n=5–9. (H) Renal macrophages at baseline and after MI. (I) Microglia after MI and CLP, control n=8–14, MI n=8, CLP n=8–10. (J) Summary genetic fate mapping, original data are in Figure S2. Lung refers to alveolar macrophages. Data are mean ± s.e.m. *P<0.05, **P<0.01, ***P<0.001, ****P<0.0001. Ordinary one-way ANOVA with Dunnett’s multiple comparison test was used for normally distributed data. See also Figure S1,2 and Table S1.
Figure 2.
Figure 2.. Transcriptome profiling shows a systemic macrophage response to injury.
(A) Number of differentially expressed genes (FDR<10%) in macrophages after MI, stroke or CLP. (B) Principal component analysis of all samples. (C) Log2 fold changes of the most increased probe sets (by p-value) after injury. For each injury, the top 50 probe sets were included. (D) Gene set enrichment analysis of the gene set “NEMETH_INFLAMMATORY_RESPONSE_LPS_UP” in brain microglia vs. all other organs. (E) Expression (RMA log2 signal) of IL1-β. (F) Heatmap showing log2-fold changes for the top differentially expressed unique genes (FDR<0.01 in at least one condition, n=297). The log2-fold change between every injury sample and the average across at least three tissue-matched controls is shown. (G) Odds ratios of the overlap between genes with fold change>2 after injury. All pairwise comparisons are shown. (H) as in (G) for genes with fold change < −2. See also Figure S3 and Table S2, S3.
Figure 3.
Figure 3.. Tissue microenvironment determines the transcriptional response of macrophages to injury.
(A) Unsupervised hierarchical transcriptome-wide clustering of gene expression changes in macrophages after injury, normalized to tissue-matched steady state controls. All probe sets were used in this analysis (n=33,793). (B) Venn diagrams showing the overlap between genes with fold change > 2 after injury in each organ. Genes that are increased after all injuries are listed in full. (C) Expression (RMA log2 signal) of Ccl8. (D) Gene Ontology (GO) enrichment analysis of genes that are expressed with a fold change >2 after at least two injuries. Gene ratio is the fraction of genes in the tested set that belongs to a given GO category.
Figure 4.
Figure 4.. Characterization of ubiquitous and organ- and injury-specific macrophages responses.
(A) Molecular Signatures Database Hallmark gene sets that were most frequently enriched (FDR<25%) in genes with increased expression after different injuries. (B) As in A, with gene sets from the Gene Ontology/Biological Process collection. (C) Heatmap of normalized enrichment scores (NES). The two-top scoring Gene Ontology (Biological Process) categories of each experimental condition were selected, and their NES across all data sets are displayed. Positive NES (red) indicates enrichment of a GO category in genes expressed at higher levels after injury, negative NES indicates enrichment in genes expressed at lower levels. (D) NES for the gene set GO DNA REPLICATION across all organs and injuries. (E) StringDB protein-protein association network for the top 100 genes (by p-value) that are differentially expressed in lung after MI. Colors reflect the fold change (red, increased; blue, decreased). (F) as in (E) for lung after stroke.
Figure 5.
Figure 5.. Lung macrophages’ response to injury regulates organ susceptibility to subsequent infection.
(A) Experimental design and bioluminescence images. (B) Bacterial bioluminescent signal. Each data point represents one mouse. (C) Bioluminescent lung signal after MI, stroke and CLP. Control n=31–49, MI n=18–25, stroke n=3–10, CLP n=8–10. (D) Bioluminescence imaging after depletion of alveolar macrophages (clod) on day 4 after MI, 4 hrs prior to infection. (E) Survival after lung infection in naive mice (Con), clodronate liposome in controls (Con+clod), MI followed by lung infection (MI), MI, macrophage depletion and lung infection (MI+clod). Con vs. Con+clod, P=0.006; Con+clod vs. MI+clod, P=0.48. (F) Gene set enrichment (REACTOME_ER_PHAGOSOME_PATHWAY) in alveolar macrophages in naive control versus MI or CLP. FDR values here reflect single hypothesis testing. (G) Phagocytosis assay after intratracheal fluorescent E.coli in naive controls versus MI. (H) EGFR gene set enrichment (KOBAYASHI_EGFR_SIGNALING_24HR_DN) in alveolar macrophages after MI. (I) ELISA in naive controls and after MI. Control n=9–13, MI day 1 n=6–8, day 2 n=5 biological replicates. (J) Survival of LysM Egfr+/+ and LysM Egfr−/− mice after MI and lung infection. (K) Cytokine mRNA in lung 6 days after MI, 2 days after infection. Control n=4, LysM Egfr+/+ n=5, LysM Egfr−/− n=6. (L) Gene expression in alveolar macrophages sorted from mice with MI and after intratracheal instillation of EGF. (M) Neutrophils and (M) alveolar macrophages in lung. Control n=8, LysM Egfr+/+ n=6, LysM Egfr−/− n=8. (O) FMT/CT of lung protease activity in LysM Egfr+/+ and LysM Egfr−/− mice after MI followed by pneumonia. LysM Egfr+/+ n=5, LysM Egfr−/− n=3. (P) Bioluminescence imaging of bacteria in parabionts 5 days after MI, 1 day after lung infection. Control n=4, MI n=3. (Q) Gene set enrichment (HALLMARK_INTERFERON_GAMMA_RESPONSE) in alveolar macrophages from naive control versus MI. (R) IFNɣ protein in the lung after MI. Control n=5, MI n=5. (S) Bioluminescence in mice treated with IFNɣ or vehicle. Control n=9, IFNɣ n=5. (T) Bioluminescence in RAG1−/− control mice n=5 vs. RAG1−/− with MI n=4. (U) Violin plots of Ifnɣ expressing cells in each cluster compared to marker genes for NK cells (Klrb1c), macrophages (Cd68, Adgre1) and neutrophils (Cxcr2). (V) Expression of Ifnɣ in single cells from blood and heart. (W-Y) Tsne plots of Ifnɣ-expressing cells compared to NK marker genes (Klrg1, Klrb1c). Inserts expand NK and T cell cluster. Data are mean ± s.e.m. *P<0.05, **P<0.01, ***P<0.001, ****P<0.0001. Unpaired t-test or ordinary one-way ANOVA with Dunnett’s multiple comparison test for normally distributed data. For non-parametric data Mann-Whitney test or Kruskal-Wallis test with Dunn’s multiple comparison test were used. Survival was analyzed by log-rank test and Bonferroni correction for multiple comparison. See also Figure S4, S5.
Figure 6.
Figure 6.. Macrophages protect the heart in sepsis.
(A) pHrodo E.coli in cardiac macrophages. (B) Propidium Iodide (PI) in heart macrophages after CLP. Control n=12, CLP n=4 per time point. (C) Flow plots and (D) number of cardiac macrophages in Csf1+/+ and Csf−/− mice. (E) Serum troponin levels in naive and CLP Csf1+/+ and Csf−/− mice. Naive Csf1+/+ n=6, Csf1−/− n=3, CLP Csf1+/+ n=6, Csf1−/− n=9. (F) Top regulated genes after CLP in heart macrophages. (G) Protein-protein association network for the top 100 genes by p-value that are differentially expressed in cardiac macrophages after CLP. (H) Serum troponin levels in Cx3cr1 Il10+/+ and Cx3cr1 Il10−/− mice after CLP. Naive Cx3cr1 Il10+/+ n=6, Cx3cr1 Il10−/− n=4, CLP Cx3cr1 Il10+/+ n=6, Cx3cr1 Il10−/− n=4. (I) Apoptotic cardiomyocytes by TUNEL staining. n=3 mice per group. (J) TUNEL+ myocyte. Dashed line marks cell border. (K) Outline for L and M. (L) MHCII expression in cardiac macrophages. Naive Cx3cr1 Il10+/+ n=6, Cx3cr1 Il10+/+ CLP n=6, Cx3cr1 Il10−/− CLP n=7 biological replicates. (M) qPCR in sorted cardiac macrophages. Naive Cx3cr1 Il10+/+ n=2–5, Cx3cr1 Il10+/+ CLP n=8, Cx3cr1 Il10−/− CLP n=5–6 biological replicates. (N) Gene expression in local versus recruited cardiac macrophages isolated from Cx3cr1CreER/+R26tdTomato/+ mice, n=4 biological replicates for control local, n=5 control recruited, n=10 CLP d4 local, n=8 CLP d4 recruited. Data are mean ± s.e.m. *P<0.05, **P<0.01, ***P<0.001, ****P<0.0001. Unpaired t-test or ordinary one-way ANOVA with Dunnett’s multiple comparison test was used for statistical analysis. See also Figure S6.

Comment in

References

    1. Alp E, Guven M, Yildiz O, Aygen B, Voss A, and Doganay M (2004). Incidence, risk factors and mortality of nosocomial pneumonia in intensive care units: a prospective study. Ann Clin Microbiol Antimicrob 3, 17. - PMC - PubMed
    1. Ather JL, and Poynter ME (2018). Serum amyloid A3 is required for normal weight and immunometabolic function in mice. PLoS One 13, e0192352. - PMC - PubMed
    1. Case J, Khan S, Khalid R, and Khan A (2013). Epidemiology of acute kidney injury in the intensive care unit. Crit Care Res Pract 2013, 479730. - PMC - PubMed
    1. Chakarov S, Lim HY, Tan L, Lim SY, See P, Lum J, Zhang XM, Foo S, Nakamizo S, Duan K, Kong WT, Gentek R, Balachander A, Carbajo D, Bleriot C, Malleret B, Tam JKC, Baig S, Shabeer M, Toh SES, Schlitzer A, Larbi A, Marichal T, Malissen B, Chen J, Poidinger M, Kabashima K, Bajenoff M, Ng LG, Angeli V, and Ginhoux F (2019). Two distinct interstitial macrophage populations coexist across tissues in specific subtissular niches. Science 363, - PubMed
    1. Davies LC, Jenkins SJ, Allen JE, and Taylor PR (2013). Tissue-resident macrophages. Nat Immunol 14, 986–995. - PMC - PubMed

Publication types

MeSH terms