Clinical Trial
. 2020 Jan;10(1):40-53.
doi: 10.1158/2159-8290.CD-19-0980. Epub 2019 Nov 15.

Adenosine 2A Receptor Blockade as an Immunotherapy for Treatment-Refractory Renal Cell Cancer

Affiliations
Clinical Trial

Adenosine 2A Receptor Blockade as an Immunotherapy for Treatment-Refractory Renal Cell Cancer

Lawrence Fong et al. Cancer Discov. 2020 Jan.

Abstract

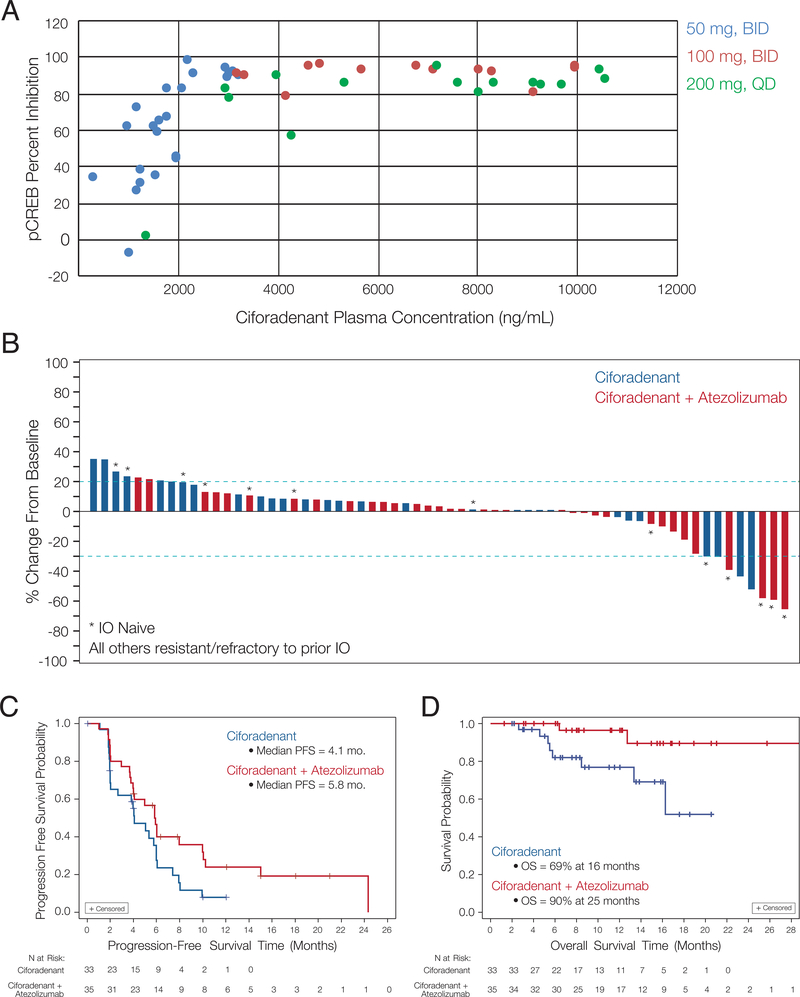
Adenosine mediates immunosuppression within the tumor microenvironment through triggering adenosine 2A receptors (A2AR) on immune cells. To determine whether this pathway could be targeted as an immunotherapy, we performed a phase I clinical trial with a small-molecule A2AR antagonist. We find that this molecule can safely block adenosine signaling in vivo. In a cohort of 68 patients with renal cell cancer (RCC), we also observe clinical responses alone and in combination with an anti-PD-L1 antibody, including subjects who had progressed on PD-1/PD-L1 inhibitors. Durable clinical benefit is associated with increased recruitment of CD8+ T cells into the tumor. Treatment can also broaden the circulating T-cell repertoire. Clinical responses are associated with an adenosine-regulated gene-expression signature in pretreatment tumor biopsies. A2AR signaling, therefore, represents a targetable immune checkpoint distinct from PD-1/PD-L1 that restricts antitumor immunity. SIGNIFICANCE: This first-in-human study of an A2AR antagonist for cancer treatment establishes the safety and feasibility of targeting this pathway by demonstrating antitumor activity with single-agent and anti-PD-L1 combination therapy in patients with refractory RCC. Responding patients possess an adenosine-regulated gene-expression signature in pretreatment tumor biopsies.See related commentary by Sitkovsky, p. 16.This article is highlighted in the In This Issue feature, p. 1.


Figures

FIGURE 1:
FIGURE 1:. Pharmacokinetics, pharmacodynamics, and tumor response to ciforadenant alone and in combination with atezolizumab.
A) Blood was collected from subjects with different dosing regimens during an eight-hour time course on treatment day 14 and activated with exogenous 1 μM NECA. Concurrent pharmacokinetic assessment were also performed. The graph shows the relationship between plasma concentration of ciforadenant and inhibition of NECA-induced pCREB, with data from individuals dosed with 50mg BID (blue), 100mg BID (red) or 200mg QD (green). B) Waterfall plot showing best overall response in sum of longest diameter measurements of target lesions. Patients naïve to immunotherapy at time of enrollment are designated with an asterisk. All others were resistant or refractory to prior immunotherapy treatment. C-D) Progression free survival (C) and overall survival (D) in patients treated with ciforadenant or the ciforadenant plus atezolizumab combination.
FIGURE 2:
FIGURE 2:. Tumor response to ciforadenant is associated with T cell infiltration and expression of an TCR diversification
A) Immunohistochemistry of CD8 was performed pre- treatment and 1 – 4 months post treatment, and the ratio of the CD8+ tumor area was determined. Representative images of CD8+ T cell infiltration following ciforadenant monotherapy treatment are shown in the right panel. B) TCR sequencing was performed on blood samples obtained pre- and post-treatment. Morisita’s Index (Changes in TCR repertoire) after ciforadeant alone or in combination with atezolizumab was mapped as a function of baseline clonality. Horizontal dashed line indicates a threshold previously shown to be associated with anti-CTLA-4 mediated changes in TCR repertoire.
FIGURE 3:
FIGURE 3:. In vitro characterization of gene expression signature related to adenosine exposure
A-B) Adenosine signature related chemokine concentrations exhibited dose a dependent increase (CXCL1, panel A) or decrease (CXCL10, panel B). C) Addition of ciforadenant (1 μm) neutralizes the induction of CXCL5 by NECA as determined by ELISA. D-G) Purified human PBMCs from healthy donors were co-cultured with indicated the concentrations of NECA and were stimulated with anti-human CD3 and CD28 antibodies. Cells were kept in culture for 2 days. Golgi block was added 4 hours prior to collecting cells for intracellular flow cytometry analysis. CD14+ monocytic cells exhibited elevated expression of adenosine signature (as determined by mean fluorescence intensity, MFI) related cytokines and chemokines including CXCL5 (D), CCl2 (E), IL-8 (F), and CXCL1 (G) as NECA concentration increased. Lymphocytes including CD8+ T cells and CD19+ B cells had minimal changes. Error bars represent SEM.
FIGURE 4:
FIGURE 4:. Tumor response to ciforadenant is associated with expression of an adenosine gene expression signature
A) Genes of interest (rows) were assessed from tumors collect pre-treatment from 30 patients (columns). Gene expression was z-score transformed with high (yellow) and low (purple) expression normalized for each gene. The median expression of IFNG, EOMES, FOXP3, and PTGS2 was equivalent to the noise floor so for these genes expression at the noise floor is colored gray and above the noise floor is yellow. Genes are grouped by biological functions of angiogenesis (orange), immune and antigen presentation (blue), and adenosine signature (green). B) The waterfall plot shows the best change in the sum of the longest dimensions for patients with low (left) or high (right) expression of the adenosine signature.

Comment in

References

    1. Sharma P, et al., Primary, Adaptive, and Acquired Resistance to Cancer Immunotherapy. Cell, 2017. 168(4): p. 707–723.10.1016/j.cell.2017.01.017 - DOI - PMC - PubMed
    1. Ohta A, et al., A2A adenosine receptor protects tumors from antitumor T cells. Proc Natl Acad Sci U S A, 2006. 103(35): p. 13132–7.10.1073/pnas.0605251103 - DOI - PMC - PubMed
    1. Sitkovsky MV, et al., Hostile, hypoxia-A2-adenosinergic tumor biology as the next barrier to overcome for tumor immunologists. Cancer Immunol Res, 2014. 2(7): p. 598–605.10.1158/2326-6066.CIR-14-0075 - DOI - PMC - PubMed
    1. Ohta A and Sitkovsky M, Role of G-protein-coupled adenosine receptors in downregulation of inflammation and protection from tissue damage. Nature, 2001. 414(6866): p. 916–20.10.1038/414916a - DOI - PubMed
    1. Lokshin A, et al., Adenosine-mediated inhibition of the cytotoxic activity and cytokine production by activated natural killer cells. Cancer Res, 2006. 66(15): p. 7758–65.10.1158/0008-5472.CAN-06-0478 - DOI - PubMed

Publication types

MeSH terms