Observational Study
. 2020 Jan 15;80(2):304-318.
doi: 10.1158/0008-5472.CAN-18-3539. Epub 2019 Nov 15.

Clinical Evolution of Epithelial-Mesenchymal Transition in Human Carcinomas

Affiliations
Observational Study

Clinical Evolution of Epithelial-Mesenchymal Transition in Human Carcinomas

Tony Navas et al. Cancer Res. .

Abstract

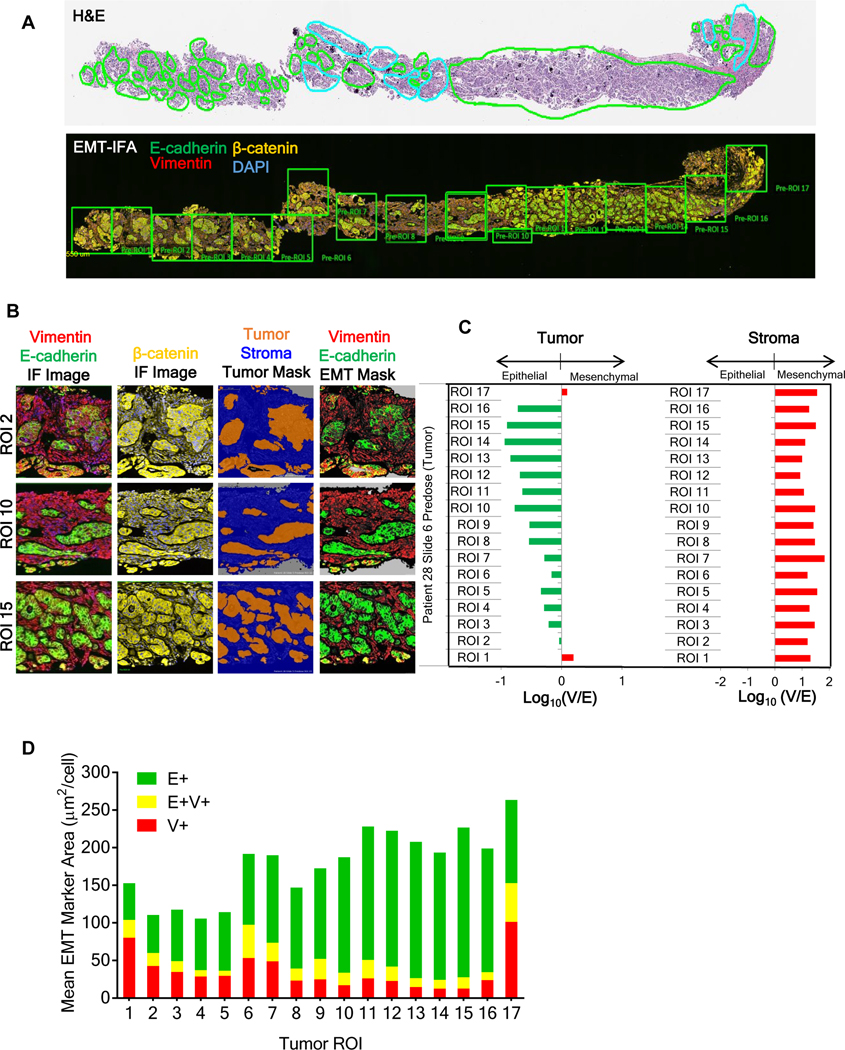
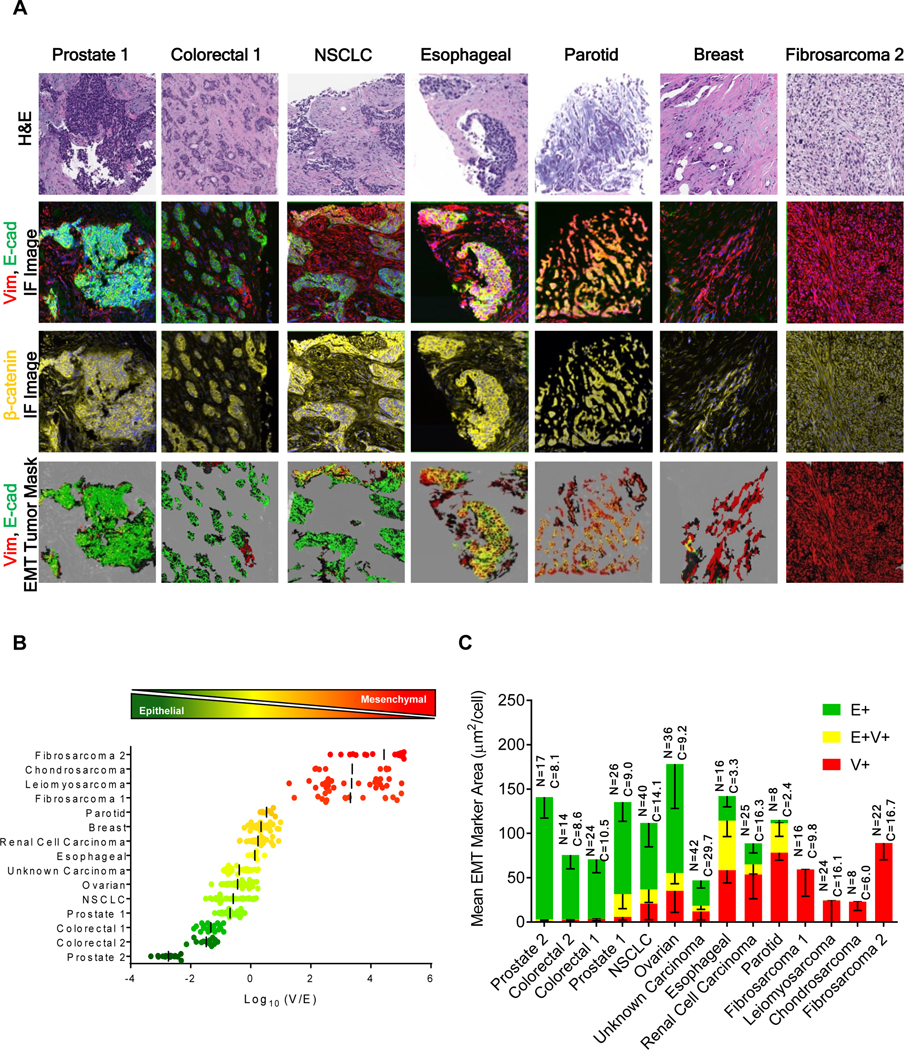
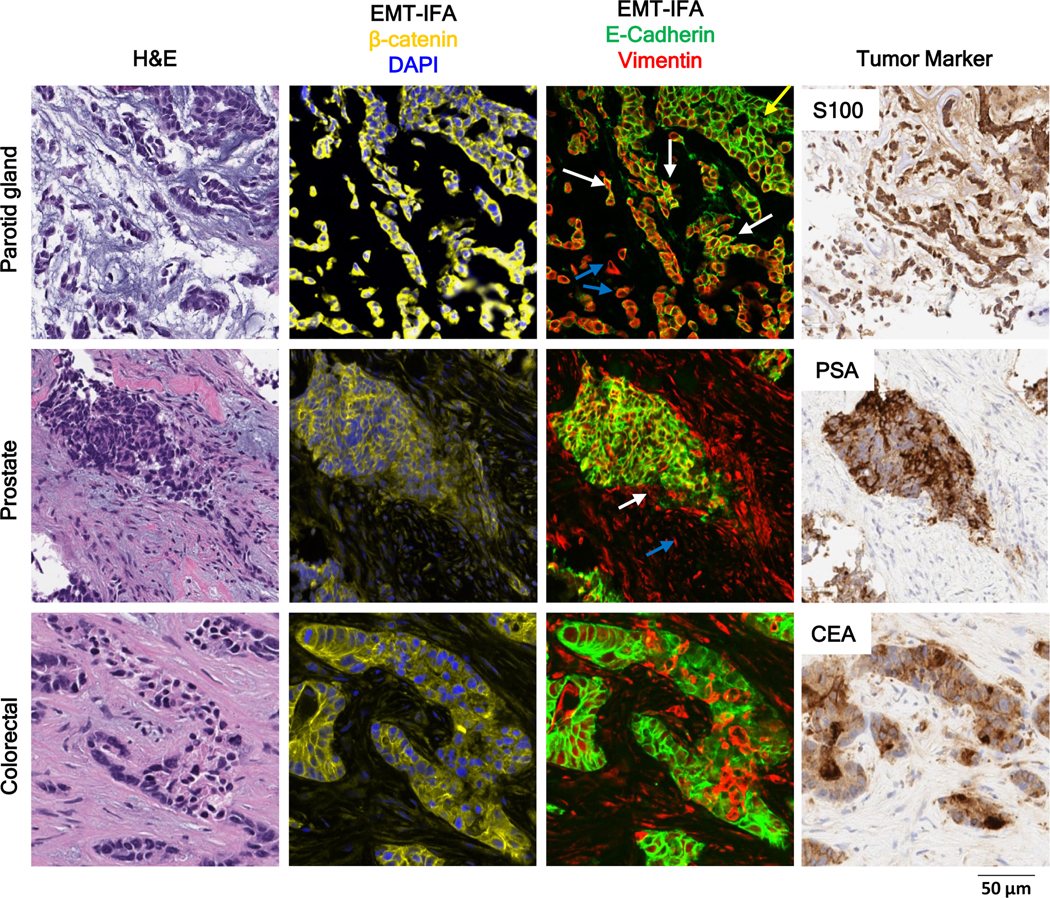
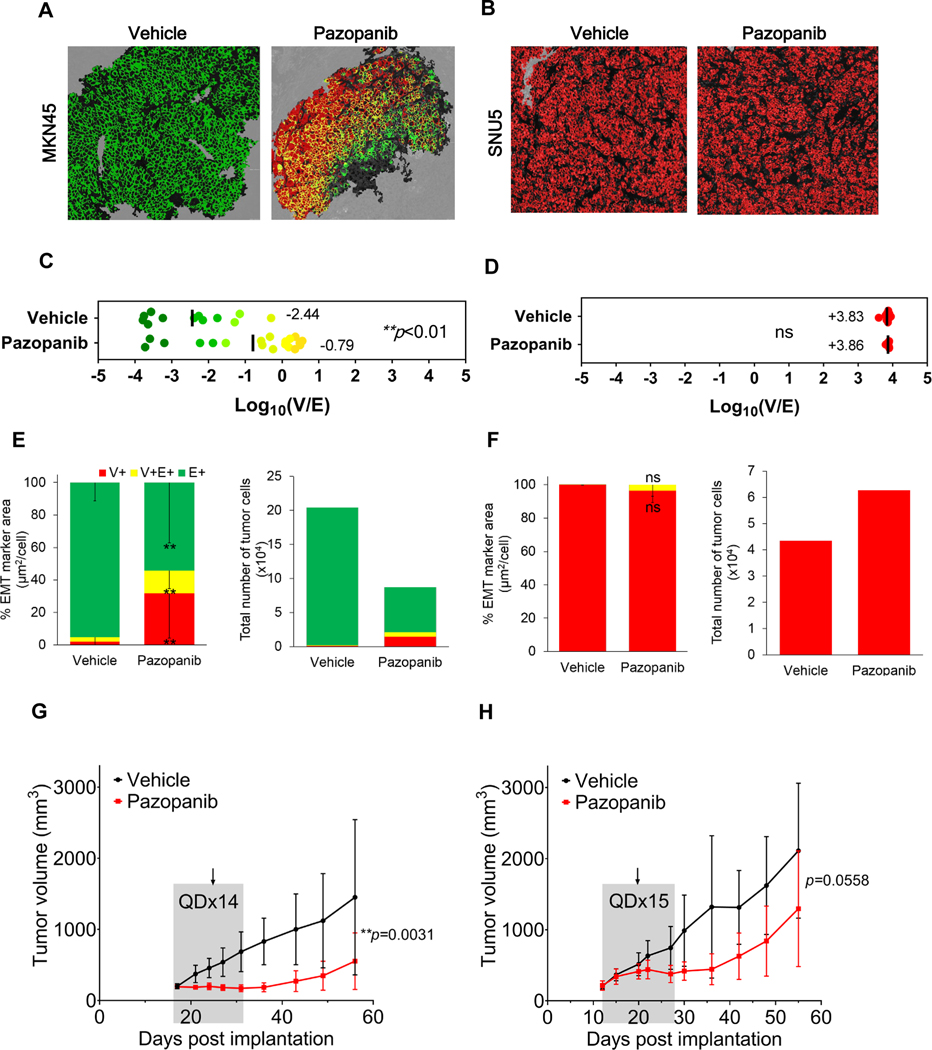
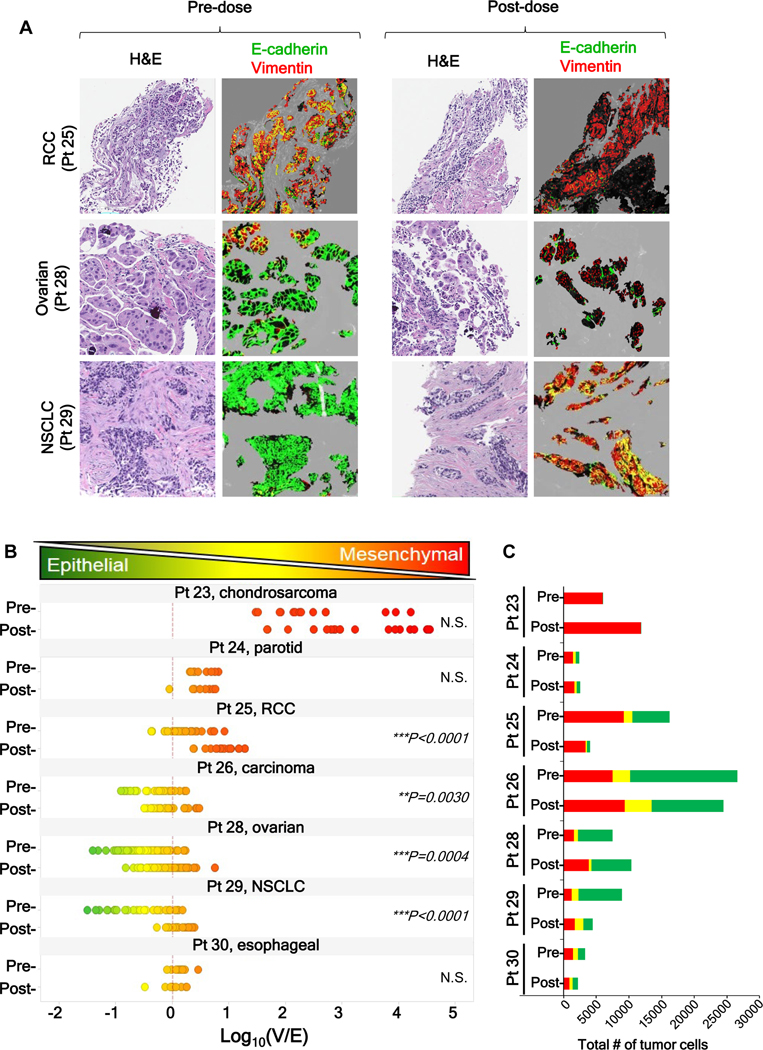
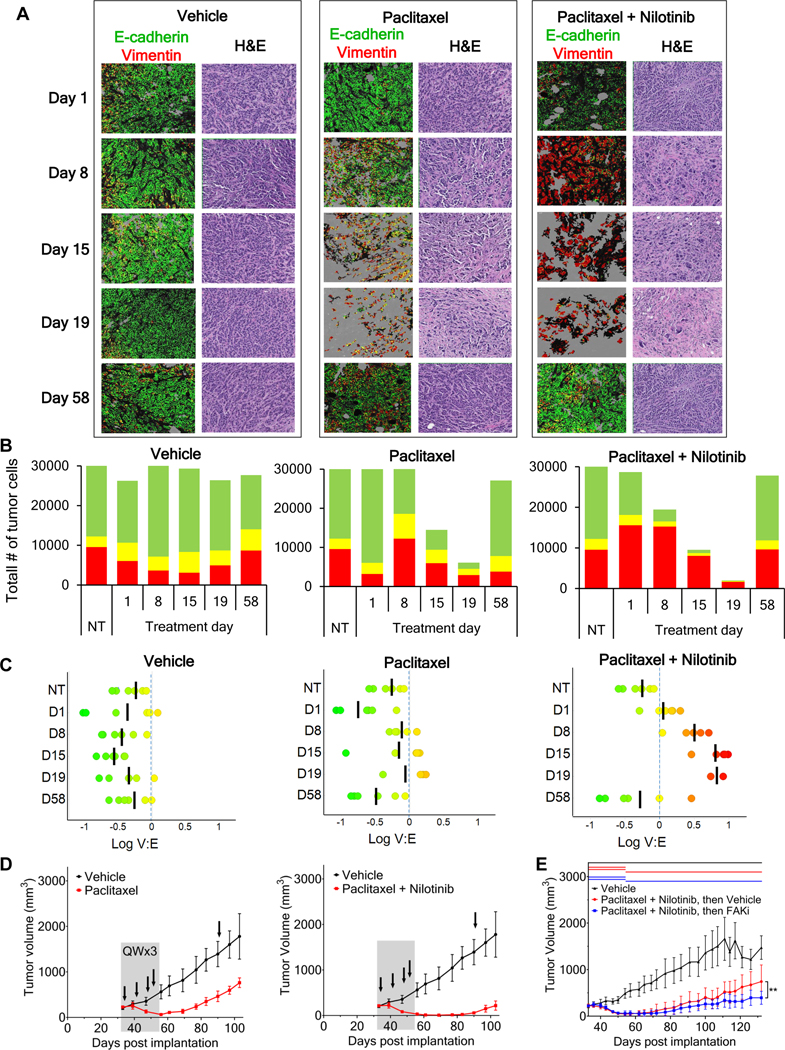
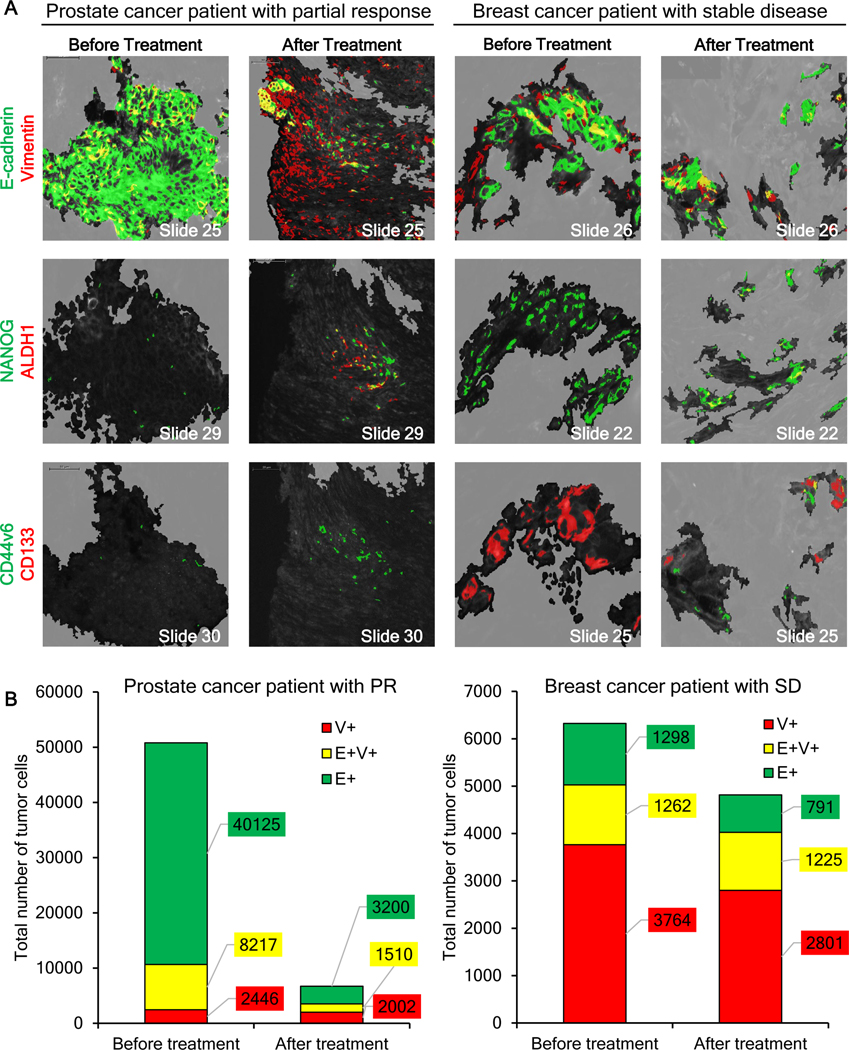
The significance of the phenotypic plasticity afforded by epithelial-mesenchymal transition (EMT) for cancer progression and drug resistance remains to be fully elucidated in the clinic. We evaluated epithelial-mesenchymal phenotypic characteristics across a range of tumor histologies using a validated, high-resolution digital microscopic immunofluorescence assay (IFA) that incorporates β-catenin detection and cellular morphology to delineate carcinoma cells from stromal fibroblasts and that quantitates the individual and colocalized expression of the epithelial marker E-cadherin (E) and the mesenchymal marker vimentin (V) at subcellular resolution ("EMT-IFA"). We report the discovery of β-catenin+ cancer cells that coexpress E-cadherin and vimentin in core-needle biopsies from patients with various advanced metastatic carcinomas, wherein these cells are transitioning between strongly epithelial and strongly mesenchymal-like phenotypes. Treatment of carcinoma models with anticancer drugs that differ in their mechanism of action (the tyrosine kinase inhibitor pazopanib in MKN45 gastric carcinoma xenografts and the combination of tubulin-targeting agent paclitaxel with the BCR-ABL inhibitor nilotinib in MDA-MB-468 breast cancer xenografts) caused changes in the tumor epithelial-mesenchymal character. Moreover, the appearance of partial EMT or mesenchymal-like carcinoma cells in MDA-MB-468 tumors treated with the paclitaxel-nilotinib combination resulted in upregulation of cancer stem cell (CSC) markers and susceptibility to FAK inhibitor. A metastatic prostate cancer patient treated with the PARP inhibitor talazoparib exhibited similar CSC marker upregulation. Therefore, the phenotypic plasticity conferred on carcinoma cells by EMT allows for rapid adaptation to cytotoxic or molecularly targeted therapy and could create a form of acquired drug resistance that is transient in nature. SIGNIFICANCE: Despite the role of EMT in metastasis and drug resistance, no standardized assessment of EMT phenotypic heterogeneity in human carcinomas exists; the EMT-IFA allows for clinical monitoring of tumor adaptation to therapy.


Conflict of interest statement

Disclosure of Potential Conflicts of Interest: The authors declare no potential conflicts of interest.

Figures

Figure 1.
Figure 1.. EMT-IFA quantitation of EMT biomarkers in a human ovarian carcinoma biopsy.
(A) Upper panel: H&E section of a formalin-fixed paraffin-embedded (FFPE) ovarian carcinoma biopsy pre-annotated by an anatomic pathologist to identify tumor (green outline) or non-tumor (cyan outline) areas, including normal or stromal tissues, inflammatory and/or necrotic regions, folds, and freeze artifacts. Lower panel: whole-slide EMT-IFA scan containing the annotated, tumor-containing regions of interest (ROIs) based on H&E, using square boxes of ~3.1×105 μm2 area for quantitative analysis. (B) Definiens analysis of representative ROIs from the EMT-IFA scan. Raw IFA image files of representative ROIs showing the relationship between E-cadherin (E) and vimentin (V) fluorescent layers (column 1) and the β-catenin layer (column 2). The β-catenin layer segments tumor (orange) from stromal tissues (blue) using Tissue Studio software (column 3). Pre-determined intensity thresholds for the EMT markers are applied to each tissue ROI for quantitative reporting of E (green) and V (red) expression (column 4) only within the segmented tumor areas. (C) Log10(V/E) for segmented tumor (left panel) or normal stromal tissues (right panel) generated by Definiens analysis for each ROI. (D) Mean ROI pixel areas for individual (E, green; V, red) or co-localized (yellow) EMT markers (μm2/cell).
Figure 2.
Figure 2.. EMT-IFA quantitation of EMT biomarkers in core biopsies from patients with various tumor histologies.
(A) Representative image fields from sections of FFPE core biopsies collected from the metastases of patients with various tumor histologies analyzed with the EMT-IFA. Row 1: H&E-stained sections. Row 2: raw immunofluorescence image files of an adjacent section analyzed with the EMT-IFA showing E-cadherin and vimentin as green and red, respectively, or yellow for co-localized signals. Row 3: β-catenin (yellow) fluorescent layer to segment tumor cells. Row 4: marker masks for E-cadherin (green), vimentin (red), or co-localized (yellow) signals on tumor segmented regions. (B) Scatter plots of log10(V/E) ratios from individual ROIs in each biopsy. Each point represents the log10(V/E) ratio in the segmented tumor regions of an ROI, with the bar representing the mean value for the biopsy. (C) Bar graphs of mean EMT marker pixel areas (μm2/cell) ± SD for each tumor biopsy; E+ in green, V+ in red, and E-cadherin/vimentin co-localized areas in yellow. The total number of analyzed ROIs (N) and the total number of evaluated tumor cells (C x 103) are provided for each biopsy.
Figure 3.
Figure 3.. Patterns of phenotypic expression and morphological characteristics in E+V+ and V+ cells derived from human carcinomas.
High-resolution images of clinical biopsies from patients with myoepithelial carcinoma of the parotid gland, prostate tumor, or colorectal carcinoma analyzed by EMT-IFA for β-catenin and DAPI to identify carcinoma cells and nuclei, respectively (column 2) and E-cadherin and vimentin (column 3), with the identity of tumor cells confirmed by tumor specific markers S100, PSA, and CEA (column 4), as well as H&E staining (column 1) of nearby sections from the same tumor biopsy. The EMT-IFA image of the patient with parotid gland carcinoma shows transitional cells with co-localized cell expression of membranous E-cadherin and cytoplasmic vimentin (white arrows), while other tumor cells are either only epithelial (E+; yellow arrow) or mesenchymal (V+; blue arrows). Similar transitional cells are found in the tumor sample from the patient with prostate cancer, whereas the patient with colorectal cancer exhibits areas of tumor heterogeneity (E+ or V+ carcinoma cells) but no transitional cells.
Figure 4.
Figure 4.. Evolution of epithelial-mesenchymal phenotypes in pazopanib-treated gastric cancer xenografts.
(A, B) Representative EMT-IFA images of (A) MKN45 and (B) SNU5 gastric xenografts treated with vehicle or pazopanib (100 mg/kg/day). (C) Log10(V/E) measurements for individual tumor ROIs indicate that pazopanib significantly shifted MKN45 tumors towards a less epithelial phenotype compared to vehicle-treated tumors (mean of −0.79 vs. −2.44, respectively; **p= 0.0023). (E) Stacked bar graphs showing the proportion of V+, E+, and E+V+ area (left) normalized to the total number of tumor cells assessed (right) (± SD error bars) demonstrate a significant decrease in E+ tumor cells (***p< 0.001 vs. vehicle), and significant increase in V+ tumor cells (**p= 0.003 vs. vehicle) and in E+V+ tumor cells (**p= 0.007 vs. vehicle) for MKN45 xenografts post-treatment. In contrast, SNU5 xenografts treated with pazopanib did not demonstrate significant changes in (D) log10(V/E) or (F) the proportion of cells with each phenotype (left). The shift toward a mesenchymal phenotype in MKN45 xenografts after treatment is accompanied by tumor stasis (G), while SNU5 xenografts displayed little response to treatment (H). Grey shaded areas in growth curves (± SD error bars) represent the time course of treatment and the arrows show the day tumor biopsies were harvested for analysis. P-values from t-tests comparing tumor volumes for vehicle vs. pazopanib groups (across all time points) are shown.
Figure 5.
Figure 5.. Pazopanib treatment leads to changes in expression of EMT biomarkers in patient tumor biopsies.
Core needle biopsies of advanced, refractory solid tumors in seven patients, obtained before and after a 1-week course of treatment with daily pazopanib (800 mg, oral administration), were analyzed by EMT-IFA. (A) Representative image fields from three patients before and after treatment. (B) Quantitation of the E-cadherin and vimentin-expressing areas using the log10(V/E) measure showed that biopsies from 4 of 7 patients displayed significant shifts towards a more mesenchymal phenotype. Statistical significance: **p< 0.01; ***p< 0.001. (C) Stacked bar graphs showing, for each patient, the proportion of V+, E+, and E+V+ area normalized to the total number of tumor cells assessed, yielding an estimate of the total number of tumor cells of each phenotype.
Figure 6.
Figure 6.. Paclitaxel alone and in combination with nilotinib yields loss of E+ cells and enrichment of residual V+ cells with CSC-like characteristics during treatment, with subsequent repopulation of E+ cells after cessation of therapy.
(A) Representative tumor field images of MDA-MB-468 xenografts after the start of treatment with vehicle, paclitaxel, or paclitaxel (15 mg/kg) combined with nilotinib (75 mg/kg), showing adjacent H&E staining and EMT-masked images of E+ (green), V+ (red), and E+V+ (yellow) tumor regions. “Day 1” tumor samples were collected 8 hours after the first treatment. “Day 58” tumor samples were collected 37 days after the cessation of treatment; black arrows in (D) denote the timing of xenograft tumor sampling. High-magnification EMT-IFA images of these specimens are shown in Supplementary Figure S13. (B) Total number of V+, E+, and E+V+ tumor cells observed for each timepoint and treatment group. (C) Scatter plots of log10(V/E) (black bar represents the mean) of individual tumor xenografts from each treatment groups and timepoints. (D) Tumor growth curves (± SD error bars) with treatment duration represented as gray shaded areas. Xenograft tumor sampling is indicated with black arrows. (E) Tumor growth curves (± SD error bars) for MDA-MB-468 xenograft models treated for 21 days with the combination of nilotinib (75 mg/kg daily) and paclitaxel (15 mg/kg once weekly), followed by treatment with either vehicle (red) or the CSC-targeting FAK inhibitor (FAKi) VS-4718 (100 mg/kg twice daily; blue) from study days 54–132 (treatment durations are indicated for each group by colored lines at the top of the graph). An additional group was treated with the appropriate vehicle-only throughout the experiment (black). Asterisks indicate a significant difference in the mean log(area under the curve), from day 54–132, for the animals treated with vehicle vs. FAK inhibitor (**p = 0.005).
Figure 7.
Figure 7.. Changes in epithelial-mesenchymal phenotype and detection of stem-like cells in tumor biopsy specimens from patients treated with talazoparib.
(A) Representative ROIs in serial sections of baseline and post-treatment (cycle 1, day 8) core needle tumor biopsies from a patient with BRCA-mutant prostate cancer (cervical lymph node lesion) who exhibited a partial response (PR) to treatment (left) and a patient with BRCA-mutant breast cancer (supraclavicular lymph node lesion) who had a best response of stable disease (SD; right) were analyzed for EMT and cancer stem cell markers, revealing a drug-induced shift to a more mesenchymal phenotype in residual tumor cells remaining after treatment, associated with the appearance of cancer stem cell markers. Masks of EMT and CSC markers are shown in false colors on multiple co-stained adjacent/nearby slide sections. Top panels: EMT markers E-cadherin (green), vimentin (red), and co-localization of the two (yellow). Middle panels: EMT/CSC marker NANOG (green), CSC marker ALDH1 (red), and co-localization of the two (yellow). Bottom panels: CSC markers CD44v6 (green) and CD133 (red), and co-localization of the two (yellow). The tumor segmented area is color-coded black to more easily visualize the staining of the CSC markers. Scale bars indicate 50 μm. (B) Quantitation of tumor cells and their EMT phenotypes showed a significant decrease in the total number as well as the proportion of E-cadherin–expressing and mixed-phenotype cells in the responding prostate cancer patient after treatment, while no substantial changes in EMT phenotype were observed for the breast cancer patient with a best response of stable disease.

References

    1. Chaffer CL, San Juan BP, Lim E, Weinberg RA. EMT, cell plasticity and metastasis. Cancer Metastasis Rev 2016;35:645–54. - PubMed
    1. Lamouille S, Xu J, Derynck R. Molecular mechanisms of epithelial-mesenchymal transition. Nat Rev Mol Cell Biol 2014;15:178–96. - PMC - PubMed
    1. De Craene B, Berx G. Regulatory networks defining EMT during cancer initiation and progression. Nat Rev Cancer 2013;13:97–110. - PubMed
    1. Steinestel K, Eder S, Schrader AJ, Steinestel J. Clinical significance of epithelial-mesenchymal transition. Clin Transl Med 2014;3:17. - PMC - PubMed
    1. Bastid J. EMT in carcinoma progression and dissemination: facts, unanswered questions, and clinical considerations. Cancer Metastasis Rev 2012;31:277–83. - PubMed

Publication types

MeSH terms