. 2020 Apr;34(4):1075-1089.
doi: 10.1038/s41375-019-0638-y. Epub 2019 Nov 15.

Distinct effects of ruxolitinib and interferon-alpha on murine JAK2V617F myeloproliferative neoplasm hematopoietic stem cell populations

Affiliations

Distinct effects of ruxolitinib and interferon-alpha on murine JAK2V617F myeloproliferative neoplasm hematopoietic stem cell populations

Rebecca J Austin et al. Leukemia. 2020 Apr.

Abstract

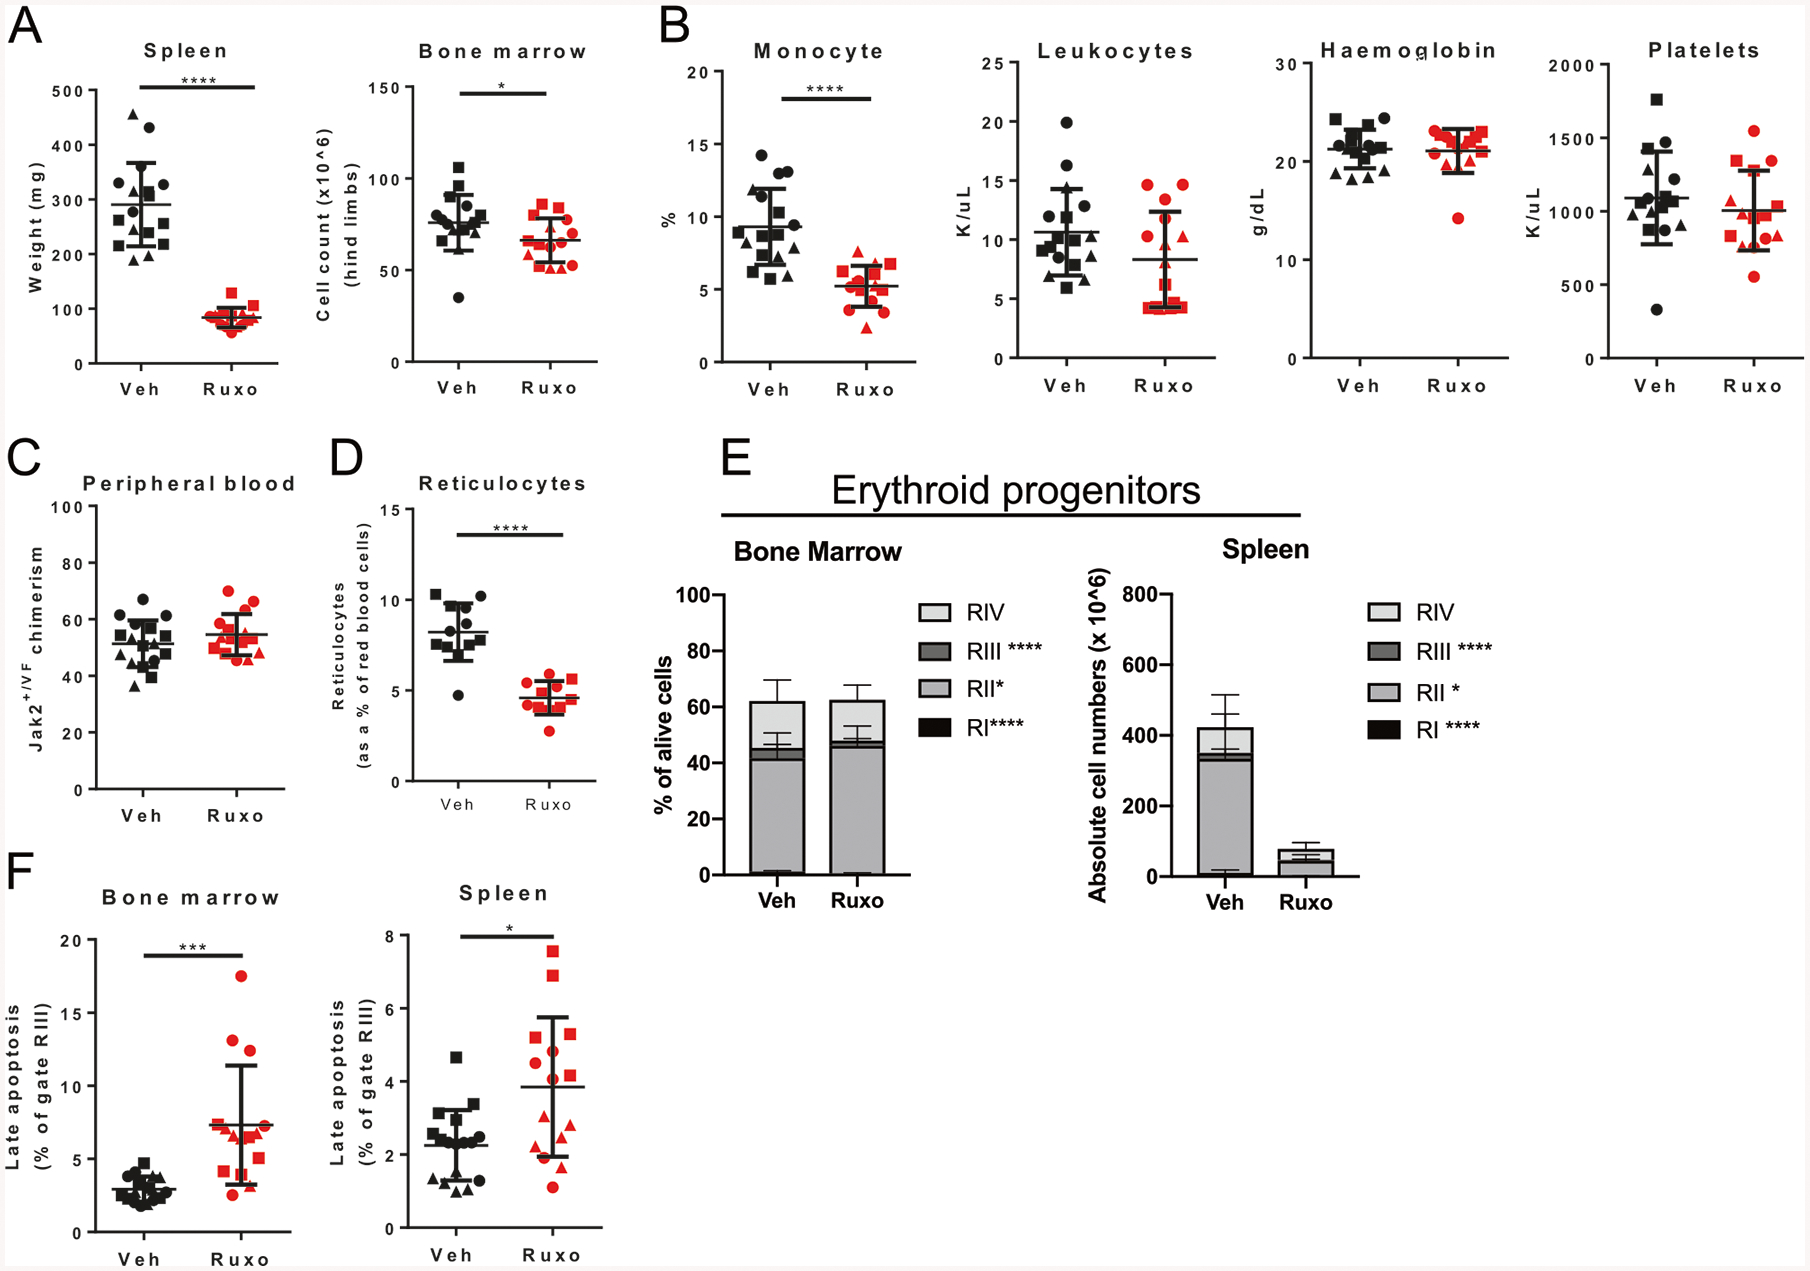
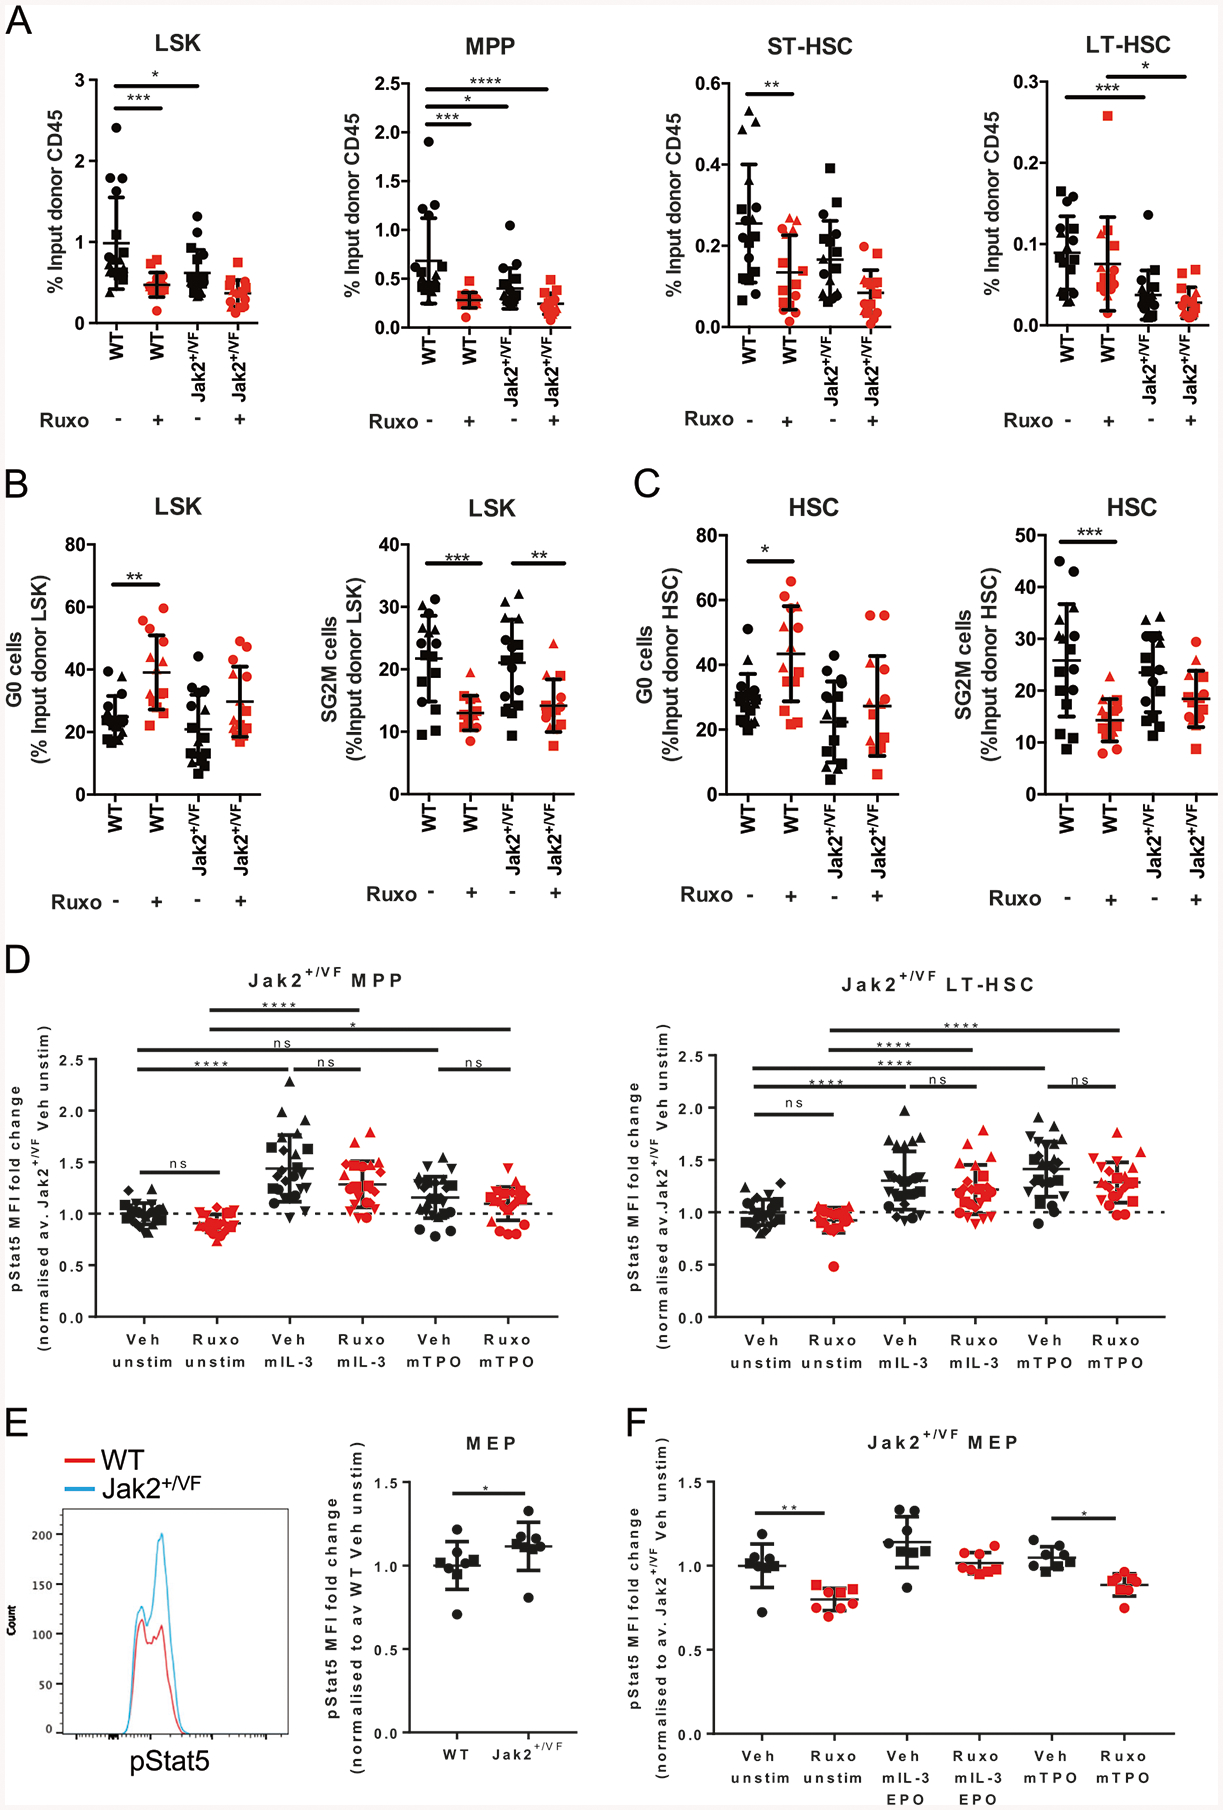
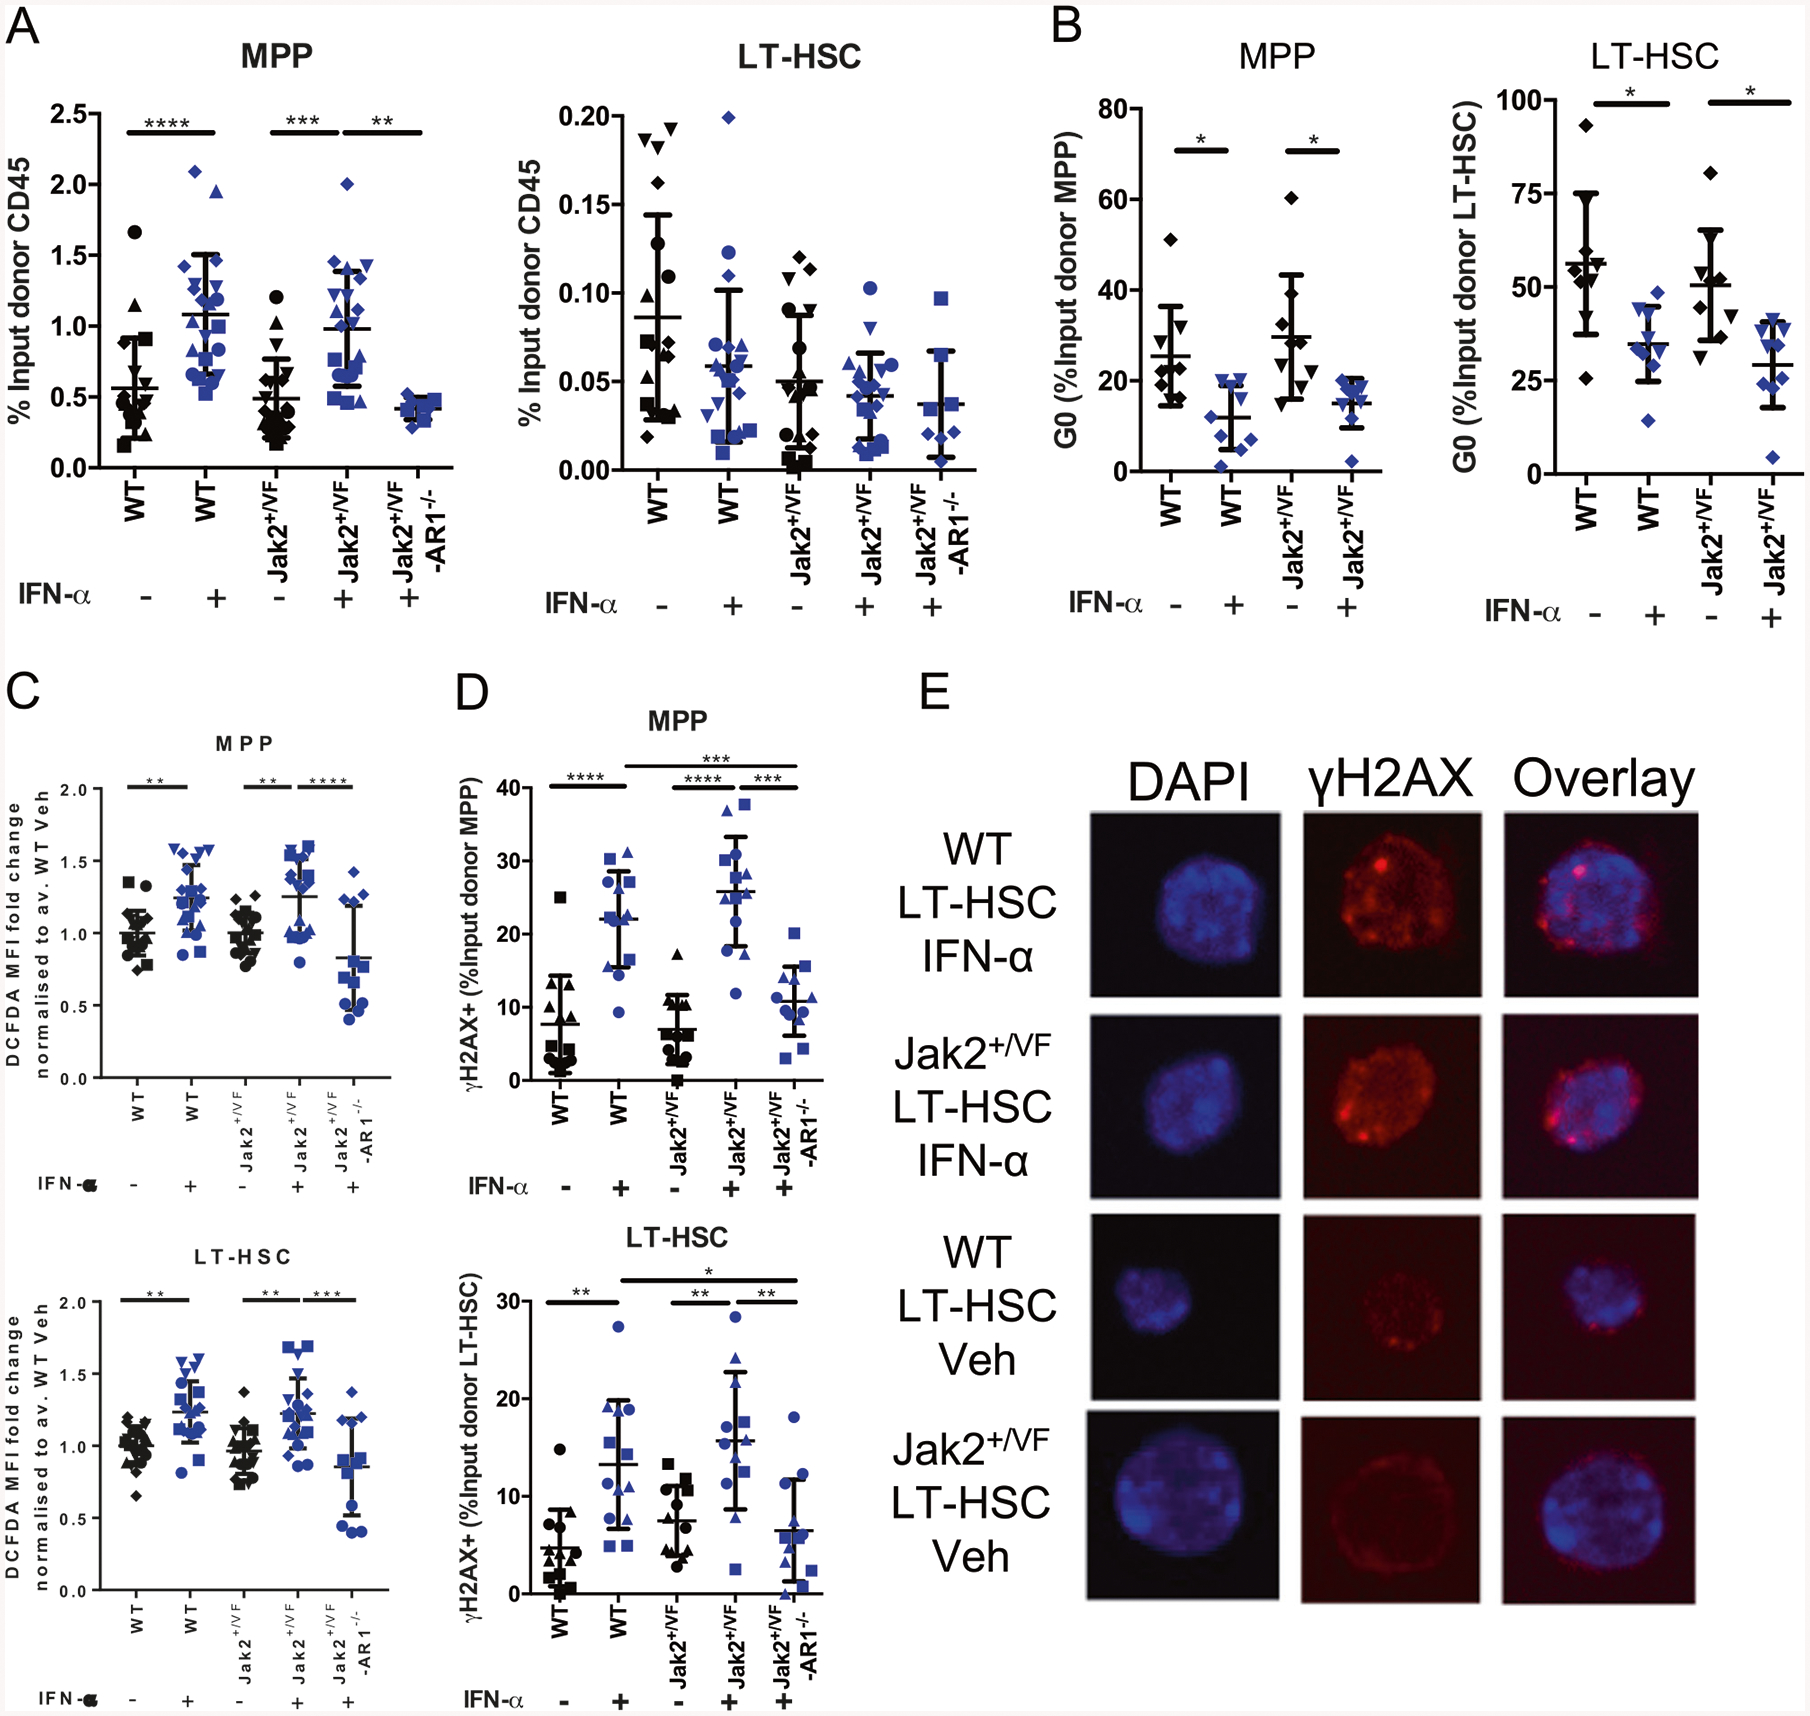
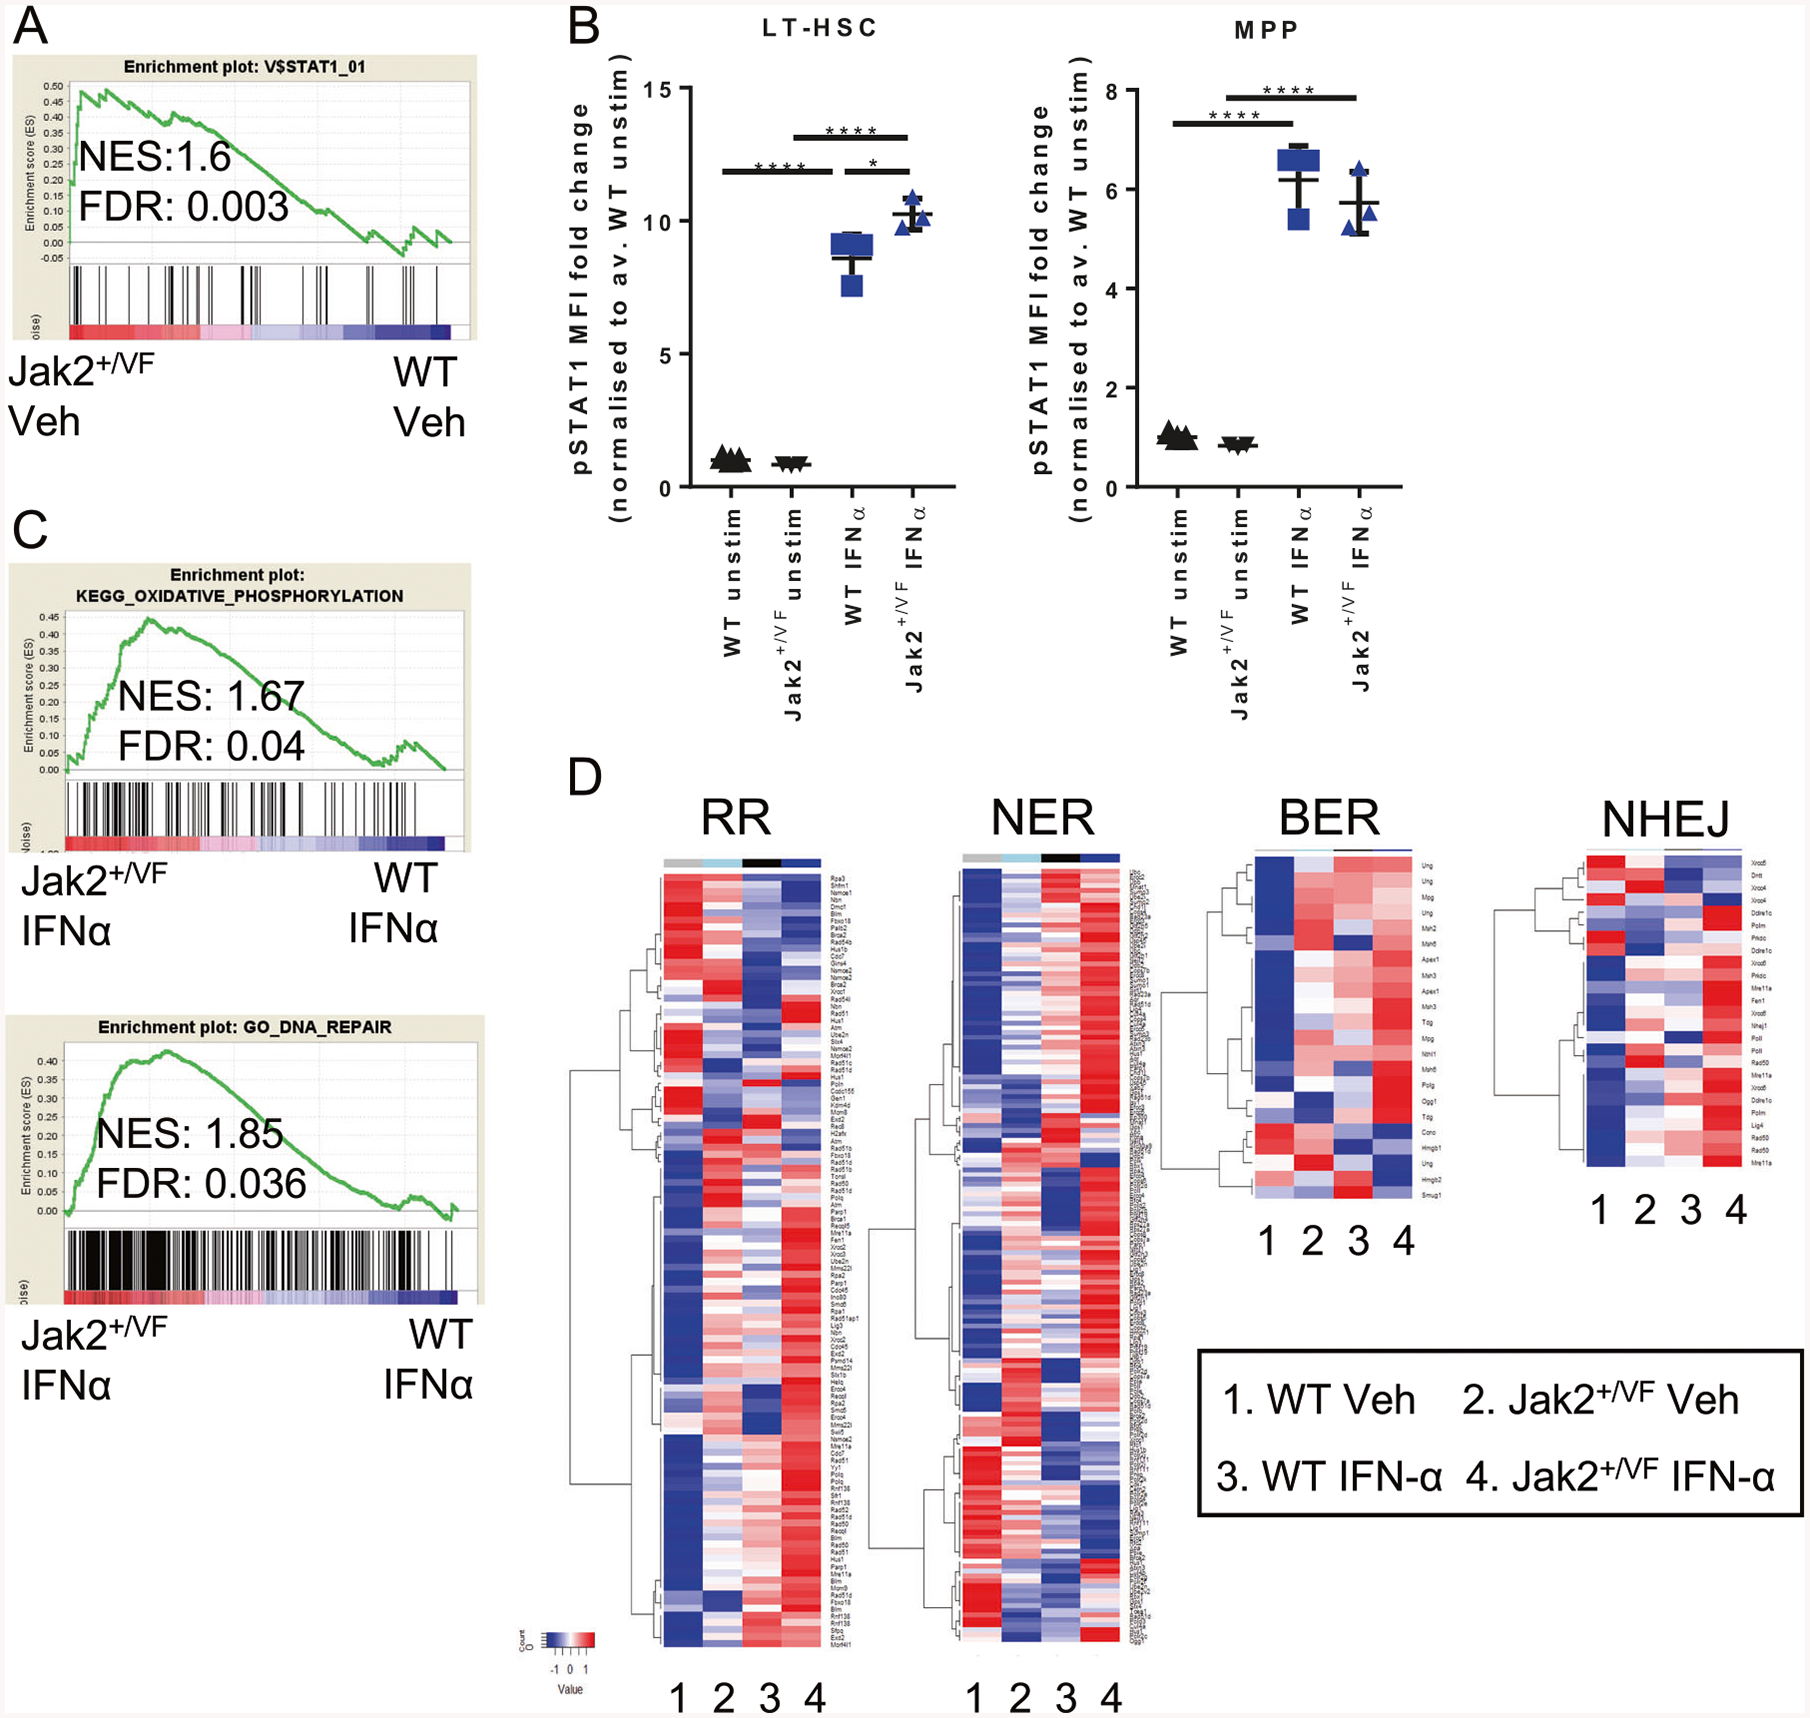
JAK2V617F is the most common mutation in patients with BCR-ABL negative myeloproliferative neoplasms (MPNs). The eradication of JAK2V617F hematopoietic stem cells (HSCs) is critical for achieving molecular remissions and cure. We investigate the distinct effects of two therapies, ruxolitinib (JAK1/2 inhibitor) and interferon-alpha (IFN-α), on the disease-initiating HSC population. Whereas ruxolitinib inhibits Stat5 activation in erythroid progenitor populations, it fails to inhibit this same pathway in HSCs. In contrast, IFN-α has direct effects on HSCs. Furthermore, STAT1 phosphorylation and pathway activation is greater after IFN-α stimulation in Jak2V617F murine HSCs with increased induction of reactive oxygen species, DNA damage and reduction in quiescence after chronic IFN-α treatment. Interestingly, ruxolitinib does not block IFN-α induced reactive oxygen species and DNA damage in Jak2V617F murine HSCs in vivo. This work provides a mechanistic rationale informing how pegylated IFN-α reduces JAK2V617F allelic burden in the clinical setting and may inform future clinical efforts to combine ruxolitinib with pegylated IFN-α in patients with MPN.


Conflict of interest statement

Conflict of interest SWL has participated in advisory boards for Novartis. Pegylated murine IFN-α (mP1101) was a gift from Pharmaessentia. FHH has served as a consultant for and has received research funding from Novartis Inc. SJL, NTC, and CWL are employees of PharmaEssentia Co. The other authors declare that they have no conflict of interest.

Figures

Fig. 1
Fig. 1
Ruxolitinib depletes erythroid progenitor cells but does not reduce Jak2V617F allelic burden. WT/Jak2+/VF chimeric mice treated for 4 weeks with vehicle (Veh) or ruxolitinib (Ruxo) demonstrating a spleen weight and BM cellularity, b PB leukocyte count, hemoglobin, monocytes, platelets, c Jak2+/VF chimerism and d reticulocytes. WT/Jak2+/VF chimeric mice treated with ten doses of vehicle or ruxolitinib demonstrating frequency of e erythroid progenitors in BM and spleen and f apoptotic RIII erythroid progenitors in the BM and spleen. Each point represents a biological replicate. Statistics are shown for relevant comparisons mentioned in text. Pooled data from three experiments, each experiment identified with a different symbol shape. Student’s t test, *p < 0.05, ***p < 0.001, ****p < 0.0001
Fig. 2
Fig. 2
Ruxolitinib does not affect Jak2 MPN disease-initiating LT-HSCs. WT/Jak2+/VF chimeric mice were treated for 4 weeks with vehicle or ruxolitinib. a Frequency of BM WT and Jak2+/VF LSKs, MPPs, ST-HSCs, and LT-HSCs expressed as a percentage of the respective input donor CD45+ population (WT-CD45.1, Jak2+/VF−CD45.2). b Frequency of quiescent (G0) and cycling (SG2M) WT and Jak2+/VF LSKs and c WT and Jak2+/VF HSCs (LSK+ CD150+). d WT/Jak2+/VF chimeric mice were treated with ten doses of vehicle or ruxolitinib (60 mg/kg bid). Mean fluorescence intensity (MFI) of phosphorylated STAT5 (pSTAT5) in Jak2+/VF MPPs and LT-HSCs with or without ex vivo stimulation by murine IL-3 or TPO, expressed as fold change over the vehicle (Veh) unstimulated (unstim) control average (av.). e Representative basal phosphorylated STAT5 histograms of WT and Jak2+/VF bone marrow MEPs and MFI calculated, expressed as fold change over the WT average. f MFI of phosphorylated STAT5 of bone marrow Jak2+/VF MEPs+/− in vivo ruxolitinib and +/− ex vivo stimulation with mIL-3 or mTPO, expressed as fold change over the Veh unstim control average. Each point represents a biological replicate. Pooled data from three experiments for 4 weeks ruxolitinib treatment, and pooled data from five experiments for pSTAT5. Each experiment identified with a different symbol shape. Statistics are shown for relevant comparisons mentioned in text. One-way ANOVA, post-Tukey test, * p < 0.05, **p < 0.01, ***p < 0.001, ****p < 0.0001
Fig. 3
Fig. 3
IFN-α induces ROS and DNA damage in Jak2+/VF LT-HSCs. WT/Jak2+/VF chimeric mice treated with 50 K IU murine recombinant IFN-α or vehicle and bone marrow HSPCs analyzed 48 h post injection. a Frequency of BM WT and Jak2+/VF MPPs (LSK+ CD48+) and LT-HSCs (LSK+ CD48−) expressed as a percentage of the respective input donor CD45+ population (WT-CD45.1, Jak2+/VF-CD45.2). b G0, G1, and SG2M cell cycle status of MPPs, and LT-HSCs. c ROS production for MPPs and LT-HSCs shown as DCFDA MFI, expressed as fold change over WT vehicle (Veh) control average. d Frequency of γH2AX+ MPPs and LT-HSCs as determined by flow cytometry. e Immunofluorescence microscopy visualization of γH2AX foci in vehicle and IFN-α treated LT-HSCs. Each point represents a biological replicate. Pooled data from 3 to 5 experiments, each experiment identified with a different symbol shape. Statistics are shown for relevant comparisons mentioned in text. One-way ANOVA, post Tukey test, *p < 0.05, **p < 0.01, ***p < 0.001, ****p < 0.0001
Fig. 4
Fig. 4
Jak2+/VF LT-HSCs exhibit STAT1 hypersensitivity after IFN-α. a Microarray analysis of WT and Jak2+/VF HSCs (LSK CD150+) shows enrichment of STAT1 signaling in Jak2+/VF HSCs. b Sorted WT and Jak2+/VF LSKs were rested overnight and then treated +/− ex vivo with 1000 U/ml murine recombinant IFN-α and stained for CD48 and intracellular phosphorylated STAT1. MFI of phosphorylated STAT1 in ex vivo treated LT-HSCs and MPPs, expressed as fold change over WT vehicle (Veh) treated unstimulated control average. c Microarray was performed on HSCs (LSK CD150+) isolated from WT/Jak2+/VF chimeric mice treated with 10 K IU murine unmodified IFN-α or vehicle per day for 4 weeks. Jak2+/VF IFN-α treated HSCs are enriched for oxidative phosphorylation and DNA repair gene signatures compared with IFN-α treated WT HSCs. d Heatmaps showing averaged gene expression of genes involved in DNA repair pathways in WT and Jak2+/VF vehicle treated and IFN-α treated HSCs. Each point represents a biological replicate. One-way ANOVA, post-Tukey test, *p < 0.05, **p < 0.01, ***p < 0.001, ****p < 0.0001
Fig. 5
Fig. 5
Chronic treatment with peg-IFN-α reduces peripheral disease parameters and Jak2V617F allelic burden. WT/Jak2+/VF chimeric mice treated weekly for 4 weeks with peg-IFN-α (600 ng) or vehicle (0.1% BSA/PBS) demonstrating a spleen weights, b PB leukocyte count and hematocrit. WT/Jak2+/VF chimeric mice treated weekly for 8 weeks with peg-IFN-α (600 ng) or vehicle (0.1% BSA/PBS) demonstrating c Jak2+/VF chimerism in the peripheral blood of the vehicle and peg-IFN-α group. WT/Jak2+/VF chimeric mice treated weekly for 4 weeks with peg-IFN-α (600 ng) or vehicle (0.1% BSA/PBS) demonstrating d frequency of erythroid progenitors (RI, RII, RIII, and RIV) in bone marrow and spleen and e frequency of MPPs and LT-HSCs. Each point represents a biological replicate. Pooled data from two experiments, each experiment identified with a different symbol shape. Statistics are shown for relevant comparisons mentioned in text. One-way ANOVA, post-Tukey test, *p < 0.05, **p < 0.01, ***p < 0.001, ****p < 0.0001
Fig. 6
Fig. 6
Chronic treatment with peg-IFN-α preferentially targets Jak2+/VF LT-HSCs through activation of cell cycle, induction of ROS and the accumulation of DNA damage. WT/Jak2+/VF chimeric mice treated weekly for 4 weeks with peg-IFN-α (600 ng) or vehicle (0.1%BSA/PBS) demonstrating a G0,G1, and SG2M cell cycle status of MPPs, b ROS production for MPPs shown as DCFDA MFI fold change, normalized to average WT vehicle (Veh) treated MFI, c frequency of γH2AX+ MPPs, d G0, G1, and SG2M cell cycle status of LT-HSCs, including representative flow cytometry plots of cell cycle distribution. e ROS production for LT-HSCs shown as DCFDA MFI, expressed as fold change over WT Veh average, including representative DCFDA histograms. f frequency of γH2AX+ LT-HSCs, including representative γH2AX histograms. Each point represents a biological replicate. Pooled data from two experiments, each experiment identified with a different symbol shape. Statistics are shown for relevant comparisons mentioned in text. One-way ANOVA, post-Tukey test, *p < 0.05, **p < 0.01, ***p < 0.001, ****p < 0.0001
Fig. 7
Fig. 7
IFN-α and ruxolitinib target different cell populations in vivo. a Phosphorylated STAT1 MFI in ex vivo treated MPPs and LT-HSCs, expressed as fold change over WT vehicle (Veh) control average, including representative histograms for LT-HSCs. b Phosphorylated STAT1 MFI in ex vivo treated MPPs and LT-HSCs from WT/Jak2+/VF chimeric mice treated with in vivo ruxolitinib, expressed as fold change over WT Veh unstimulated control average. c Experimental schema for combination Ruxolitinib and IFN-α treatment of WT/Jak2+/VF chimeric mice, demonstrating d frequency of Jak2+/VF LT-HSCs, e G0 and SG2M cell cycle status of Jak2+/VF LT-HSCs, f Jak2+/VF LT-HSC ROS production as measured by DCFDA MFI, expressed as fold change over IFN-α treated average. g Frequency of γH2AX+ Jak2+/VF LT-HSCs. Each point represents a biological replicate. Pooled data from two experiments for pSTAT1 analysis and pooled data from 3 to 4 experiments for combination treatment analysis. Each experiment identified with a different symbol shape. Unequal numbers caused by a mechanical failure of blood analyser during one experiment. Statistics are shown for relevant comparisons mentioned in text. One-way ANOVA, post-Tukey test, *p < 0.05, **p < 0.01, ***p < 0.001, ****p < 0.0001

References

    1. Ishii T, Bruno E, Hoffman R, Xu M. Involvement of various hematopoietic-cell lineages by the JAK2V617F mutation in polycythemia vera. Blood. 2006;108:3128–34. - PubMed
    1. Jamieson CH, Gotlib J, Durocher JA, Chao MP, Mariappan MR, Lay M, et al. The JAK2 V617F mutation occurs in hematopoietic stem cells in polycythemia vera and predisposes toward erythroid differentiation. Proc Natl Acad Sci USA. 2006;103:6224–9. - PMC - PubMed
    1. Baxter EJ, Scott LM, Campbell PJ, East C, Fourouclas N, Swanton S, et al. Acquired mutation of the tyrosine kinase JAK2 in human myeloproliferative disorders. Lancet. 2005;365: 1054–61. - PubMed
    1. James C, Ugo V, Le Couedic JP, Staerk J, Delhommeau F, Lacout C, et al. A unique clonal JAK2 mutation leading to constitutive signalling causes polycythaemia vera. Nature. 2005;434:1144–8. - PubMed
    1. Kralovics R, Passamonti F, Buser AS, Teo S-S, Tiedt R, Passweg JR, et al. A gain-of-function mutation of JAK2 in myeloproliferative disorders. New Engl J Med. 2005;352:1779–90. - PubMed

Publication types

MeSH terms