

Microvascular complications burden (nephropathy, retinopathy and peripheral polyneuropathy) affects risk of major vascular events and all-cause mortality in type 1 diabetes: a 10-year follow-up study
- PMID: 31733651
- PMCID: PMC6858978
- DOI: 10.1186/s12933-019-0961-7
Microvascular complications burden (nephropathy, retinopathy and peripheral polyneuropathy) affects risk of major vascular events and all-cause mortality in type 1 diabetes: a 10-year follow-up study
Abstract
Background: Microvascular complications (MC) have been claimed to increase the risk for cardiovascular disease in diabetic subjects. However, the effect of MC burden on the risk of major vascular outcomes and all-cause mortality in type 1 diabetes is still poorly explored. We evaluated the relationship between microvascular complications burden and incidence of major cardiovascular events and all-cause mortality in subjects with type 1 diabetes.
Methods: We recruited 774 participants with type 1 diabetes in a single-center observational study over a follow-up of 10.8 ± 2.5 years. Hazard ratios (HR) for cardiovascular outcomes and all-cause death associated with microvascular complications were determined by unadjusted and adjusted Cox regression analysis.
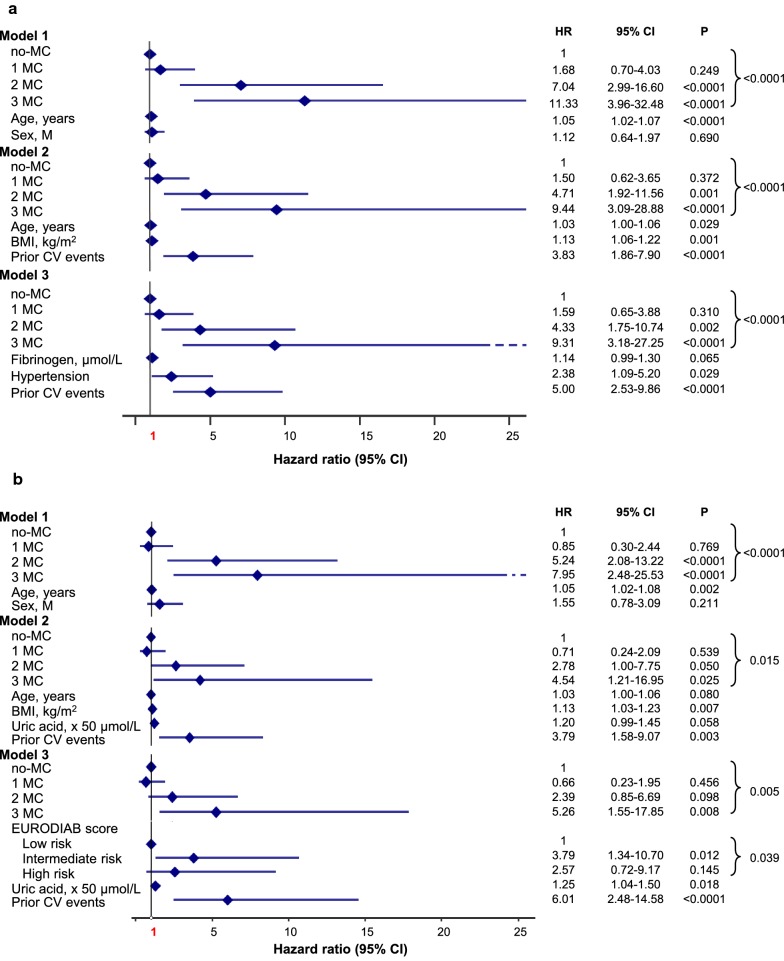
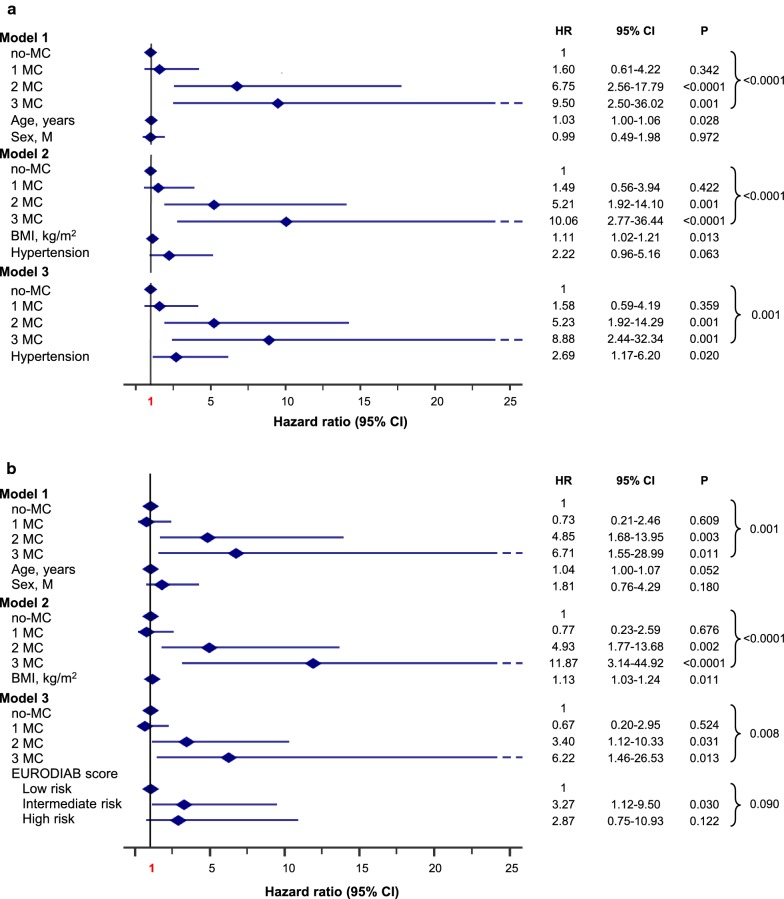
Results: Out of 774 individuals, 54.9% had no-MC, 32.3% 1 MC, 9.7% 2 MC and 3.1% 3 MC. A total of 54 deaths (7.0%) occurred. Death rate increased from no-MC 2.1% (Ref) to 1 MC 7.2% (HR 3.54 [95% CI 1.59-7.87]), 2 MC 14.7% (HR 6.41 [95% CI 2.65-15.49]) and 3 MC 66.7% (HR 41.73 [95% CI 18.42-94.57], p < 0.0001). After adjustments, HRs were: 1 MC 2.05 (95% CI 0.88-4.76), 2 MC 1.98 (95% CI 0.75-5.21), 3 MC 7.02 (95% CI 2.44-20.20, p = 0.002). Forty-nine subjects (6.7%) had at least one cardiovascular event, and cumulative incidence went from no-MC 2.2% (Ref) to 1 MC 5.0%; (HR 2.27 [95% CI 0.96-5.38]), 2 MC 26.8% (HR 12.88 [95% CI 5.82-28.50]) and 3 MC 40.9% (HR 29.34 [95% CI 11.59-74.25], p < 0.0001). Upon adjustments, HRs were: 1 MC 1.59 (95% CI 0.65-3.88), 2 MC 4.33 (95% CI 1.75-10.74), 3 MC 9.31 (95% CI 3.18-27.25, p < 0.0001). Thirty-five individuals (4.8%) had at least one coronary event, which cumulative incidence increased with MC burden (p < 0.0001).
Conclusions: In type 1 diabetes, microvascular complications burden increases in an independent dose-dependent manner the risk of major cardiovascular outcomes and all-cause mortality. The presence and number of microvascular complications should be considered in stratifying overall cardiovascular risk in type 1 diabetes.
Keywords: All-cause mortality; Cardiovascular disease; Diabetic kidney disease; Diabetic retinopathy; Microvascular burden; Microvascular complications; Peripheral diabetic polyneuropathy; Type 1 diabetes mellitus.
Conflict of interest statement
MG has received travel grants from AstraZeneca and Novo Nordisk. MA has received speaker/advisory honoraria from Abbott Laboratories. FC has received travel grants from Novo Nordisk. GD reports past participation in advisory boards from AstraZeneca, Eli Lilly and Co and Novartis Pharmaceuticals. SDP reports past participation in advisory boards and/or receiving research grants from Abbott Laboratories, AstraZeneca, Boehringer Ingelheim, Eli Lilly and Co, Merck Sharp & Dohme, Novartis Pharmaceuticals, Novo Nordisk, Sanofi, Servier, and Takeda Pharmaceuticals. GP has received travel grants and speaker/advisory honoraria from AstraZeneca, Boehringer Ingelheim, Eli Lilly and Co, Merck Sharp & Dohme, Mundipharma Pharmaceuticals, Novo Nordisk, and Takeda Pharmaceuticals. All other authors (EG, RG, DL, MR, and PF) declare that they have no competing interests.
Figures


References
-
- Diabetes Control and Complications Trial (DCCT)/Epidemiology of Diabetes Interventions and Complications (EDIC) Study Research Group Mortality in type 1 diabetes in the DCCT/EDIC versus the general population. Diabetes Care. 2016;39(8):1378–1383. - PubMed
-
- Secrest AM, Becker DJ, Kelsey SF, LaPorte RE, Orchard TJ. All-cause mortality trends in a large population-based cohort with long-standing childhood-onset type 1 diabetes: the Allegheny County type 1 diabetes registry. Diabetes Care. 2010;33(12):2573–2579. doi: 10.2337/dc10-1170. - DOI - PMC - PubMed
-
- Soedamah-Muthu SS, Fuller JH, Mulnier HE, Raleigh VS, Lawrenson RA, Colhoun HM. All-cause mortality rates in patients with type 1 diabetes mellitus compared with a non-diabetic population from the UK general practice research database, 1992–1999. Diabetologia. 2006;49(4):660–666. doi: 10.1007/s00125-005-0120-4. - DOI - PubMed
Publication types
MeSH terms
LinkOut - more resources
Full Text Sources
Medical
