

The 2019 report of The Lancet Countdown on health and climate change: ensuring that the health of a child born today is not defined by a changing climate
- PMID: 31733928
- PMCID: PMC7616843
- DOI: 10.1016/S0140-6736(19)32596-6
The 2019 report of The Lancet Countdown on health and climate change: ensuring that the health of a child born today is not defined by a changing climate
Abstract
The Lancet Countdown is an international, multidisciplinary collaboration, dedicated to monitoring the evolving health profile of climate change, and providing an independent assessment of the delivery of commitments made by governments worldwide under the Paris Agreement.
The 2019 report presents an annual update of 41 indicators across five key domains: climate change impacts, exposures, and vulnerability; adaptation, planning, and resilience for health; mitigation actions and health co-benefits; economics and finance; and public and political engagement. The report represents the findings and consensus of 35 leading academic institutions and UN agencies from every continent. Each year, the methods and data that underpin the Lancet Countdown’s indicators are further developed and improved, with updates described at each stage of this report. The collaboration draws on the world-class expertise of climate scientists; ecologists; mathematicians; engineers; energy, food, and transport experts; economists; social and political scientists; public health professionals; and doctors, to generate the quality and diversity of data required.
The science of climate change describes a range of possible futures, which are largely dependent on the degree of action or inaction in the face of a warming world. The policies implemented will have far-reaching effects in determining these eventualities, with the indicators tracked here monitoring both the present-day effects of climate change, as well as the worldwide response. Understanding these decisions as a choice between one of two pathways—one that continues with the business as usual response and one that redirects to a future that remains “well below 2°C”—helps to bring the importance of recognising the effects of climate change and the necessary response to the forefront.
Evidence provided by the Intergovernmental Panel on Climate Change, the International Energy Agency, and the US National Aeronautics and Space Administration clarifies the degree and magnitude of climate change experienced today and contextualises these two pathways.
The impacts of climate change on human health: The world has observed a 1°C temperature rise above pre-industrial levels, with feedback cycles and polar amplification resulting in a rise as high as 3°C in north western Canada., Eight of the ten hottest years on record have occurred in the past decade. Such rapid change is primarily driven by the combustion of fossil fuels, consumed at a rate of 171 000 kg of coal, 116 000 000 L of gas, and 186 000 L of oil per s.– Progress in mitigating this threat is intermittent at best, with carbon dioxide emissions continuing to rise in 2018. Importantly, many of the indicators contained in this report suggest the world is following this “business as usual” pathway.
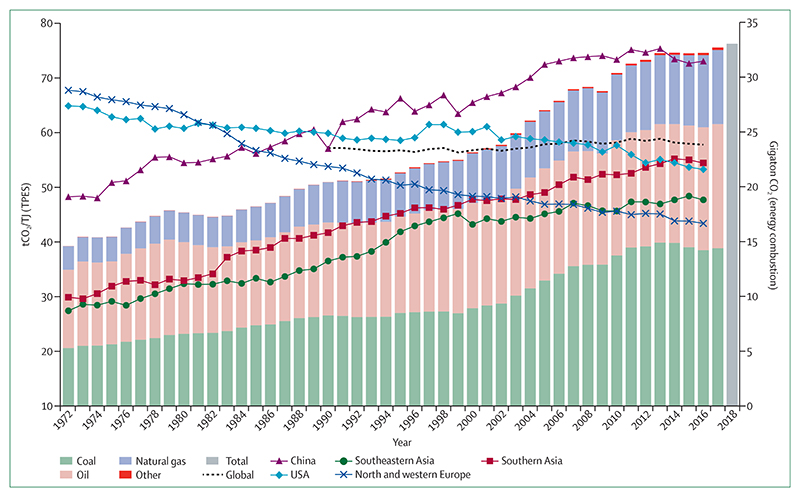
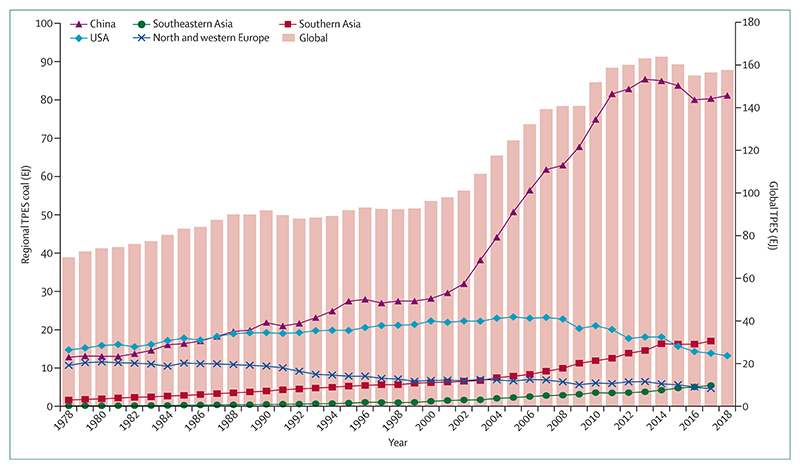
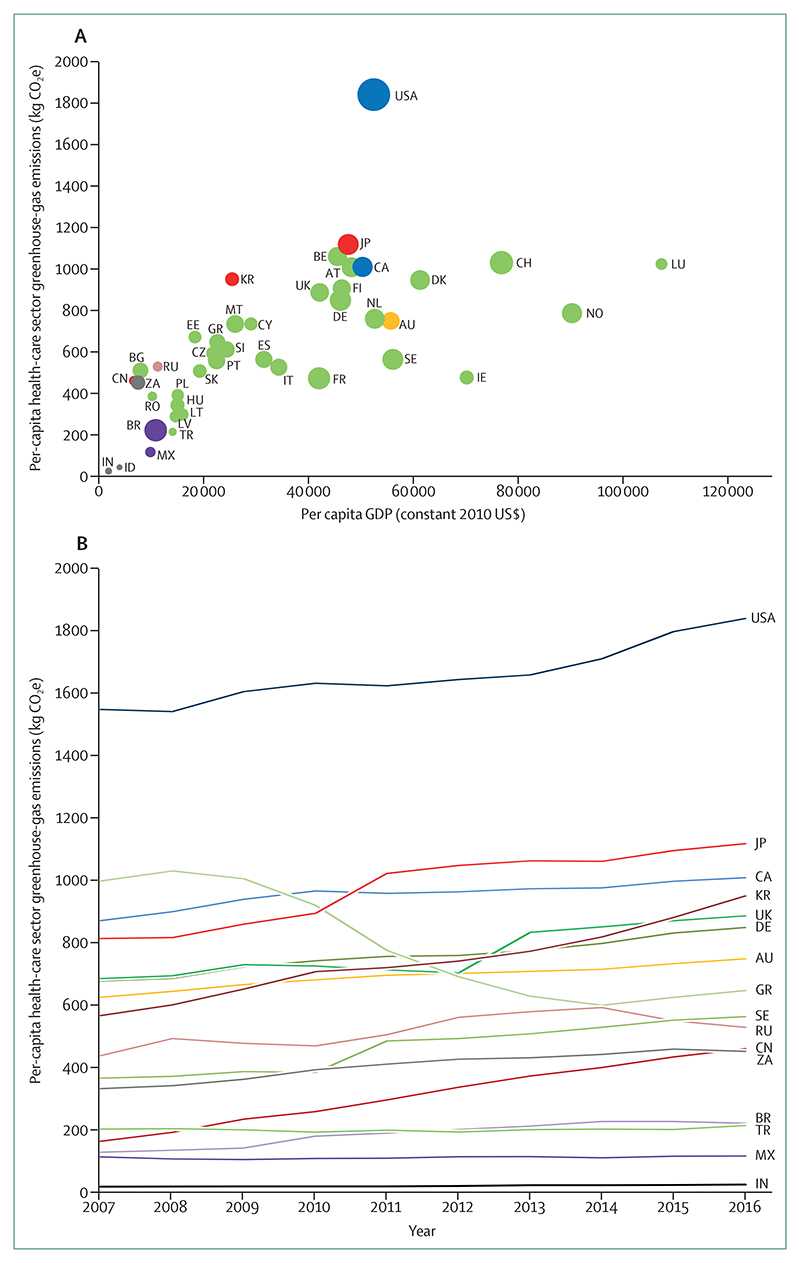
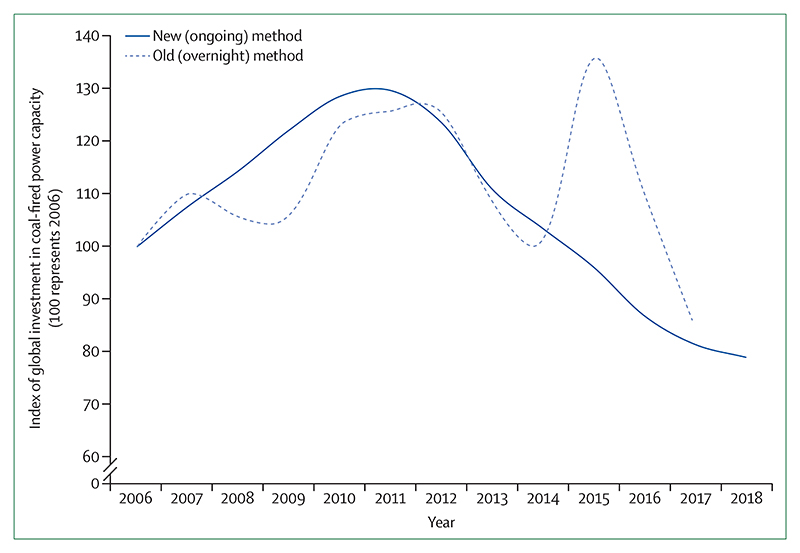
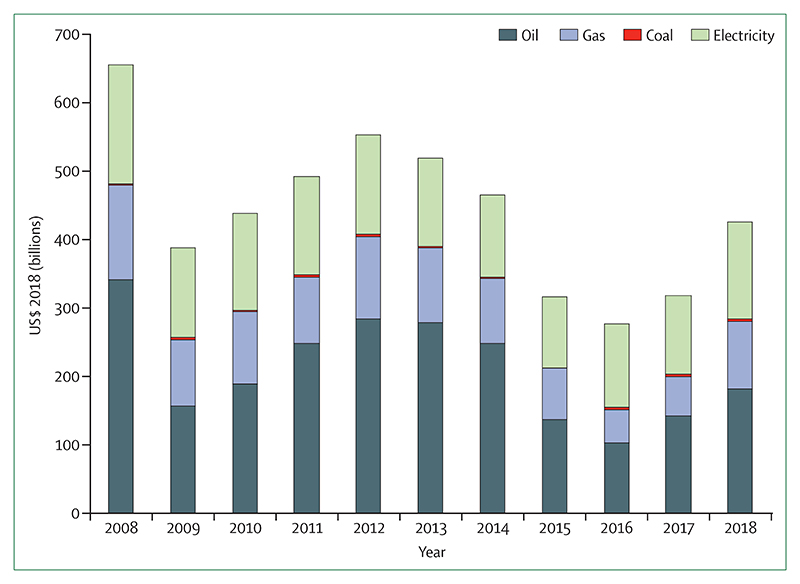
The carbon intensity of the energy system has remained unchanged since 1990 (indicator 3.1.1), and from 2016 to 2018, total primary energy supply from coal increased by 1·7%, reversing a previously recorded downward trend (indicator 3.1.2). Correspondingly, the health-care sector is responsible for about 4·6% of global emissions, a value which is steadily rising across most major economies (indicator 3.6). Global fossil fuel consumption subsidies increased by 50% over the past 3 years, reaching a peak of almost US$430 billion in 2018 (indicator 4.4.1).
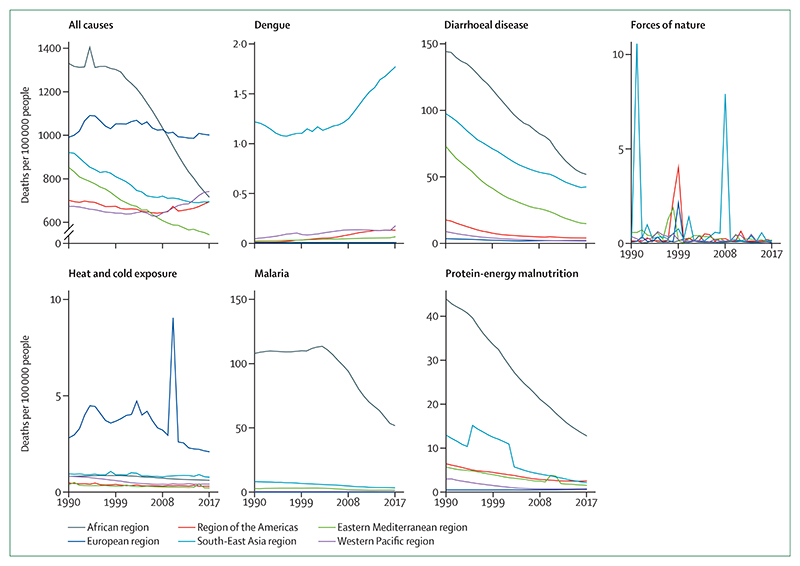
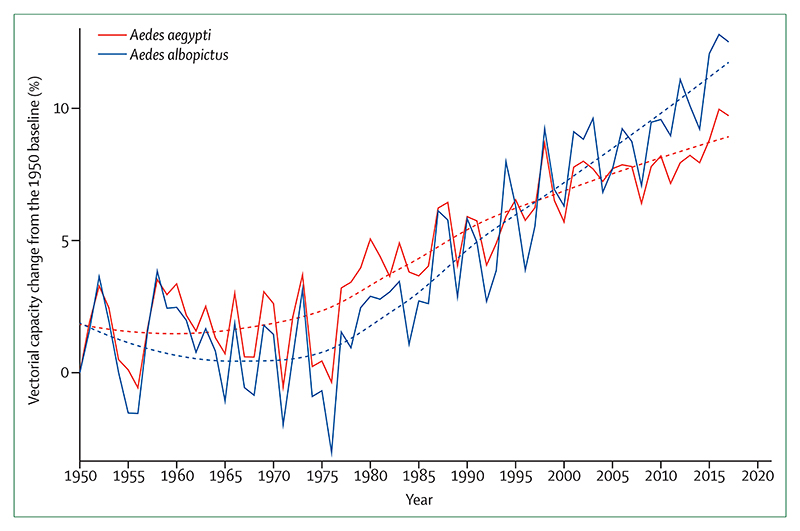
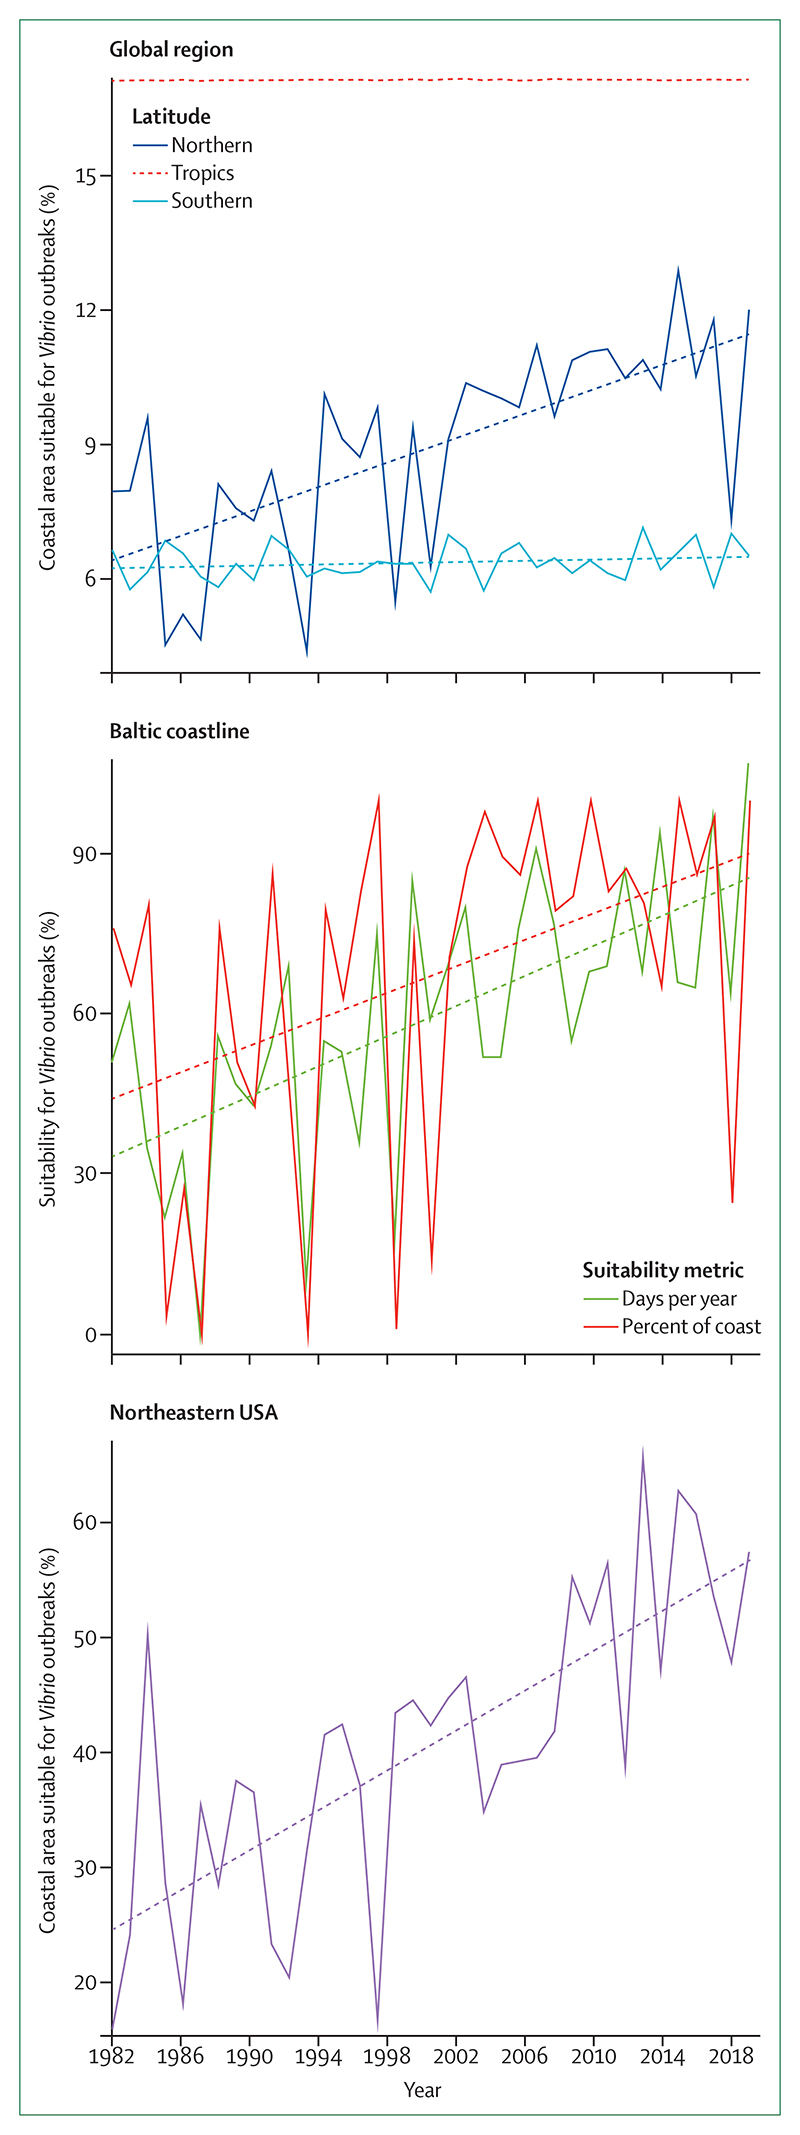
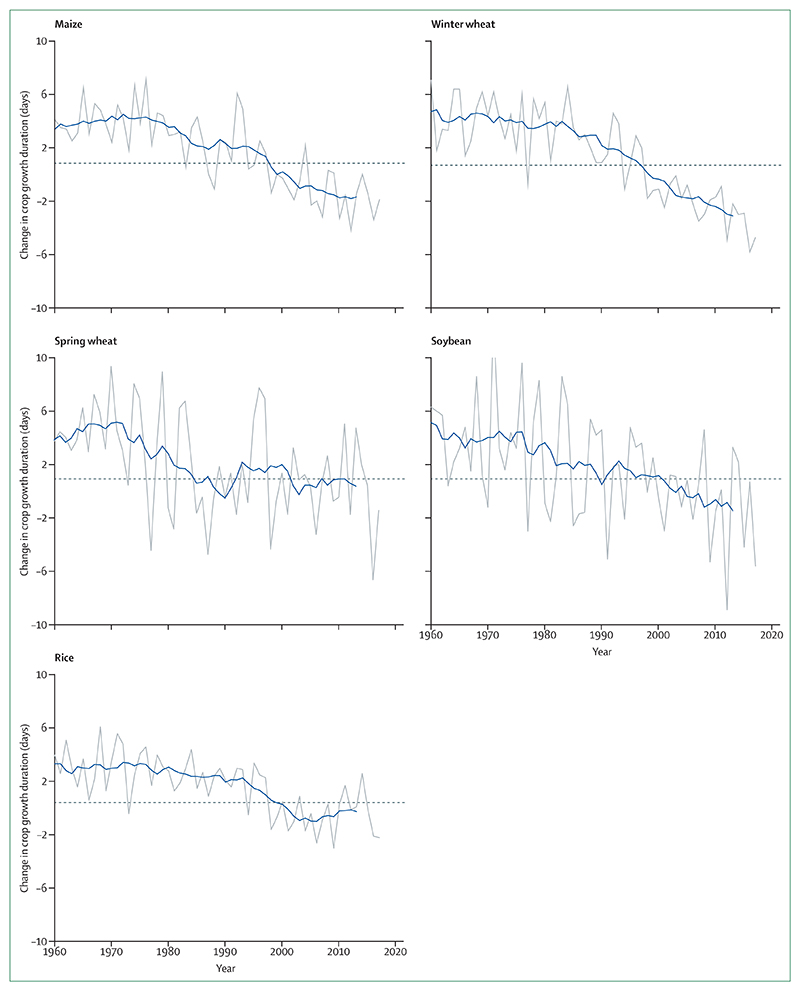
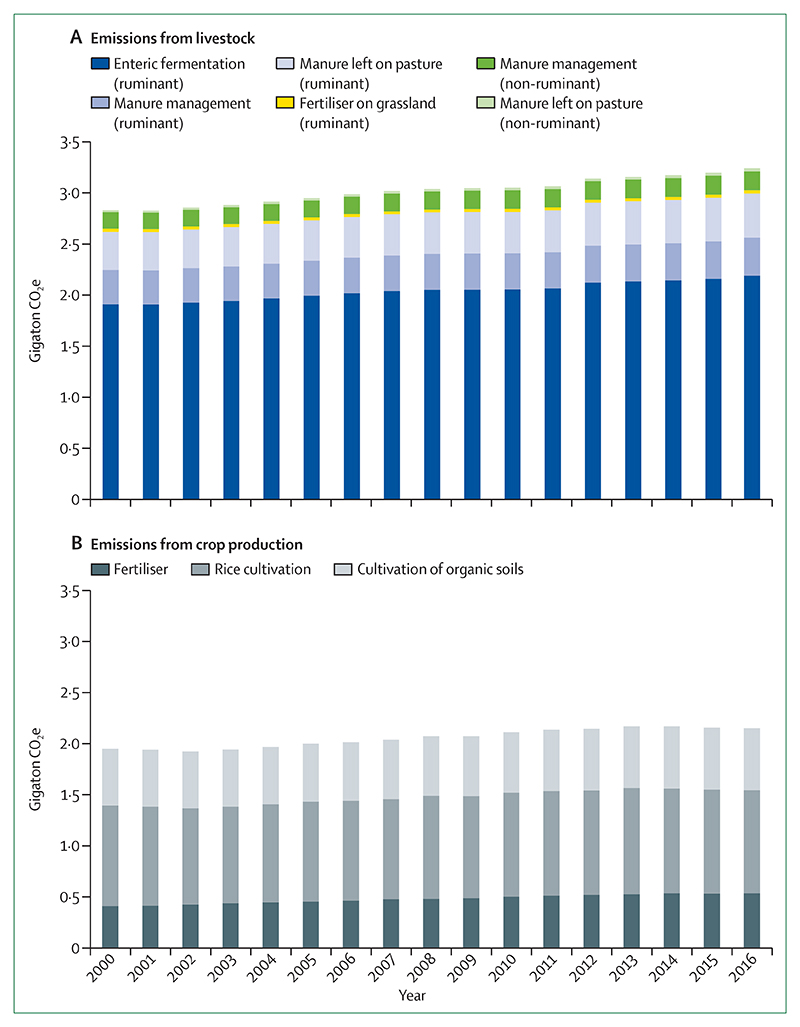
A child born today will experience a world that is more than four degrees warmer than the pre-industrial average, with climate change impacting human health from infancy and adolescence to adulthood and old age. Across the world, children are among the worst affected by climate change. Downward trends in global yield potential for all major crops tracked since 1960 threaten food production and food security, with infants often the worst affected by the potentially permanent effects of undernutrition (indicator 1.5.1). Children are among the most susceptible to diarrhoeal disease and experience the most severe effects of dengue fever. Trends in climate suitability for disease transmission are particularly concerning, with nine of the ten most suitable years for the transmission of dengue fever on record occurring since 2000 (indicator 1.4.1). Similarly, since an early 1980s baseline, the number of days suitable for Vibrio (a pathogen responsible for part of the burden of diarrhoeal disease) has doubled, and global suitability for coastal Vibrio cholerae has increased by 9·9% indicator 1.4.1).
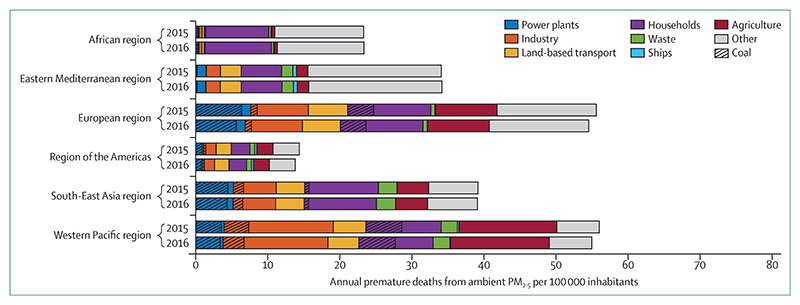
Through adolescence and beyond, air pollution—principally driven by fossil fuels, and exacerbated by climate change—damages the heart, lungs, and every other vital organ. These effects accumulate over time, and into adulthood, with global deaths attributable to ambient fine particulate matter (PM2·5) remaining at 2·9 million in 2016 (indicator 3.3.2) and total global air pollution deaths reaching 7 million.
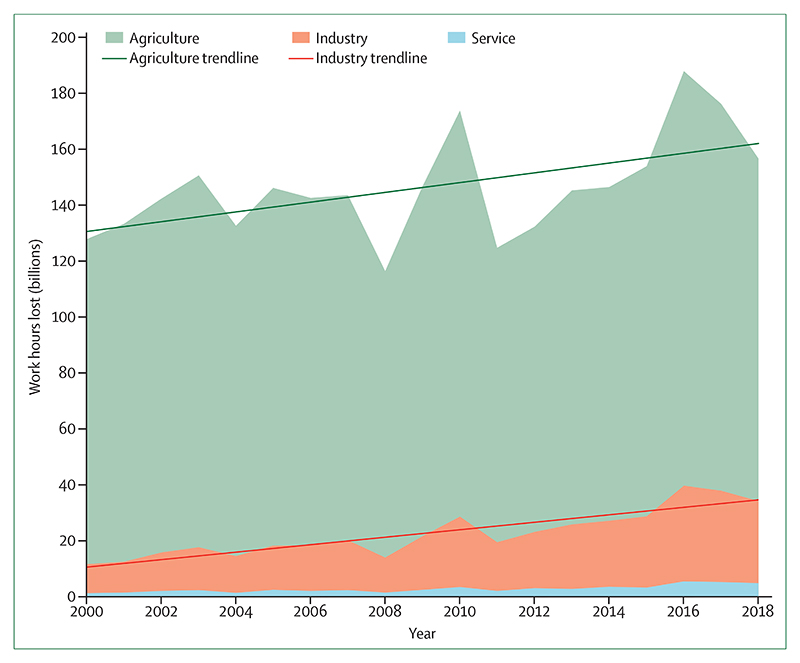
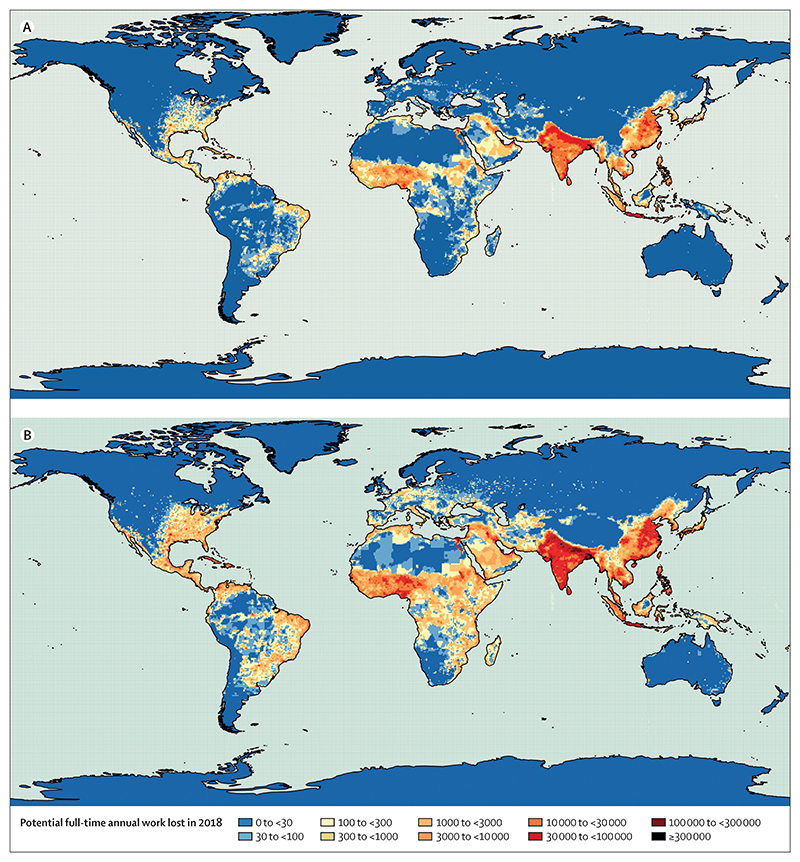
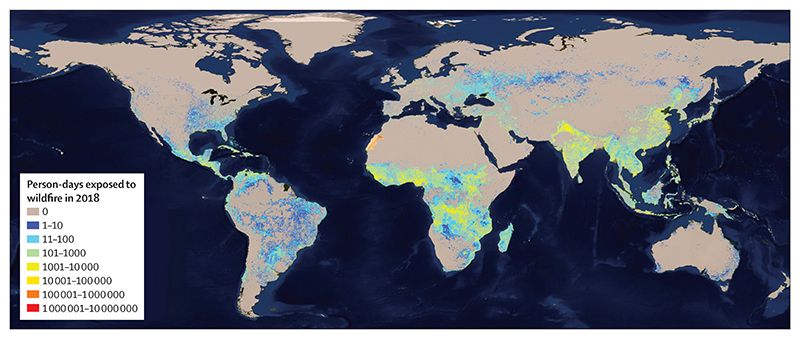
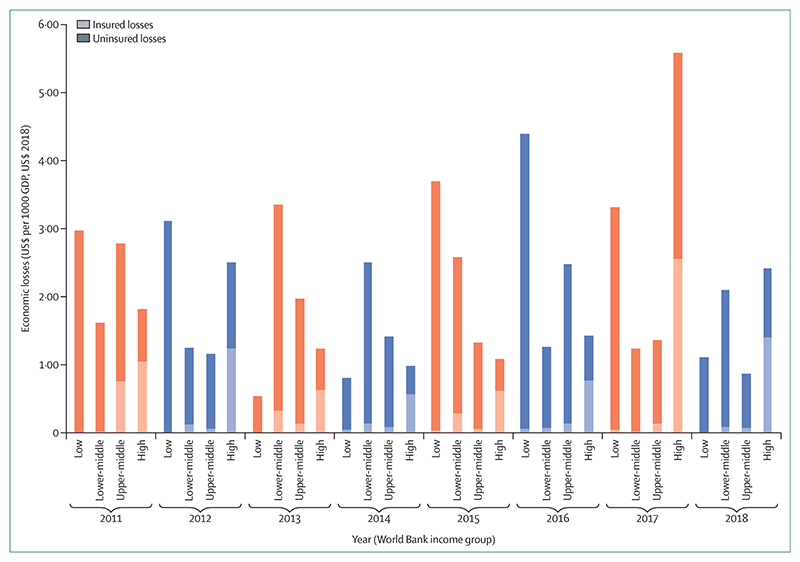
Later in life, families and livelihoods are put at risk from increases in the frequency and severity of extreme weather conditions, with women among the most vulnerable across a range of social and cultural contexts. Globally, 77% of countries experienced an increase in daily population exposure to wildfires from 2001–14 to 2015–18 (indicator 1.2.1). India and China sustained the largest increases, with an increase of over 21 million exposures in India and 17 million exposures in China over this time period. In low-income countries, almost all economic losses from extreme weather events are uninsured, placing a particularly high burden on individuals and households (indicator 4.1). Temperature rise and heatwaves are increasingly limiting the labour capacity of various populations. In 2018, 133·6 billion potential work hours were lost globally, 45 billion more than the 2000 baseline, and southern areas of the USA lost 15–20% of potential daylight work hours during the hottest month of 2018 (indicator 1.1.4).
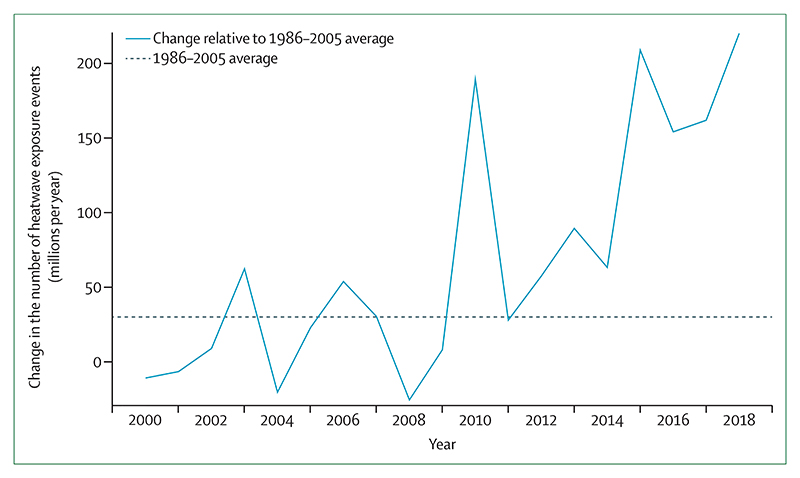
Populations aged 65 years and older are particularly vulnerable to the health effects of climate change, and especially to extremes of heat. From 1990 to 2018, populations in every region have become more vulnerable to heat and heatwaves, with Europe and the Eastern Mediterranean remaining the most vulnerable (indicator 1.1.1). In 2018, these vulnerable populations experienced 220 million heatwave exposures globally, breaking the previous record of 209 million set in 2015 (indicator 1.1.3). Already faced with the challenge of an ageing population, Japan had 32 million heatwave exposures affecting people aged 65 years and older in 2018, the equivalent of almost every person in this age group experiencing a heatwave. Finally, although difficult to quantify, the downstream risks of climate change, such as migration, poverty exacerbation, violent conflict, and mental illness, affect people of all ages and all nationalities.
A business as usual trajectory will result in a fundamentally altered world, with the indicators described providing a glimpse of the implications of this pathway. The life of every child born today will be profoundly affected by climate change. Without accelerated intervention, this new era will come to define the health of people at every stage of their lives.
Responding to climate change for health: The Paris Agreement has set a target of “holding the increase in the global average temperature to well below 2°C above pre-industrial levels and pursuing efforts to limit the temperature increase to 1·5°C.” In a world that matches this ambition, a child born today would see the phase-out of all coal in the UK and Canada by their sixth and 11th birthday; they would see France ban the sale of petrol and diesel cars by their 21st birthday; and they would be 31 years old by the time the world reaches net-zero in 2050, with the UK’s recent commitment to reach this goal one of many to come. The changes seen in this alternate pathway could result in cleaner air, safer cities, and more nutritious food, coupled with renewed investment in health systems and vital infrastructure. This second path—which limits the global average temperature rise to “well below 2°C”—is possible, and would transform the health of a child born today for the better, right the way through their life.
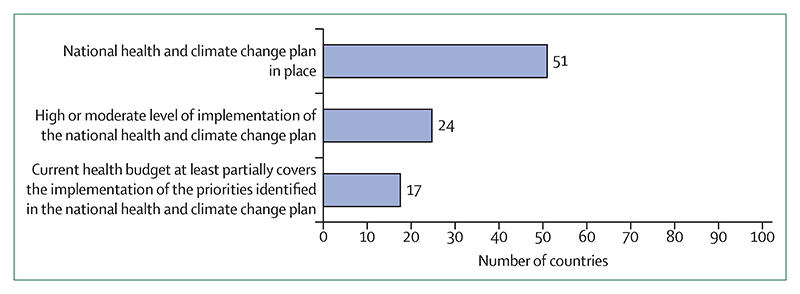
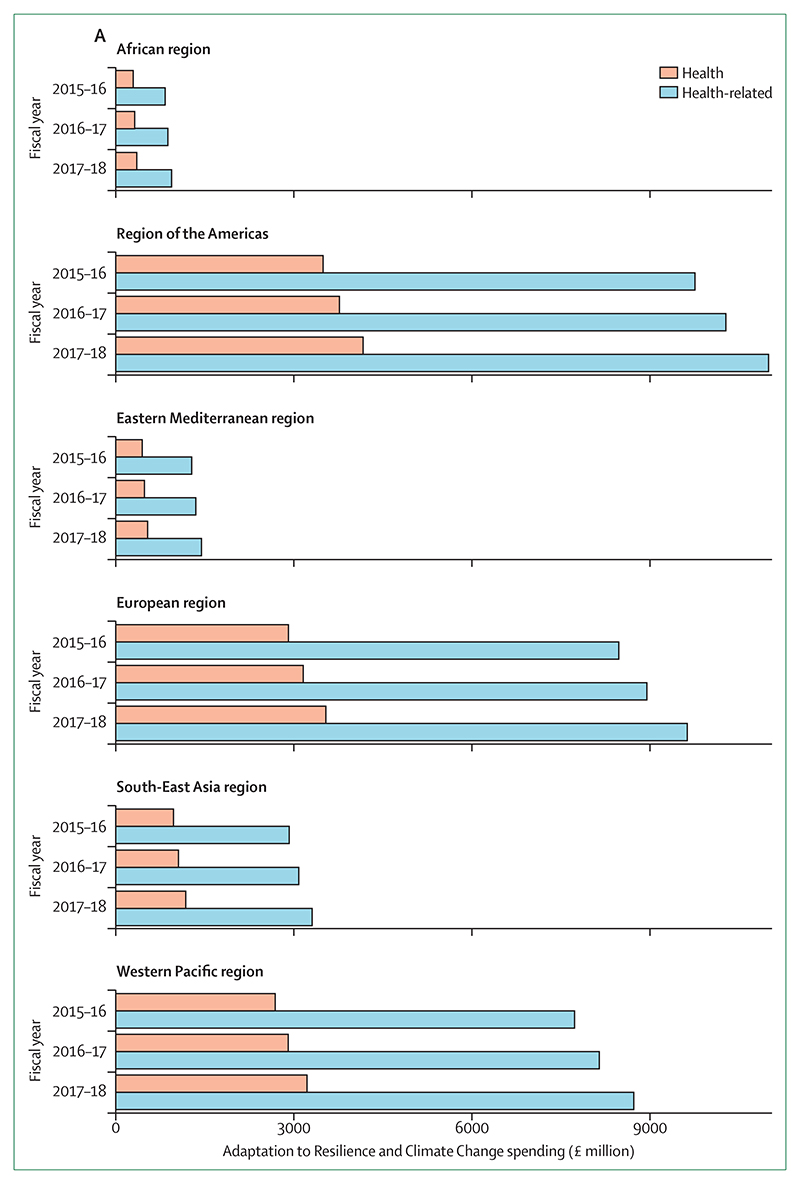
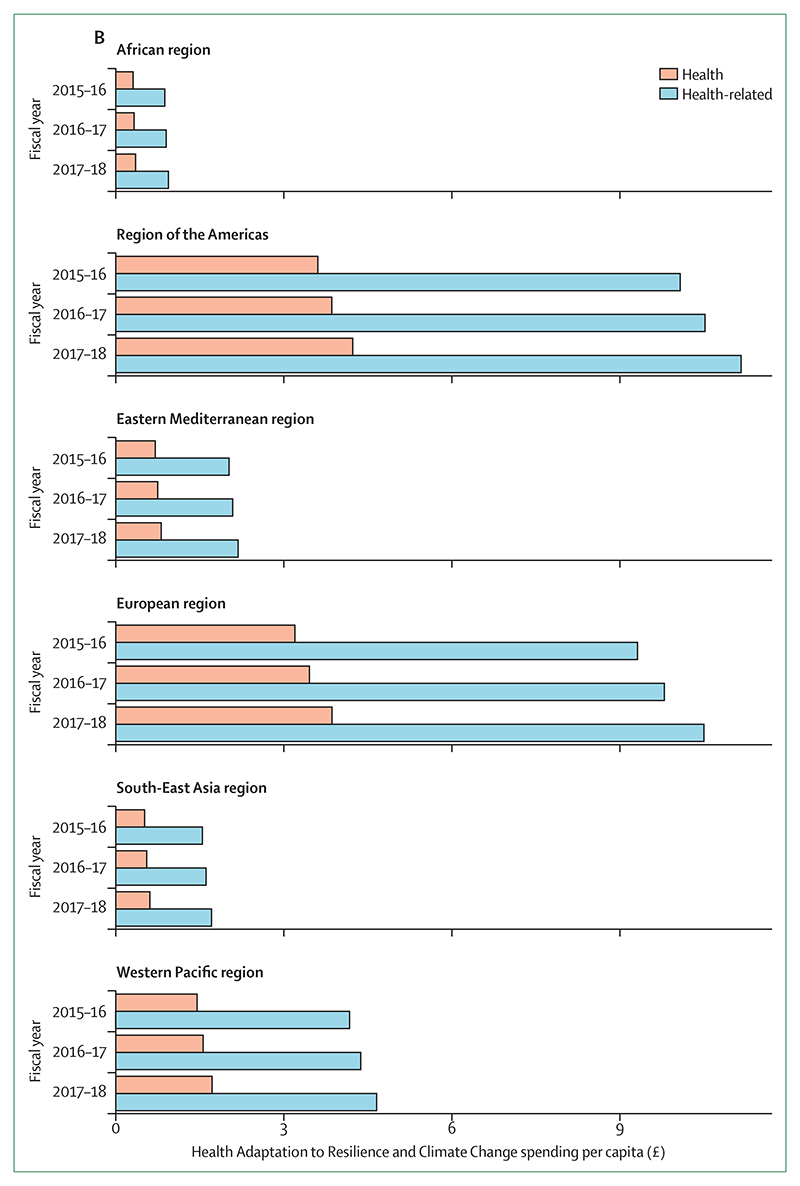
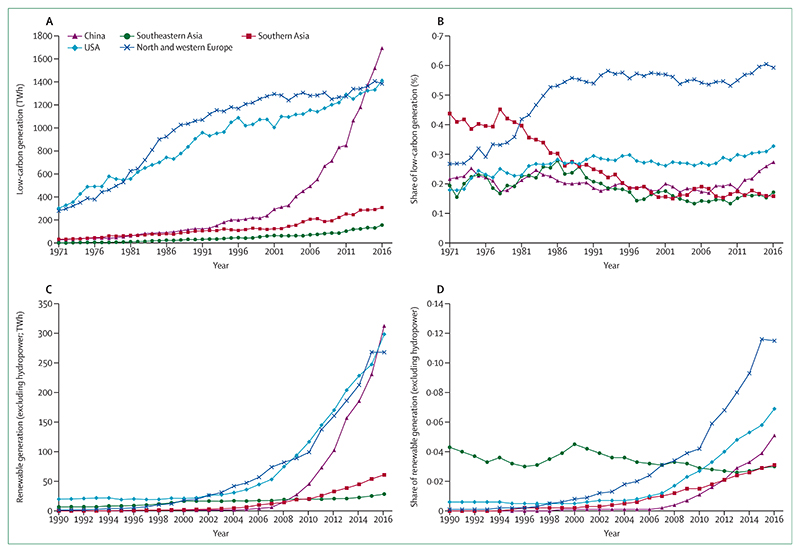
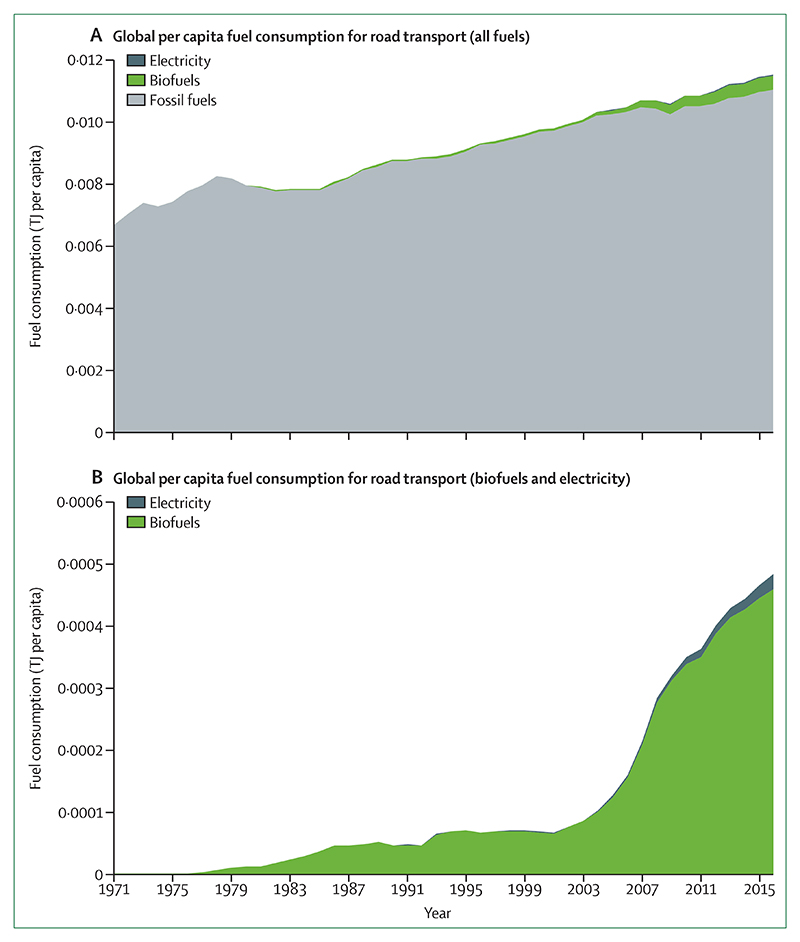
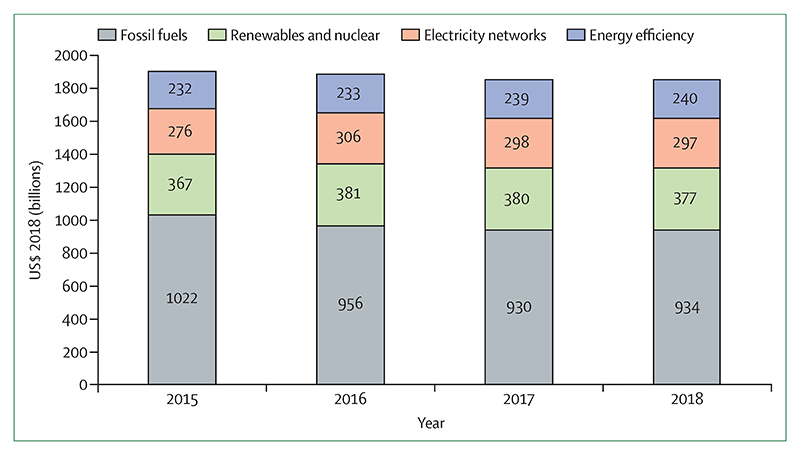
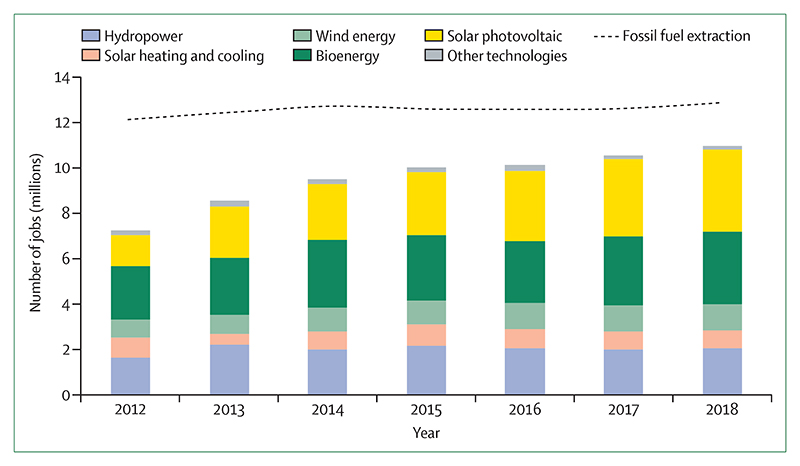
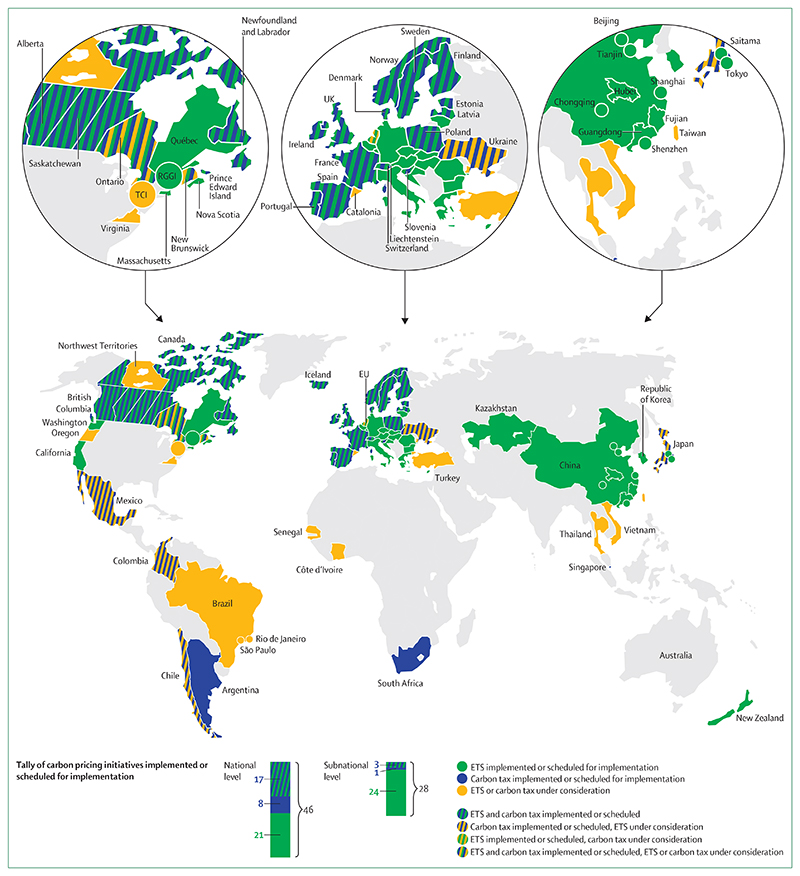
Considering the evidence available in the 2019 indicators, such a transition could be beginning to unfold. Despite a small increase in coal use in 2018, in key countries such as China, it continued to decrease as a share of electricity generation (indicator 3.1.2). Correspondingly, renewables accounted for 45% of global growth in power generation capacity that year, and low-carbon electricity reached a high of 32% of global electricity in 2016 (indicator 3.1.3). Global per capita use of electric vehicles increased by 20·6% between 2015 and 2016, and now represents 1·8% of China’s total transportation fuel use (indicator 3.4). Improvements in air pollution seen in Europe from 2015 to 2016, could result in a reduction of Years of Life Lost (YLL) worth €5·2 billion annually, if this reduction remained constant across a lifetime (indicator 4.2). In several cases, the economic savings from a healthier and more productive workforce, with fewer health-care expenses, will cover the initial investment costs of these interventions. Similarly, cities and health systems are becoming more resilient to the effects of climate change; about 50% of countries and 69% of cities surveyed reported efforts to conduct national health adaptation plans or climate change risk assessments (indicators 2.1.1, 2.1.2, and 2.1.3). These plans are now being implemented, with the number of countries providing climate services to the health sector increasing from 55 in 2018 to 70 in 2019 (indicator 2.2) and 109 countries reporting medium to high implementation of a national health emergency framework (indicator 2.3.1). Growing demand is coupled with a steady increase in health adaptation spending, which represents 5% (£13 billion) of total adaptation funding in 2018 and has increased by 11·8% over the past 12 months (indicator 2.4). This increase is in part funded by growing revenues from carbon pricing mechanisms, with a 30% increase to US$43 billion in funds raised between 2017 and 2018 (indicator 4.4.3).
However, current progress is inadequate, and despite the beginnings of the transition described, the indicators published in the Lancet Countdown’s 2019 report are suggestive of a world struggling to cope with warming that is occurring faster than governments are able, or willing to respond. Opportunities are being missed, with the Green Climate Fund yet to receive projects specifically focused on improving climate-related public health, despite the fact that in other forums, leaders of small island developing states are recognising the links between health and climate change (indicator 5.3). In response, the generation that will be most affected by climate change has led a wave of school strikes across the world.
Bold new approaches to policy making, research, and business are needed in order to change course. An unprecedented challenge demands an unprecedented response, and it will take the work of the 7·5 billion people currently alive to ensure that the health of a child born today is not defined by a changing climate.
Conflict of interest statement
The
Figures
Comment in
-
Health and climate change: making the link matter.Lancet. 2019 Nov 16;394(10211):1780. doi: 10.1016/S0140-6736(19)32756-4. Lancet. 2019. PMID: 31733927 No abstract available.
-
The health-care sector's role in climate stabilisation.Lancet. 2020 Jul 11;396(10244):91-92. doi: 10.1016/S0140-6736(20)30808-4. Lancet. 2020. PMID: 32653061 No abstract available.
-
The health-care sector's role in climate stabilisation.Lancet. 2020 Jul 11;396(10244):92. doi: 10.1016/S0140-6736(20)30809-6. Lancet. 2020. PMID: 32653062 No abstract available.
References
-
- IPCC. Global warming of 1·5°C An IPCC Special Report on the impacts of global warming of 1·5°C above pre-industrial levels and related global greenhouse gas emission pathways, in the context of strengthening the global response to the threat of climate change. Geneva, Switzerland: World Meteorological Organization; 2018.
-
- NASA, NOAA. 2018 fourth warmest year in continued warming trend, according to NASA, NOAA. 2019. [accessed Sept 23, 2019]. https://climate.nasa.gov/news/2841/2018-fourth-warmestyear-in-continued-...
-
- Cooper A, Johnson C. Now near 100 million bpd, when will oil demand peak? 2018. [accessed Sept 23, 2019]. https://www.reuters.com/article/us-oil-demand-peak/now-near-100-millionb... .
-
- IEA. Market Report Series: gas 2017. Paris, France: International Energy Agency; 2018.
Publication types
MeSH terms
Grants and funding
LinkOut - more resources
Full Text Sources
Other Literature Sources
Medical
Miscellaneous
