. 2019 Dec 6:18:801-814.
doi: 10.1016/j.omtn.2019.08.028. Epub 2019 Oct 3.

NLRP3 Inflammasome Activation by MicroRNA-495 Promoter Methylation May Contribute to the Progression of Acute Lung Injury

Affiliations

NLRP3 Inflammasome Activation by MicroRNA-495 Promoter Methylation May Contribute to the Progression of Acute Lung Injury

Youguo Ying et al. Mol Ther Nucleic Acids. .

Abstract

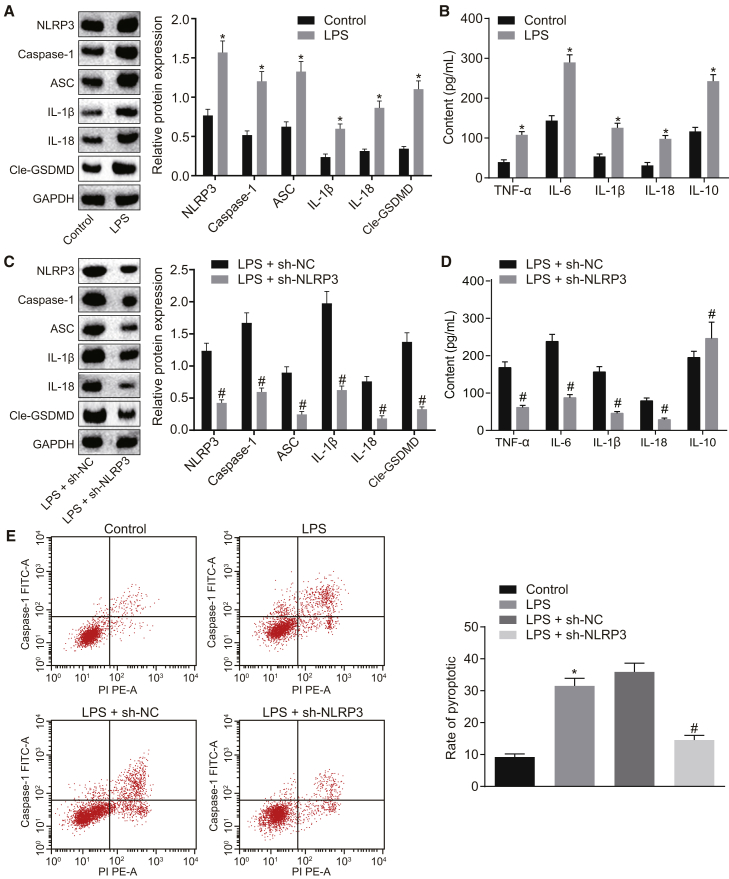
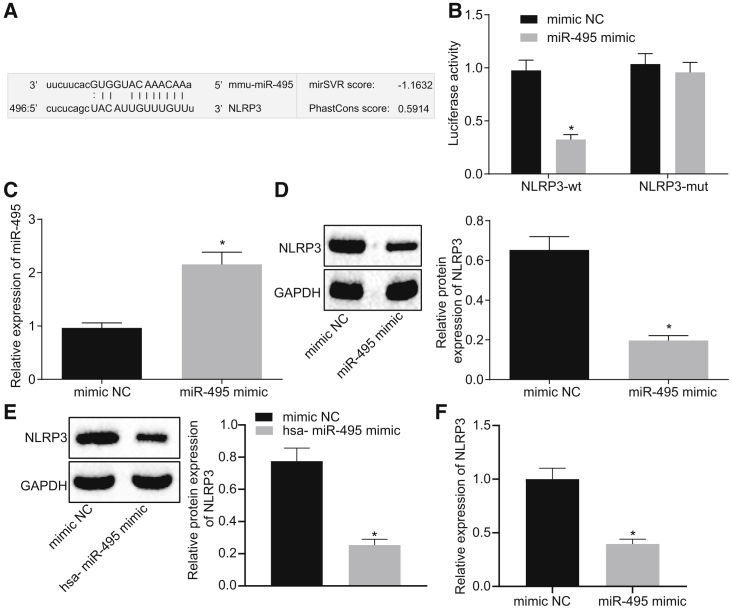
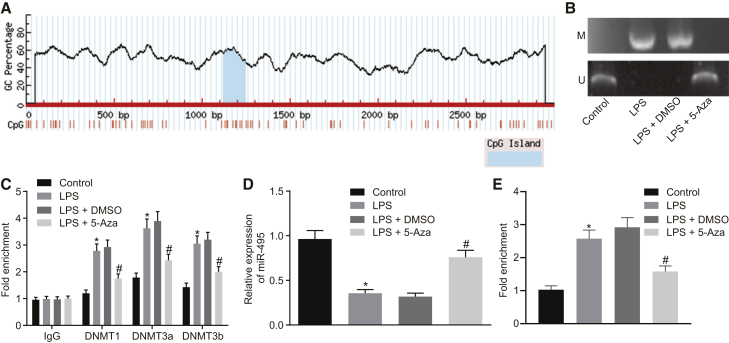
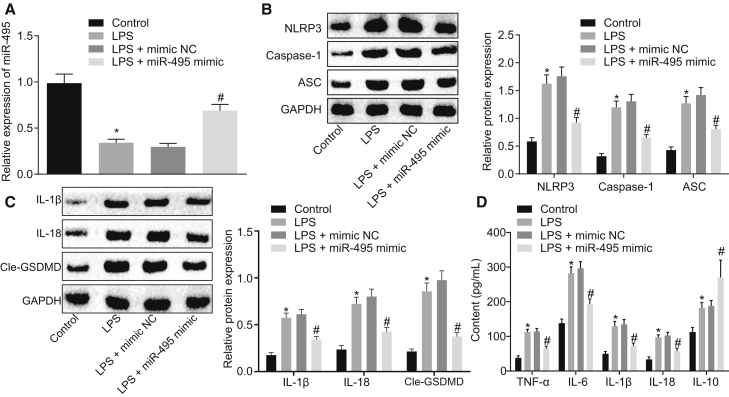
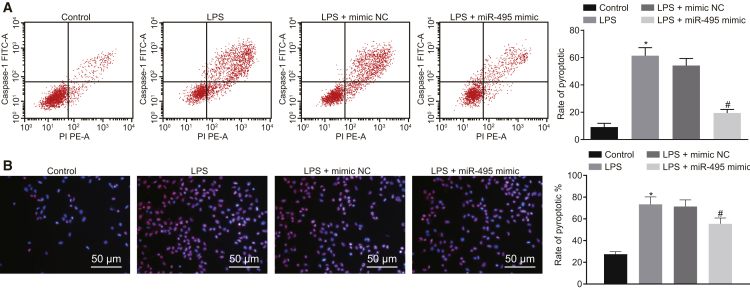
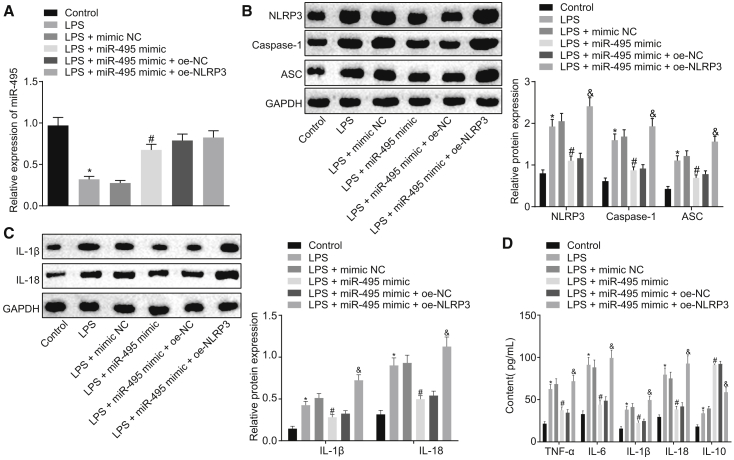
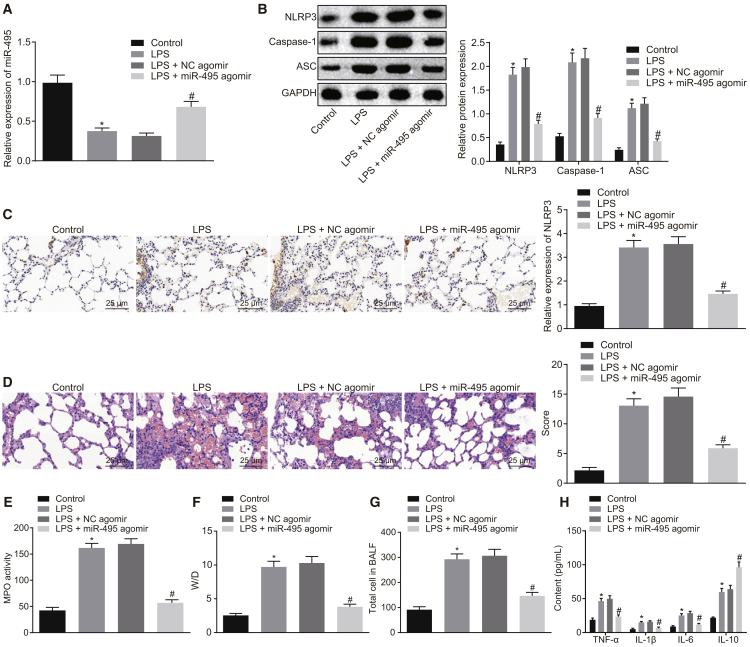
Acute lung injury (ALI) is a pulmonary disorder that causes acute respiratory failure, thus leading to relative high mortality worldwide. However, the molecular mechanisms of ALI remain largely unknown. MicroRNA (miRNA)-dependent control of gene expression at a post-transcriptional level has been recently reported. Herein, we identify a candidate miRNA, miR-495, that affects the progression of ALI. Alveolar macrophages (NR8383) were treated with 1 μg/mL lipopolysaccharide (LPS) to establish a cell-injury model. Combined with the data from western blot, methylation-specific PCR, methylated DNA immunoprecipitation, and chromatin immunoprecipitation assays, NLRP3 inflammasome activation and methylation-dependent repression of miR-495 were found in LPS-exposed NR8383 cells. Dual-luciferase reporter gene assay and miR-495 gain-of-function experiments confirmed that NLRP3 was a target of miR-495. Next, the expression of miR-495 and NLRP3 was overexpressed or silenced to assess their effects on NLRP3 inflammasome activation, alveolar macrophage inflammation, and pyroptosis in vitro. As demonstrated, overexpressed miR-495 alleviated alveolar macrophage inflammation and pyroptosis and inhibited NLRP3 inflammasome activation by negatively regulating the NLRP3 gene. Consistently, elevated miR-495 alleviated lung injury and reduced the neutrophil infiltration and inflammation in rat models of LPS-induced ALI. Taken together, the data in our study demonstrated that methylation of the miR-495 promoter could downregulate miR-495, whose elevation could attenuate the activation of the NLRP3 inflammasome to protect against ALI, which provides novel therapeutic targets for ALI treatment.

Keywords: NOD-like receptor family pyrin domain containing 3; acute lung injury; inflammasome; methylation; microRNA-495.


Figures

Figure 1
Figure 1
LPS-Induced ALI Exhibits Activated NLRP3 Inflammasome and Inflammation of Alveolar Macrophages in LPS-Induced ALI Is Inhibited with the Silencing of NLRP3 (A) Protein expression levels of NLRP3, caspase-1, ASC, IL-1β, IL-18, and Cle-GSDMD in NR8383 cells treated with F-12K culture medium or LPS as detected by western blot analysis. (B) Expression levels of proinflammatory factors (TNF-α, IL-6, IL-1β, and IL-18) and anti-inflammatory factor IL-10 in NR8383 cells treated with F-12K culture medium or LPS as detected by ELISA. (C) Protein expression levels of NLRP3, caspase-1, ASC, IL-1β, IL-18, and Cle-GSDMD in LPS-exposed NR8383 cells following transfection with sh-NLRP3 or sh-NC as measured by western blot analysis. (D) Expression levels of proinflammatory factors (TNF-α, IL-6, IL-1β, and IL-18) and anti-inflammatory factor IL-10 in LPS-exposed NR8383 cells following transfection with sh-NLRP3 or sh-NC as measured by ELISA. (E) Pyroptosis of LPS-exposed NR8383 cells following transfection with sh-NLRP3 or sh-NC, as determined by PI/Hoechst 33342 double staining. *p < 0.05 versus NR8383 cells treated with F-12K culture medium; #p < 0.05 versus LPS-exposed NR8383 cells transfected with sh-NC. An unpaired t test was used to analyze data expressed as mean ± SD between two groups if the data conformed to normal distribution and homogeneity of variance. Data among multiple groups were compared using one-way ANOVA followed by Tukey’s post hoc test. The experiment was repeated three times.
Figure 2
Figure 2
miR-495 Directly Targets NLRP3 (A) Binding site between miR-495 and NLRP3 3′ UTR predicted using the bioinformatic website microRNA.org. (B) Luciferase activity of NLRP3-WT and NLRP3-Mut following the co-transfection of miR-495 mimic or mimic NC detected by dual-luciferase reporter gene assay. (C) Expression of miR-495 in response to transfection with miR-495 mimic or mimic NC as measured by qRT-PCR. (D) Expression of NLRP3 in response to transfection with miR-495 mimic or mimic NC as measured by western blot analysis. (E) Protein expression of NLRP3 in response to transfection with hsa-miR-495 mimic or mimic NC as measured by western blot analysis. (F) Expression of NLRP3 in response to transfection with hsa-miR-495 mimic or mimic NC determined by qRT-PCR. *p < 0.05 versus NR8383 cells treated with mimic NC. Measurement data were expressed as mean ± SD. An unpaired t test was used to analyze data expressed as mean ± SD between two groups if the data conformed to normal distribution and homogeneity of variance. The experiment was repeated three times to obtain the mean value.
Figure 3
Figure 3
Expression of miR-495 Is Reduced in LPS-Exposed NR8383 Cells due to the Methylation of miR-495 Promoter (A) CpG island in the miR-495 gene promoter region predicted using the MethPrimer website. (B) Methylation of the miR-495 promoter in NR8383 cells treated with F-12K culture medium, LPS, combined LPS and DMSO, or combined LPS and 5-Aza as measured by MSP assay. (C) Enrichment of DNMT1 and DNMT3a/b in the miR-495 promoter region in NR8383 cells treated with F-12K culture medium, LPS, combined LPS and DMSO, or combined LPS and 5-Aza as measured by ChIP assay. (D) Expression of miR-495 in NR8383 cells treated with F-12K culture medium, LPS, combined LPS and DMSO, or combined LPS and 5-Aza as determined by qRT-PCR. (E) Methylation of miR-495 promoter in NR8383 cells treated with F-12K culture medium, LPS, combined LPS and DMSO, or combined LPS and 5-Aza detected by MeDIP assay. *p < 0.05 versus NR8383 cells treated with F-12K culture medium; #p < 0.05 versus NR8383 cells treated with LPS and DMSO. Measurement data were expressed as mean ± SD, and data among multiple groups were compared using one-way ANOVA and subjected to Tukey’s post hoc test. The experiment was repeated three times to obtain the mean value.
Figure 4
Figure 4
Activation of NLRP3 Inflammasome Triggered LPS Is Attenuated by Elevation of miR-495 (A) Expression of miR-495 in NR8383 cells treated with LPS, F-12K culture medium, combined LPS and mimic NC, or combined LPS and miR-495 mimic as detected by qRT-PCR. (B) Expression levels of NLRP3, ASC, and caspase-1 in NR8383 cells treated with LPS, F-12K culture medium, combined LPS and mimic NC, or combined LPS and miR-495 mimic as detected by western blot analysis. (C) Expression levels of IL-1β, IL-18, and Cle-GSDMD in NR8383 cells treated with LPS, F-12K culture medium, combined LPS and mimic NC, or combined LPS and miR-495 mimic as detected by western blot analysis. (D) Expression levels of proinflammatory factors (TNF-α, IL-6, IL-1β, and IL-18) and anti-inflammatory factor IL-10 in NR8383 cells treated with LPS, F-12K culture medium, combined LPS and mimic NC, or combined LPS and miR-495 mimic as detected by ELISA. *p < 0.05 versus NR8383 cells treated with F-12K culture medium; #p < 0.05 versus NR8383 cells treated with both LPS and mimic NC. Measurement data were expressed as mean ± SD, and data among multiple groups were compared using one-way ANOVA and subjected to Tukey’s post hoc test. The experiment was repeated three times to obtain the mean value.
Figure 5
Figure 5
Pyroptosis of Alveolar Macrophages Triggered by LPS Is Attenuated with the Elevation of miR-495 (A) Pyroptosis of LPS-exposed NR8383 cells determined by flow cytometry. (B) Pyroptosis of LPS-exposed NR8383 cells determined by PI/Hoechst 33342 double staining (200×). *p < 0.05, versus NR8383 cells treated with F-12K culture medium; #p < 0.05, versus LPS-exposed NR8383 cells transfected with mimic NC. Measurement data were expressed as mean ± SD, and data among multiple groups were compared using one-way ANOVA and subjected to Tukey’s post hoc test. The experiment was repeated three times to obtain the mean value.
Figure 6
Figure 6
Elevated Expression of miR-495 Depletes the Expression of NLRP3, Thus Hindering the LPS-Induced Inflammation In Vitro (A) Expression of miR-495 in LPS-exposed NR8383 cells in response to transfection with plasmids including mimic NC, miR-495 mimic, oe-NC, and oe-NLRP3, as determined by qRT-PCR. (B) Expression levels of NLRP3, ASC, and caspase-1 in NR8383 cells in response to transfection with plasmids including mimic NC, miR-495 mimic, oe-NC, and oe-NLRP3, as determined by western blot analysis. (C) Expression levels of L-1β and IL-18 in NR8383 cells in response to transfection with plasmids including mimic NC, miR-495 mimic, oe-NC, and oe-NLRP3, as determined by western blot analysis. (D) Expression levels of proinflammatory factors (TNF-α, IL-6, IL-1β, and IL-18) and anti-inflammatory factor IL-10 in NR8383 cells in response to transfection with plasmids including mimic NC, miR-495 mimic, oe-NC, and oe-NLRP3, as determined by ELISA. *p < 0.05 versus NR8383 cells treated with F-12K culture medium; #p < 0.05, versus LPS-exposed NR8383 cells transfected with mimic NC; &p < 0.05 versus LPS-exposed NR8383 cells co-transfected with miR-495 mimic and oe-NC. Measurement data were expressed as mean ± SD, and data among multiple groups were compared using one-way ANOVA and subjected to Tukey’s post hoc test. The experiment was repeated three times to obtain the mean value.
Figure 7
Figure 7
Elevated Expression of miR-495 Depletes the Expression of NLRP3, Thus Protecting against ALI In Vivo Rats were treated with normal saline or LPS, and LPS-treated rats were further introduced with NC agomir or miR-495 agomir. (A) Expression of miR-495 in lung tissues of rats as determined by qRT-PCR. (B) Expression levels of NLRP3, ASC, and caspase-1 in lung tissues of rats measured using western blot analysis. (C) Immunohistochemistry detection of NLRP3 contents in rat lung tissues (400×). (D) Pathological changes of lung tissues in rats observed using H&E staining (400×). (E) MPO activity in lung tissues of rats. (F) Detection of lung W/D ratio in rats. (G) Total protein content in BALF in rats. (H) Levels of proinflammatory factors (TNF-α, IL-6, and IL-1β) and anti-inflammatory factor IL-10 in the BALF of rats detected by ELISA. *p < 0.05 versus rats treated with normal saline; #p < 0.05 versus rats treated with LPS and NC agomir. Measurement data were expressed as mean ± SD, and data among multiple groups were compared using one-way ANOVA and subjected to Tukey’s post hoc test. The experiment was repeated three times to obtain the mean value.

References

    1. Lemos-Filho L.B., Mikkelsen M.E., Martin G.S., Dabbagh O., Adesanya A., Gentile N., Esper A., Gajic O., Gong M.N., US Critical Illness and Injury Trials Group: Lung Injury Prevention Study Investigators (USCIITG-LIPS) Sex, race, and the development of acute lung injury. Chest. 2013;143:901–909. - PMC - PubMed
    1. Fang X., Bai C., Wang X. Bioinformatics insights into acute lung injury/acute respiratory distress syndrome. Clin. Transl. Med. 2012;1:9. - PMC - PubMed
    1. Dushianthan A., Grocott M.P., Postle A.D., Cusack R. Acute respiratory distress syndrome and acute lung injury. Postgrad. Med. J. 2011;87:612–622. - PubMed
    1. Czyzewski A.M., McCaig L.M., Dohm M.T., Broering L.A., Yao L.J., Brown N.J., Didwania M.K., Lin J.S., Lewis J.F., Veldhuizen R., Barron A.E. Effective in vivo treatment of acute lung injury with helical, amphipathic peptoid mimics of pulmonary surfactant proteins. Sci. Rep. 2018;8:6795. - PMC - PubMed
    1. Butt Y., Kurdowska A., Allen T.C. Acute lung injury: a clinical and molecular review. Arch. Pathol. Lab. Med. 2016;140:345–350. - PubMed