. 2019 Nov 18;18(1):163.
doi: 10.1186/s12943-019-1082-3.

YTHDF2 reduction fuels inflammation and vascular abnormalization in hepatocellular carcinoma

Affiliations

YTHDF2 reduction fuels inflammation and vascular abnormalization in hepatocellular carcinoma

Jiajie Hou et al. Mol Cancer. .

Erratum in

Abstract

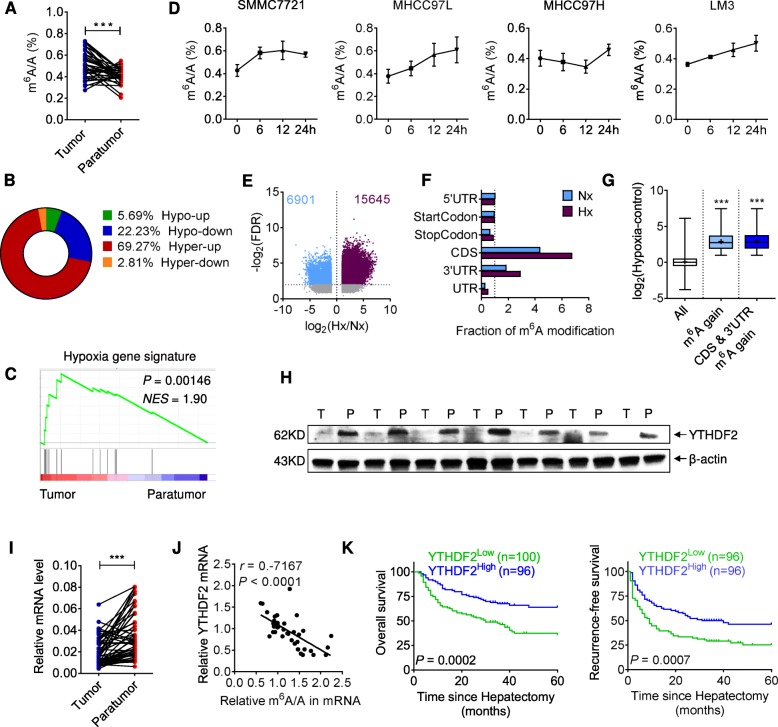
Background: Dynamic N6-methyladenosine (m6A) modification was previously identified as a ubiquitous post-transcriptional regulation that affected mRNA homeostasis. However, the m6A-related epitranscriptomic alterations and functions remain elusive in human cancer. Here we aim to identify the profile and outcome of m6A-methylation in hepatocellular carcinoma (HCC).

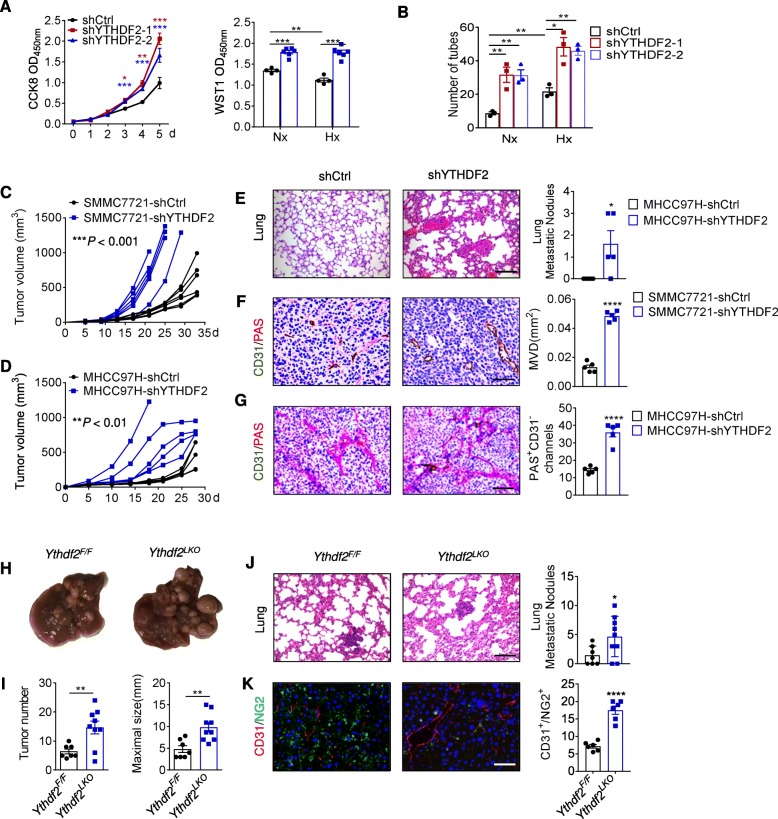
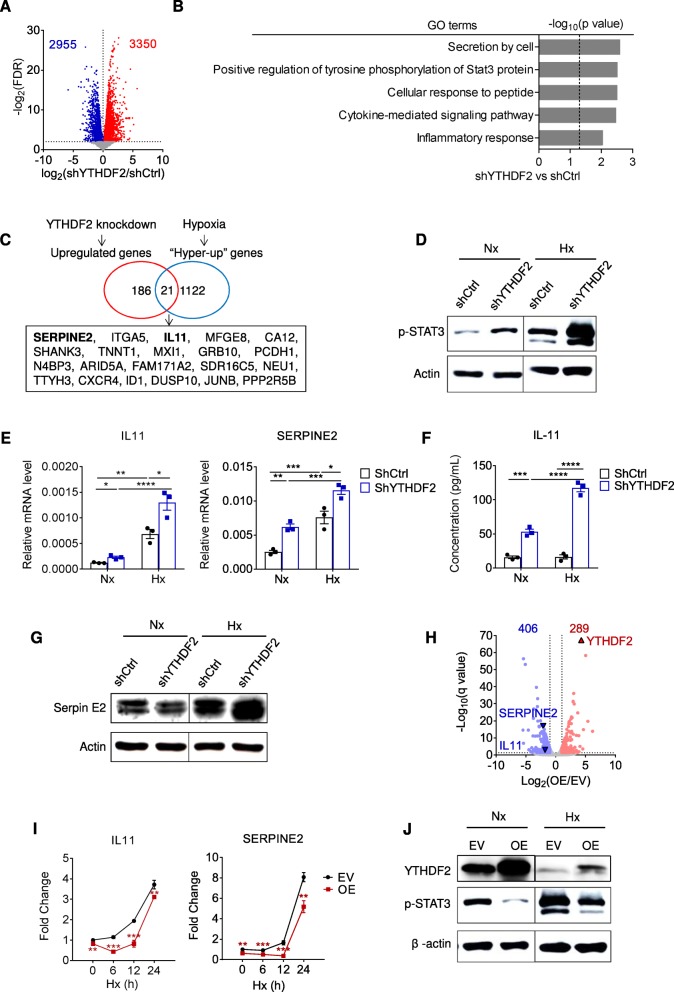
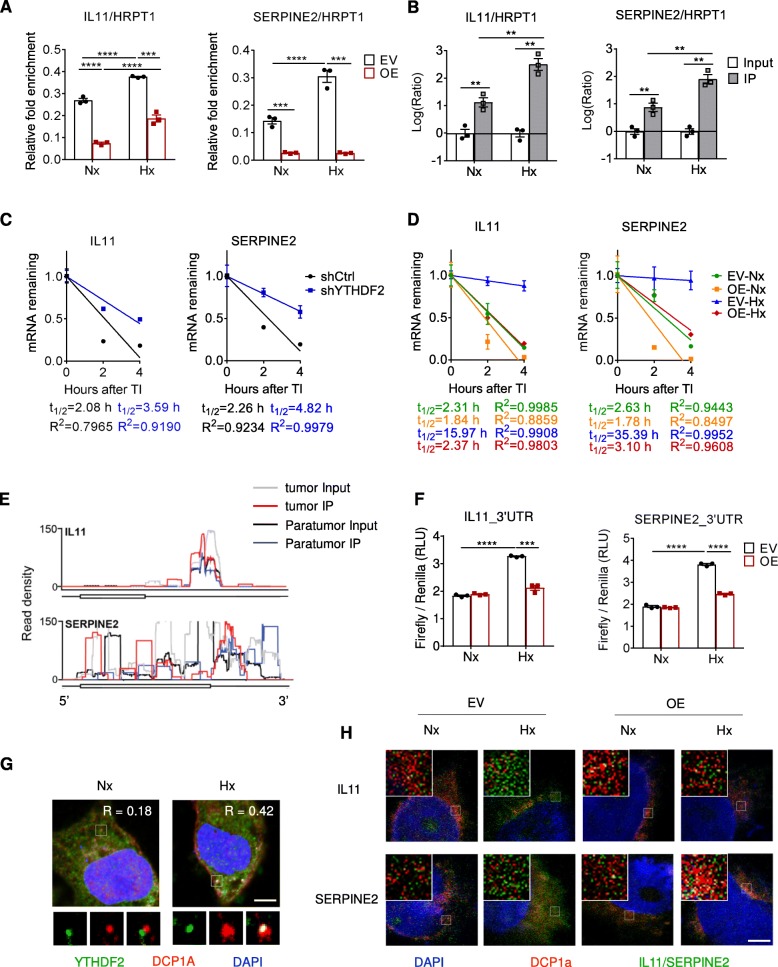
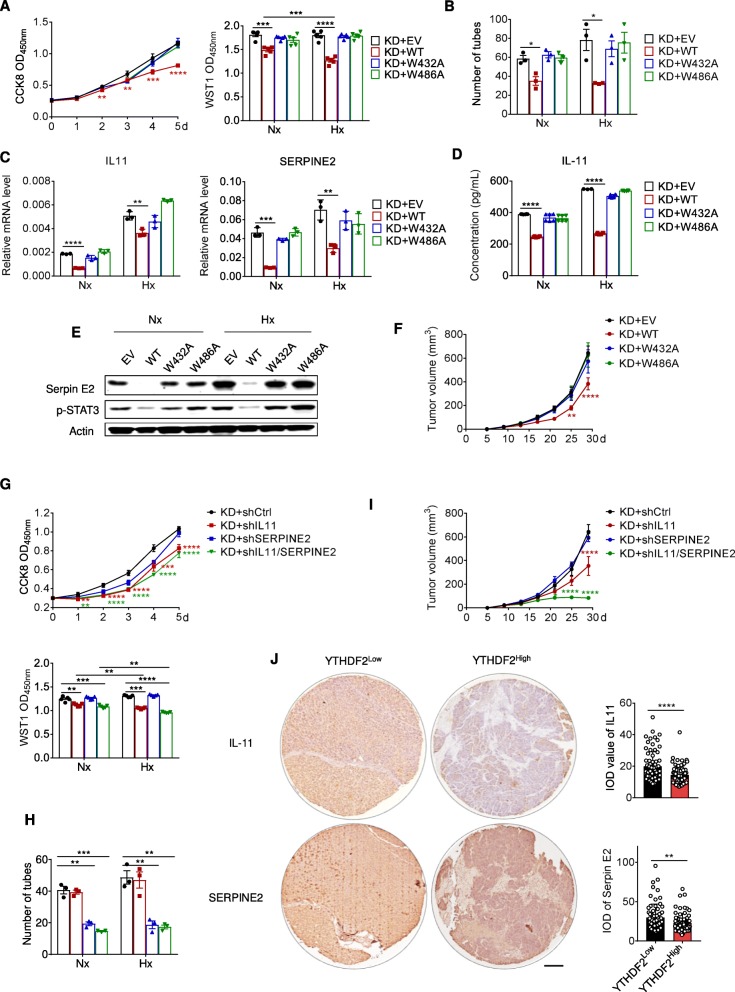
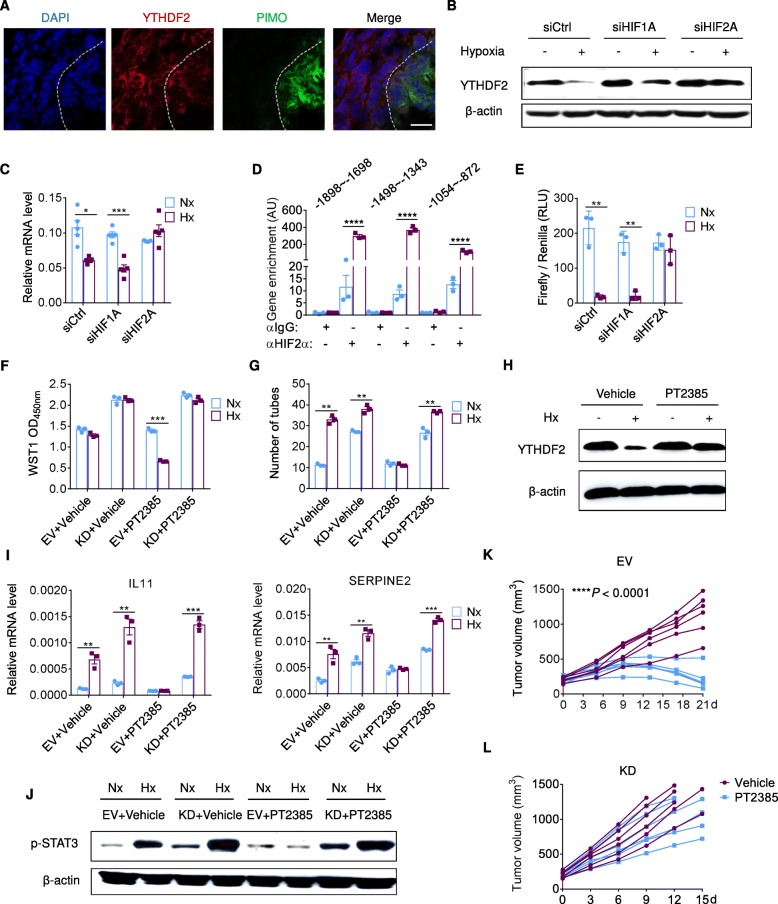
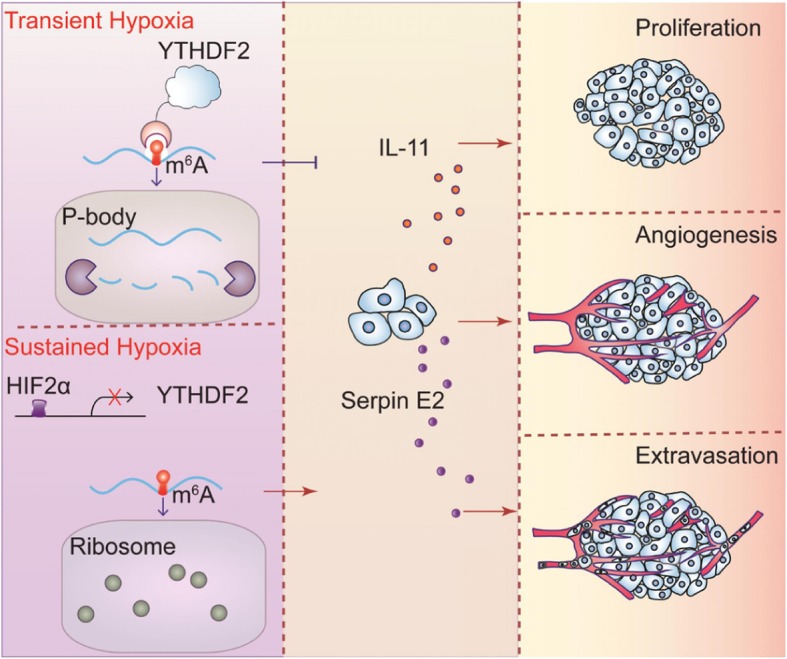
Results: Using liquid chromatography-tandem mass spectrometry and m6A-immunoprecipitation in combination with high-throughput sequencing, we determined the m6A-mRNA levels in human HCC. Human HCC exhibited a characteristic gain of m6A modification in tandem with an increase of mRNA expression, owing to YTH domain family 2 (YTHDF2) reduction. The latter predicted poor classification and prognosis of HCC patients, and highly correlated with HCC m6A landscape. YTHDF2 silenced in human HCC cells or ablated in mouse hepatocytes provoked inflammation, vascular reconstruction and metastatic progression. Mechanistically, YTHDF2 processed the decay of m6A-containing interleukin 11 (IL11) and serpin family E member 2 (SERPINE2) mRNAs, which were responsible for the inflammation-mediated malignancy and disruption of vascular normalization. Reciprocally, YTHDF2 transcription succumbed to hypoxia-inducible factor-2α (HIF-2α). Administration of a HIF-2α antagonist (PT2385) restored YTHDF2-programed epigenetic machinery and repressed liver cancer.

Conclusion: Our results have characterized the m6A-mRNA landscape in human HCC and revealed YTHDF2 as a molecular 'rheostat' in epitranscriptome and cancer progression.

Keywords: HCC; HIF-2α antagonism; IL-11; Inflammation; Serpin E2; Vessel normalization; YTHDF2; m6A.


Conflict of interest statement

The authors declare no conflict of interest.

Figures

Fig. 1
Fig. 1
Hyper-upregulation of m6A-mRNAs and downregulation of YTHDF2 in human HCC. (a) m6A levels in paired tumor and paratumor mRNA, as assessed using LC-MS/MS. n = 37 patients. (b) Percentages of altered m6A-mRNAs (classified as hypo-up, hypo-down, hyper-up and hyper-down) in tumor compared to paratumor, as determined by MeRIP-Seq. n = 8 patients. (c) Gene-set enrichment analysis of hypoxia-signature gene expression in paired tumor versus paratumor mRNA, as determined by RNA-seq. n = 8 patients. NES, normalized enrichment score. (d) m6A levels in mRNAs of human HCC cell lines grown for 0, 6, 12 or 24 h under hypoxia, as assessed using LC-MS/MS. n = 2 independent experiments. (e) Changes in m6A peaks of SMMC7721 cells upon 24 h of hypoxia (Hx) versus normoxia (Nx), as detected using MeRIP-Seq. Peaks gaining (violet) or losing (light blue) m6A are highlighted at P < 0.05 and 5% FDR adjustment. (f) Fraction of m6A peaks in diverse transcript segments, under either hypoxic or normoxic condition. (g) Expression changes of mRNAs in hypermethylated peaks. (h) Immunoblot of YTHDF2 in paired tumor (T) and paratumor (P) tissues. n = 7 patients. (i) YTHDF2 mRNA levels in paired tumor and paratumor tissues, as assessed by RT-qPCR. n = 51 patients. (j) Scatter plots showing the correlation between m6A level and YTHDF2 expression. The linear best fit line, Pearson correlation coefficient (r) and P-value (P) are shown. n = 37 patients. (k) Kaplan-Meier analyses of the correlation between YTHDF2 expression level and overall survival (left) or recurrence-free survival (right) in HCC patients. n = 200 patients in total. Error bars indicate means ± SEM *P < 0.05, **P < 0.01, ***P < 0.001, **** P < 0.0001. P-values were determined by two tailed t-test
Fig. 2
Fig. 2
YTHDF2 deficiency promotes tumor growth, vasculature remodeling and metastasis. (a) Proliferative activity of SMMC7721-shCtrl and SMMC7721-shYTHDF2 cells grown for 5 d as assessed by CCK8 (left), or grown for additional 24 h of normoxia (Nx) or hypoxia (Hx) and assessed by WST1 assay (right). n = 4–6 biological replicates. (b) Numbers of endothelial tubes formed by HUVEC cocultured with indicated SMMC7721 cells under Nx or Hx for 24 h. n = 3 biological replicates. (c, d) Indicated SMMC7721 (c) or MHCC97H (d) cells were injected subcutaneously into NPG mice and tumor volumes were measured at indicated dates. n = 5–6 mice. (e) H&E staining of lung tissues, showing metastasis nodules originated from MHCC97H cells. n = 5 mice. Scale bar, 100 μm. (f) Microvessel density (MVD) in SMMC7721-derived tumors, as assessed by CD31 staining and quantification of microvessel areas. n = 5 mice. Scale bar, 100 μm. (g) Vascular mimicry in MHCC97H-derived tumors, as quantified by numbers of PAS+CD31 channels lined by tumor cells. n = 5 mice. Scale bar, 100 μm. (h-j) Macropscopic appearances (h), tumor numbers (i) and maximum tumor sizes of livers from 8.5-month old Ythdf2F/F and Ythdf2LKO mice injected with DEN and CCL4. n = 7–9 mice. (j) H&E staining of metastasis nodules in Ythdf2F/F and Ythdf2LKO mouse lungs. n = 7–9 mice. Scale bar, 50 μm. (k) Immunofluorescence staining of CD31 and NG2, showing microvessels and pericyte coverage in Ythdf2F/F and Ythdf2LKO mouse livers. n = 7–9 mice. Scale bar, 50 μm. Error bars indicate means ± SEM *P < 0.05, **P < 0.01, ***P < 0.001, **** P < 0.0001. P-values were determined by two tailed t-test
Fig. 3
Fig. 3
YTHDF2 inhibits IL-11 and Serpin E2 expression in HCC cells. (a) Volcano plots showing up (red) - or down (blue) -regulated genes in SMMC7721-shYTHDF2 versus SMMC7721-shCtrl cells, as assessed by RNA-seq. (b) GO analysis based on the RNA-seq in (A), showing the most significant GO terms and the P values. (c) Screening strategy showing a group of overlapped genes that were concomitant in YTHDF2-deficiency-induced upregulation and hypoxia-induced hyper-upregulation. (d, g) Immunoblots showing STAT3 phosphorylation (d) and Serpin E2 (g) expression in indicated SMMC7721 cells grown for 24 h under Nx or Hx. n = 2 independent experiments. (e) RT-qPCR analysis of the relative mRNA levels of IL11 (left) and SERPINE2 (right) in indicated SMMC7721 cells grown for 24 h under Nx or Hx. n = 3 biological replicates. (f) ELISA analysis of the quantitative protein levels of IL-11 in the culture supernatant of indicated SMMC7721 cells grown for 24 h under Nx or Hx. n = 3 biological replicates. (h) Volcano plots showing up (red) - or down (blue) -regulated genes in SMMC7721-OE versus SMMC7721-EV cells grown for 12 h under hypoxia, as assessed by RNA-seq. (i) RT-qPCR analysis of the relative mRNA levels of IL11 (left) and SERPINE2 (right) in SMMC7721-EV and SMMC7721-OE cells grown for 0, 6, 12 or 24 h under Hx. n = 3 biological replicates. (j) Immunoblots showing STAT3 phosphorylation in indicated SMMC7721 cells grown for 24 h under Nx or Hx. n = 2 independent experiments. Error bars indicate means ± SEM *P < 0.05, **P < 0.01, ***P < 0.001, **** P < 0.0001. P-values were determined by two tailed t-test
Fig. 4
Fig. 4
YTHDF2 processes m6A-marked IL11 and SERPINE2 mRNAs for decay. (a) m6A-enrichment in the IL11 and SERPINE2 mRNAs in SMMC7721 cells expressing empty vector (EV) or overexpressing YTHDF2 (OE), as assessed by MeRIP-qPCR. The cells were subjected to Nx or Hx for 12 h. n = 3 biological replicates. (b) Gene enrichment of IL11 and SERPINE2 in YTHDF2-mRNA complex immunoprecipitated from SMMC7721-OE cells, as determined by RIP-qPCR. The cells were subjected to Nx or Hx for 12 h. n = 3 biological replicates. (c, d) RNA lifetime of IL11 and SERPINE2 in indicated SMMC7721 cells, as determined by monitoring transcript abundance after transcription inhibition (TI). The cells were subjected to Nx or Hx 8 h prior to TI initiation. n = 3 biological replicates. (e) The average read density showing the m6A peaks identified in IL11 and SERPINE2 transcripts in human HCC tissues as assessed using MeRIP-seq. n = 8 patients. (f) Luciferase reporter assay showing posttranscriptional regulation by YTHDF2 in the presence of IL11 (left) or SERPINE2 (right) 3’UTR. Indicated SMMC7721 cells were grown for 12 h under Nx or Hx. Renilla luciferase activity was normalized to firefly activity and presented as relative luciferase activity. n = 3 biological replicates. (g) Immunofluorescence staining of YTHDF2 and DCP1a (P-body marker) in YTHDF2-overexpressing SMMC7721 cells grown for 12 h under Nx or Hx. n = 3 biological replicates. Scale bar, 5 μm. (h) Fluorescence in situ hybridization of IL11 or SERPINE2 mRNA and immunofluorescence staining of DCP1a in indicated SMMC7721 cells grown for 12 h under Nx or Hx. n = 3 biological replicates. Scale bar, 5 μm. Error bars indicate means ± SEM *P < 0.05, **P < 0.01, ***P < 0.001, **** P < 0.0001. P-values were determined by two tailed t-test
Fig. 5
Fig. 5
YTHDF2 suppresses HCC by targeting IL11 and SERPINE2 mRNAs in a m6A-reader fashion. (a) An empty vector (EV) or vectors encoding wild-type (WT) or mutant YTHDF2 (W432A and W486A) were transduced into SMMC7721 cells with a YTHDF2-knockdown (KD) background. Proliferative activity of indicated SMMC7721 cells was assessed by CCK8 (left) or WST1 assay (right). n = 5 biological replicates. (b) Numbers of endothelial tubes formed by HUVEC cocultured with indicated SMMC7721 cells grown for 24 h under Nx or Hx. n = 3 biological replicates. (c) RT-qPCR analysis of the relative mRNA levels of IL11 (left) and SERPINE2 (right) in indicated SMMC7721 cells grown for 24 h under Nx or Hx. n = 3 biological replicates. (d) ELISA analysis of the quantitative protein levels of IL-11 in the culture supernatant in indicated SMMC7721 cells grown for 24 h under Nx or Hx. n = 3 biological replicates. (e) Immunoblots showing STAT3 phosphorylation and Serpin E2 expression in indicated SMMC7721 cells grown for 24 h under Nx or Hx. n = 2 independent experiments. (f) Indicated SMMC7721 cells were injected subcutaneously into NPG mice and tumor volumes were measured at indicated dates. n = 5 mice. (g) Control shRNA or shRNAs targeting IL11 and SERPINE2 were transduced into SMMC7721 cells with a YTHDF2-knockdown (KD) background. Proliferative activity of indicated SMMC7721 cells was assessed by CCK8 (upper) or WST1 assay (lower). n = 5 biological replicates. (h) Numbers of endothelial tubes formed by HUVEC cocultured with indicated SMMC7721 cells. n = 3 biological replicates. (i) Indicated SMMC7721 cells were injected subcutaneously into NPG mice and tumor volumes were measured at indicated time points. n = 5 mice. (j) Immunohistological staining of IL-11 and SerpinE2 in human HCC tissue arrays divided as YTHDF2Low and YTHDF2High categories according to median integrated optical density (IOD) value of YTHDF2. n = 143 patients. Scale bar, 200 μm. Error bars indicate means ± SEM *P < 0.05, **P < 0.01, ***P < 0.001, ****P < 0.0001. P-values were determined by two tailed t-test
Fig. 6
Fig. 6
HIF-2α blockade contributed to YTHDF2-dependet HCC inhibition. (a) Immunofluorescence staining of YTHDF2 and pimonidazole (PIMO) in SMMC7721-derived mouse tumors. Hypoxic tumor areas were marked by PIMO staining. n = 3 biological replicates. Scale bar, 20 μm.(b) Immunoblot of YTHDF2 in SMMC7721 cells transduced with a control siRNA (siCtrl) or siRNAs targeting HIF-1/2α and grown for 24 h under Nx or Hx. n = 2 independent experiments. (c) RT-qPCR analysis of YTHDF2 in SMMC7721 cells expressing indicated siRNAs after 24 h of Nx or Hx exposure. (d) Enrichment of hypoxia-responsive elements (HREs) -containing fragments of human Ythdf2 promoter in DNA-HIF-2α complex, as determined by ChIP-qPCR. n = 4 biological replicates. (e) Ythdf2 promoter activity in SMMC7721 cells expressing indicated siRNAs, as quantified using luciferase assay. Renilla luciferase activity was normalized to firefly activity and presented as relative luciferase activity. n = 3 biological replicates. (f) Proliferative activity of indicated SMMC7721 cells treated with vehicle or PT2385 (10 μM), as assessed by WST1 assay. n = 3 biological replicates. (g) Numbers of endothelial tubes formed by HUVEC cocultured with indicated conditions. n = 3 biological replicates. (h, j) Immunoblot of YTHDF2 (h) and p-STAT3 (j) in SMMC7721 cells treated with vehicle or PT2385 (10 μM). n = 2 independent experiments. (i) RT-qPCR analysis of IL11 (left) and SERPINE2 (right) mRNA levels. n = 3 biological replicates. (k, l) NPG mice bearing SMMC7721-shCtrl (K) or SMMC7721-shYTHDF2 (L) cells were orally treated with Vehicle or PT2385 (20 mg/kg/d) after reaching an average tumor volume of 200 mm3. Tumor volumes were continuously measured at indicated dates of treatment. n = 6 mice. Error bars indicate means ± SEM *P < 0.05, **P < 0.01, ***P < 0.001, ****P < 0.0001. P-values were determined by two tailed t-test
Fig. 7
Fig. 7
Schematic model showing how hypoxia perturbs YTHDF2 to promote cancer-associated inflammation. P-body, processing body

References

    1. Roundtree IA, Evans ME, Pan T, He C. Dynamic RNA modifications in gene expression regulation. Cell. 2017;169:1187–1200. doi: 10.1016/j.cell.2017.05.045. - DOI - PMC - PubMed
    1. Zhao BS, Roundtree IA, He C. Post-transcriptional gene regulation by mRNA modifications. Nat Rev Mol Cell Biol. 2017;18:31–42. doi: 10.1038/nrm.2016.132. - DOI - PMC - PubMed
    1. Nilsen TW. Molecular biology. Internal mRNA methylation finally finds functions. Science. 2014;343:1207–1208. doi: 10.1126/science.1249340. - DOI - PubMed
    1. Li Z, Weng H, Su R, Weng X, Zuo Z, Li C, Huang H, Nachtergaele S, Dong L, Hu C, et al. FTO plays an oncogenic role in acute myeloid leukemia as a N (6)-Methyladenosine RNA Demethylase. Cancer Cell. 2017;31:127–141. doi: 10.1016/j.ccell.2016.11.017. - DOI - PMC - PubMed
    1. Su R, Dong L, Li C, Nachtergaele S, Wunderlich M, Qing Y, Deng X, Wang Y, Weng X, Hu C, et al. R-2HG exhibits anti-tumor activity by targeting FTO/m (6) a/MYC/CEBPA signaling. Cell. 2018;172:90–105. doi: 10.1016/j.cell.2017.11.031. - DOI - PMC - PubMed

Publication types

MeSH terms