Clinical Trial
. 2020 Jan 22;38(4):779-789.
doi: 10.1016/j.vaccine.2019.10.102. Epub 2019 Nov 15.

A phase I trial evaluating the safety and immunogenicity of a candidate tuberculosis vaccination regimen, ChAdOx1 85A prime - MVA85A boost in healthy UK adults

Affiliations
Clinical Trial

A phase I trial evaluating the safety and immunogenicity of a candidate tuberculosis vaccination regimen, ChAdOx1 85A prime - MVA85A boost in healthy UK adults

Morven Wilkie et al. Vaccine. .

Abstract

Background: This phase I trial evaluated the safety and immunogenicity of a candidate tuberculosis vaccination regimen, ChAdOx1 85A prime-MVA85A boost, previously demonstrated to be protective in animal studies, in healthy UK adults.

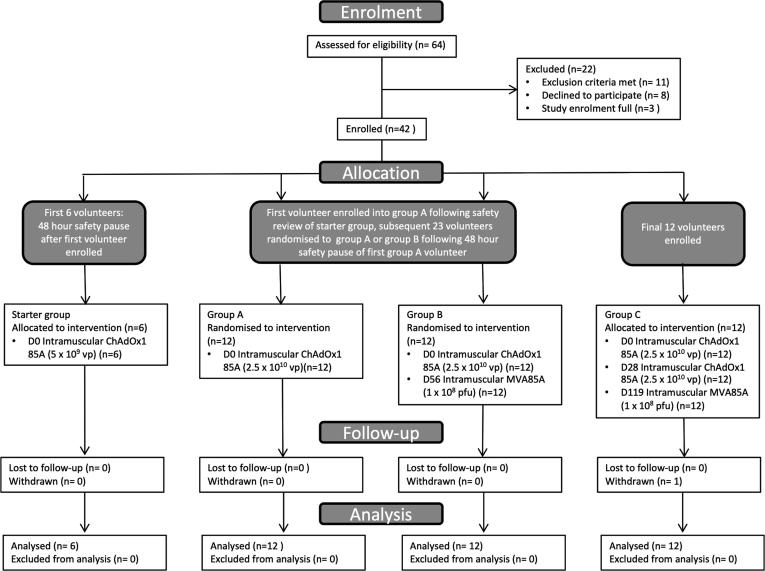
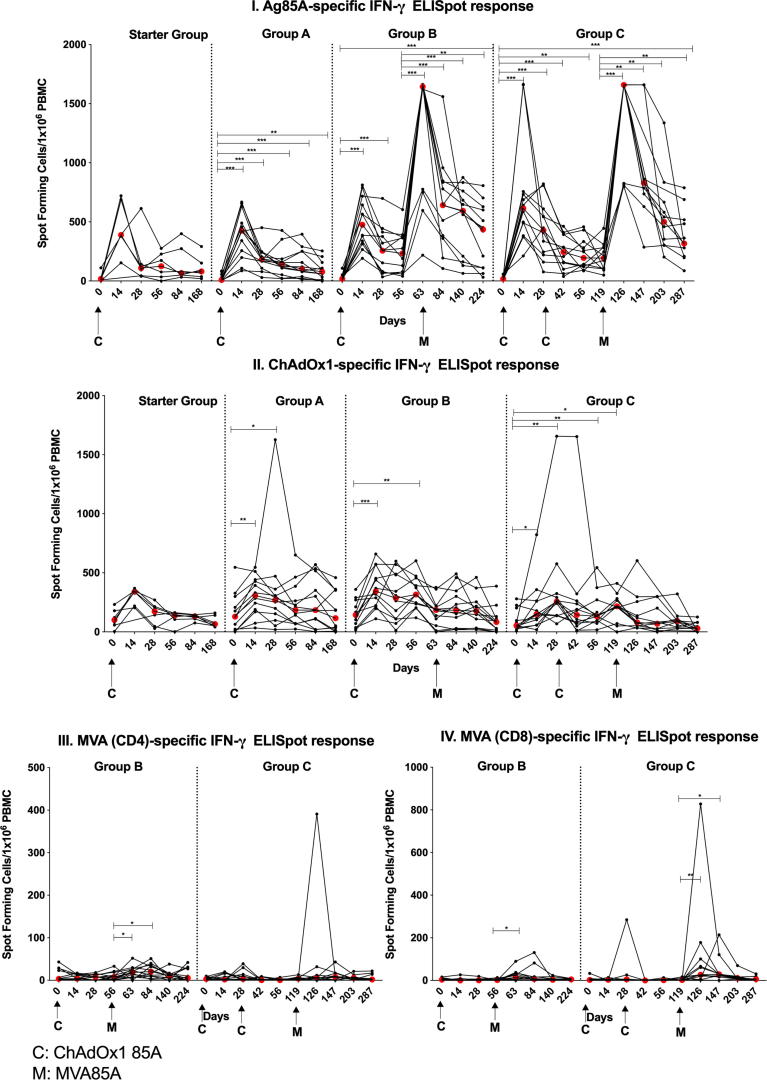
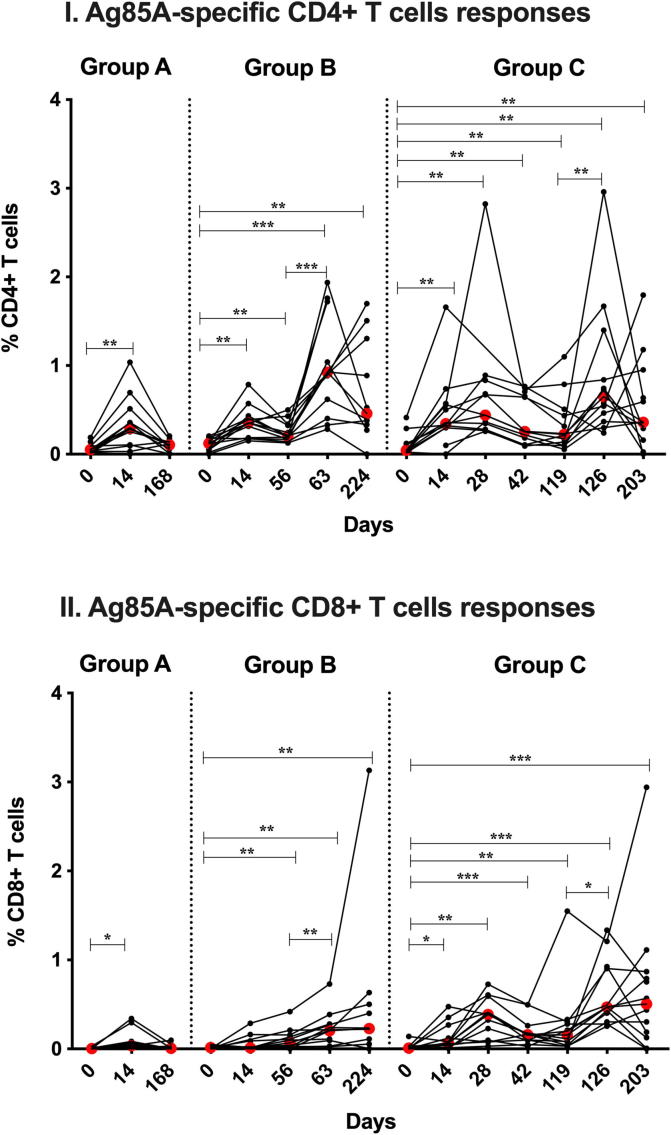
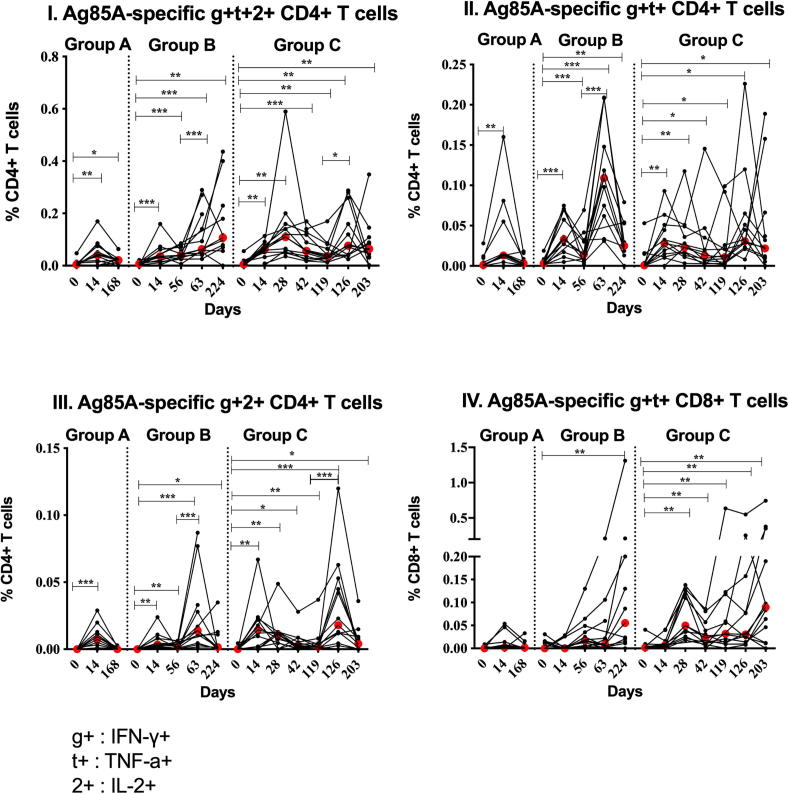
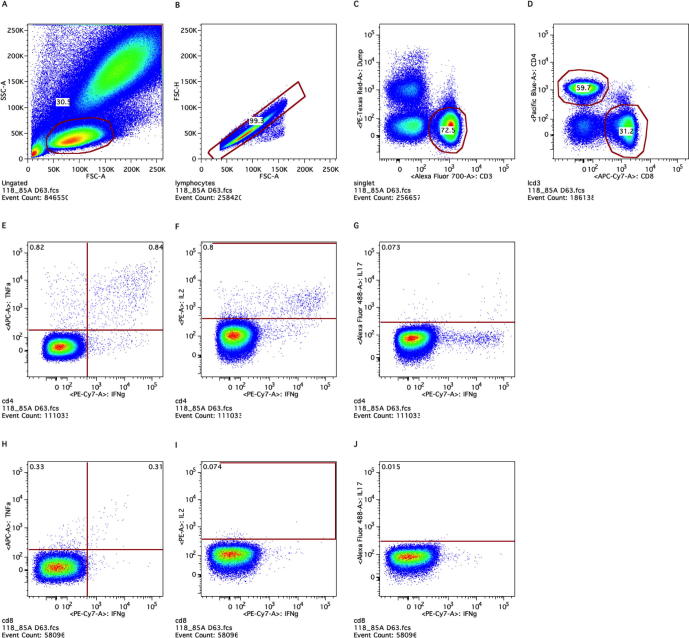
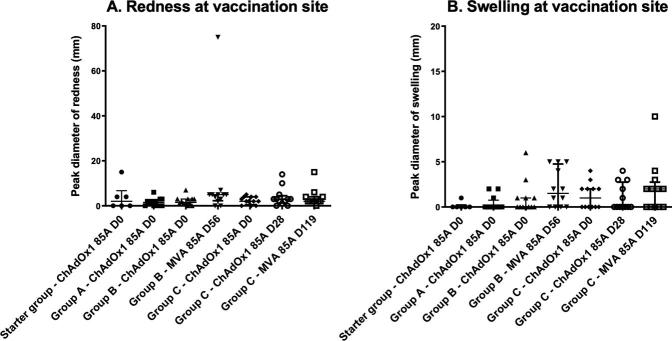
Methods: We enrolled 42 healthy, BCG-vaccinated adults into 4 groups: low dose Starter Group (n = 6; ChAdOx1 85A alone), high dose groups; Group A (n = 12; ChAdOx1 85A), Group B (n = 12; ChAdOx1 85A prime - MVA85A boost) or Group C (n = 12; ChAdOx1 85A - ChAdOx1 85A prime - MVA85A boost). Safety was determined by collection of solicited and unsolicited vaccine-related adverse events (AEs). Immunogenicity was measured by antigen-specific ex-vivo IFN-γ ELISpot, IgG serum ELISA, and antigen-specific intracellular IFN-γ, TNF-α, IL-2 and IL-17.

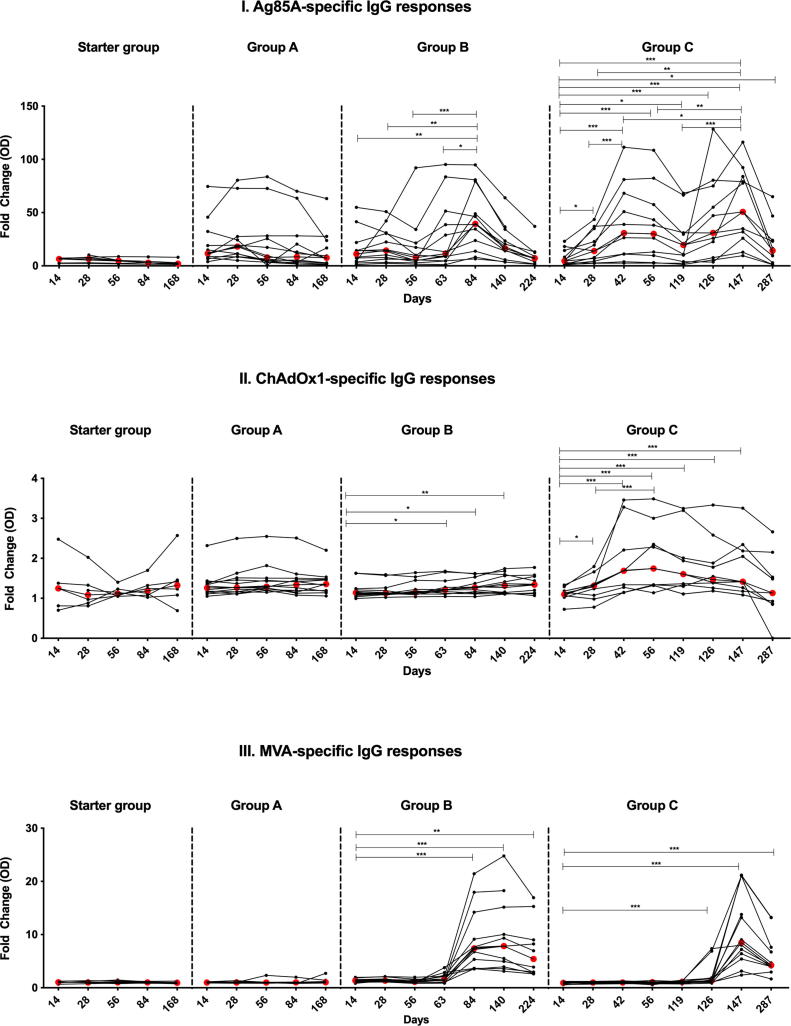
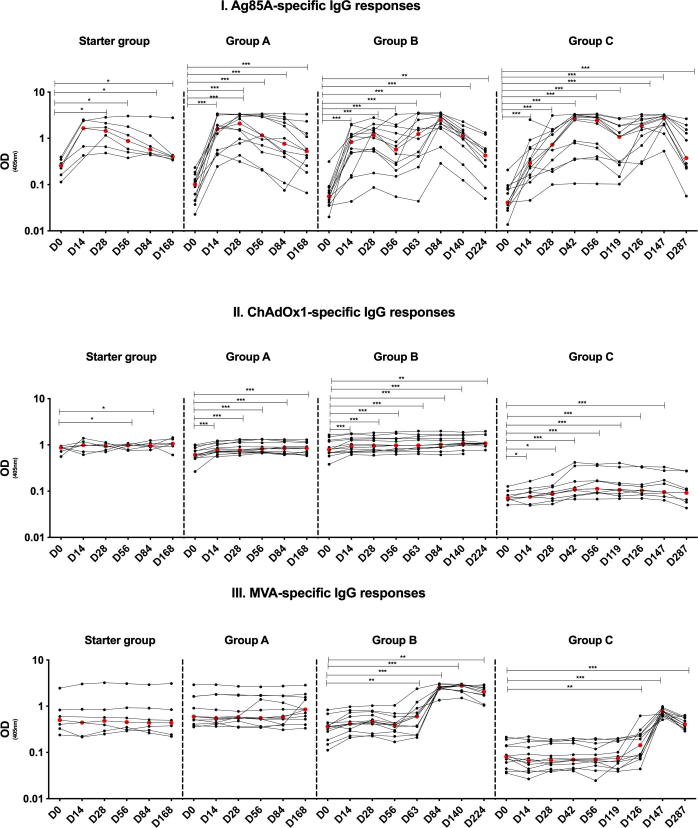
Results: AEs were mostly mild/moderate, with no Serious Adverse Events. ChAdOx1 85A induced Ag85A-specific ELISpot and intracellular cytokine CD4+ and CD8+ T cell responses, which were not boosted by a second dose, but were boosted with MVA85A. Polyfunctional CD4+ T cells (IFN-γ, TNF-α and IL-2) and IFN-γ+, TNF-α+ CD8+ T cells were induced by ChAdOx1 85A and boosted by MVA85A. ChAdOx1 85A induced serum Ag85A IgG responses which were boosted by MVA85A.

Conclusion: A ChAdOx1 85A prime - MVA85A boost is well tolerated and immunogenic in healthy UK adults.

Keywords: ChAdOx1 85A; Immunogenicity; MVA85A; Safety; Tuberculosis; Vaccine.


Conflict of interest statement

The authors declare that they have no known competing financial interests or personal relationships that could have appeared to influence the work reported in this paper.

Figures

Fig. 1
Fig. 1
Study profile – CONSORT flow diagram showing volunteer recruitment and follow-up. Starter Group (5 × 109 vp ChAdOx1 85A) enrolled first and following D14 safety review, first group A volunteer (2.5 × 1010 vp ChAdOx1 85A) enrolled. Following 48 h safety review of this volunteer, a further 23 volunteers subsequently randomised to group A or group B. Additional 12 volunteers enrolled into group C. One group C volunteer did not complete follow-up as withdrew from study prior to final visit; volunteer data included in analysis as all visits except D287 complete.
Fig. 2
Fig. 2
Ex vivo PBMC IFN-γ ELISpot responses (Spot Forming cells (SFC)/1 × 106 PBMC) to Ag85A pool of 66 peptides (I) and ChAdOx1 (II) in BCG-vaccinated healthy UK adults vaccinated with 5 × 109 vp ChAdOx1 85A (Starter Group (D0)) and 2.5 × 1010 vp (Groups A (D0), B (D0) and C (D0 and D28)). Group B and C were vaccinated with MVA85A (1 × 108 pfu) at D56 and D119 respectively. Results for IFN-γ responses to MVA peptides for CD4 (III), and CD8 epitopes (IV) are presented for study groups B and C. Individual values are shown for each volunteer. Red dots indicate median values. The Wilcoxon matched pairs signed rank test was used for comparing responses to baseline in each group. Significant differences between groups are as follows: *P ≤ 0.05, **P ≤ 0.01, ***P ≤ 0.001.
Fig. 3
Fig. 3
Whole blood ICS Ag85A-specific responses in volunteers vaccinated with ChadOx1 85A (2.5 × 1010 vp) (Groups A (D0), B (D0) and C (D0 and D28)). Group B and C were vaccinated with MVA85A (1 × 108 pfu) at D56 and D119 respectively. Percentages of CD4+ T cells producing IFN-γ, TNF-α, IL-2 and IL-17 (summed responses) are shown in figure (I) and Percentages of CD8+ T cells producing IFN-γ and TNF-α (summed responses) are shown in figure (II). Individual values are shown for each volunteer. Red dots indicate median values in each group. The Wilcoxon matched pairs signed rank test was used to detect differences between time points in the same group. Significant differences between groups are as follows: *P ≤ 0.05, **P ≤ 0.01, ***P ≤ 0.001.
Fig. 4
Fig. 4
Polyfunctionality of Ag85A-specific CD4+ (I-III) and CD8+ (IV) T cells in volunteers vaccinated with ChadOx1 85A (2.5 × 1010 vp) (Groups A (D0), B (D0) and C (D0 and D28)). Group B and C were vaccinated with MVA85A (1 × 108 pfu) at D56 and D119 respectively. Percentages of CD4+ T cells simultaneously producing IFN-γ (g+), TNF-α (t+) and IL-2 (2+), positive for IFN-γ and TNF-α and positive for IFN-γ and IL-2 are shown in figures (I), (II) and (III) respectively. Percentages of CD8+ T cells producing both IFN-γ and TNF-α are shown in figure (IV). Individual values are shown for each volunteer. Red dots indicate median values in each group. The Wilcoxon matched pairs signed rank test was used to detect differences between time points in the same group. Significant differences between groups are as follows: *P ≤ 0.05, **P ≤ 0.01, ***P ≤ 0.001. Results of the detected cytokines combinations are presented.
Fig. 5
Fig. 5
Serum antibody IgG responses in volunteers vaccinated with ChAdOx1 85A (Starter Group with 2.5 × 109 vp at D0), (A, B and C with 5 × 1010 vp at D0 for all group in addition to D28 in Group C). Groups A and B volunteers received MVA85A (1 × 108 pfu) at D56 and D119 respectively. Figure (I) shows responses to recombinant Ag85A, Figure (II) shows ChAdOx1-specific IgG responses and figure (III) presents anti-MVA IgG responses. Data is presented as fold change responses calculated by dividing each time point's antibody response (measured in optical density) by its corresponding D0 response. Individual values are shown for each volunteer. Red dots indicate median values in each group. The Wilcoxon matched pairs signed rank test was used to detect differences between time points in the same group. Significant differences between groups are as follows: *P ≤ 0.05, **P ≤ 0.01, ***P ≤ 0.001.
Supplementary figure 1
Gating strategy: Stimulated, fixed, lysed and stained whole blood samples were acquired on LSRII cytometer (BD) and data was analysed using Flowjo v8.8.7 (Treestar). Singlet, CD3+ and CD14-/CD19- lymphocytes were chosen (A-C). CD4+ and CD8+ T cells were gated on the CD3+ T cells (D). CD4+ and CD8+ T cells cytokines were gated (E-G and H-J respectively).
Supplementary figure 2
Local, solicited, vaccine reactogenicity. Figure shows peak diameter of redness (A) and swelling (B) at site of intramuscular vaccination in the 28 days following each vaccination with median and IQR shown.
Supplementary figure 3
Serum antibody IgG responses in volunteers vaccinated with ChAdOx1 85A (Starter Group with 2.5 × 109 vp at D0), (A, B and C with 5 × 1010 vp at D0 for all group in addition to D28 in Group C). Groups A and B volunteers received MVA85A (1 × 108 pfu) at D56 and D119 respectively. Figure (I) shows responses to recombinant Ag85A, Figure (II) shows ChAdOx1-specific IgG responses and figure (III) presents anti-MVA IgG responses. Data is presented in Optical Density (OD) measured at 405nm. Individual values are shown for each volunteer. Red dots indicate median values in each group. The Wilcoxon matched pairs signed rank test was used to detect differences between time points in the same group. Significant differences between groups are as follows: *P ≤ 0.05, **P ≤ 0.01, ***P ≤ 0.001.

References

    1. WHO, Global tuberculosis report 2016; 2017.
    1. The Global Plan to End TB: The Paradigm Shift 2016–2020. Stop TB Partnership; 2016.
    1. Colditz G.A. Efficacy of BCG vaccine in the prevention of tuberculosis: meta-analysis of the published literature. JAMA. 1994;271(9):698–702. - PubMed
    1. Trunz B.B., Fine P., Dye C. Effect of BCG vaccination on childhood tuberculous meningitis and miliary tuberculosis worldwide: a meta-analysis and assessment of cost-effectiveness. The Lancet. 2006;367(9517):1173–1180. - PubMed
    1. Rodrigues L.C., Diwan V.K., Wheeler J.G. Protective effect of BCG against tuberculous meningitis and miliary tuberculosis: a meta-analysis. Int J Epidemiol. 1993;22(6):1154–1158. - PubMed

Publication types

MeSH terms