. 2019 Dec 3;30(6):1152-1170.e13.
doi: 10.1016/j.cmet.2019.10.007. Epub 2019 Nov 14.

Selective Persulfide Detection Reveals Evolutionarily Conserved Antiaging Effects of S-Sulfhydration

Affiliations

Selective Persulfide Detection Reveals Evolutionarily Conserved Antiaging Effects of S-Sulfhydration

Jasmina Zivanovic et al. Cell Metab. .

Erratum in

  • Selective Persulfide Detection Reveals Evolutionarily Conserved Antiaging Effects of S-Sulfhydration.
    Zivanovic J, Kouroussis E, Kohl JB, Adhikari B, Bursac B, Schott-Roux S, Petrovic D, Miljkovic JL, Thomas-Lopez D, Jung Y, Miler M, Mitchell S, Milosevic V, Gomes JE, Benhar M, Gonzalez-Zorn B, Ivanovic-Burmazovic I, Torregrossa R, Mitchell JR, Whiteman M, Schwarz G, Snyder SH, Paul BD, Carroll KS, Filipovic MR. Zivanovic J, et al. Cell Metab. 2020 Jan 7;31(1):207. doi: 10.1016/j.cmet.2019.12.001. Cell Metab. 2020. PMID: 31914376 Free PMC article. No abstract available.

Abstract

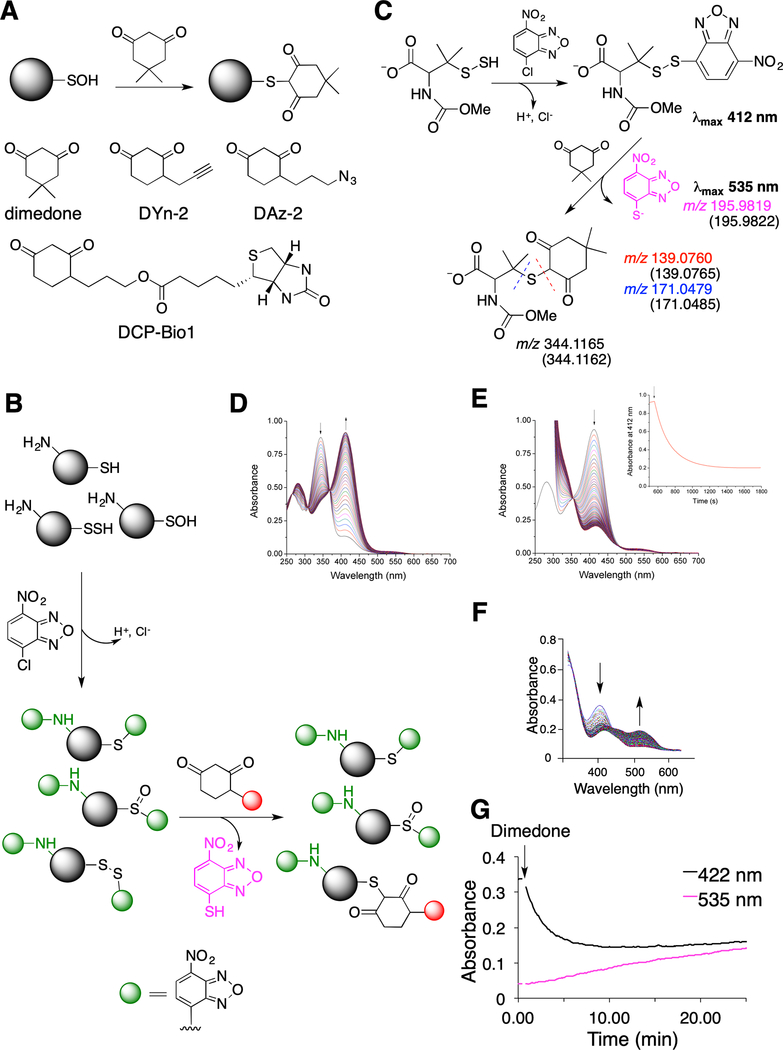
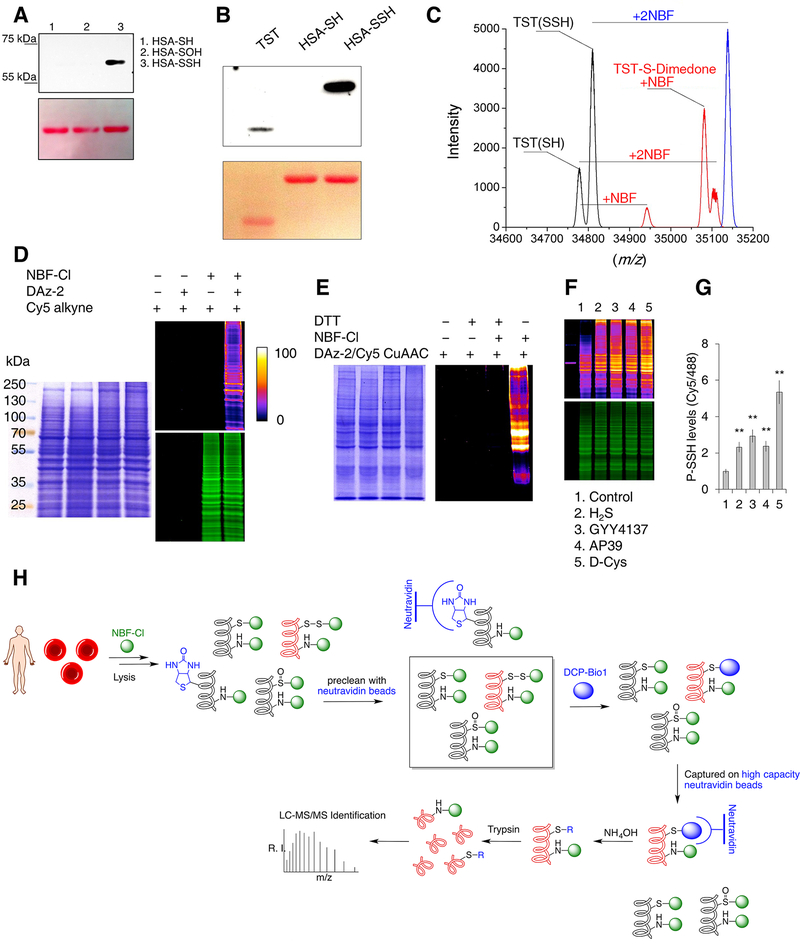
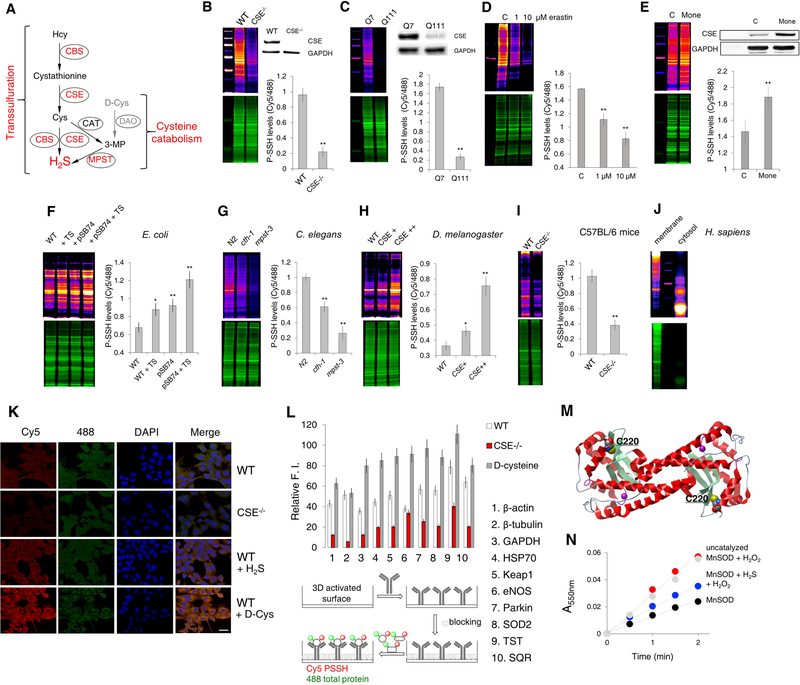
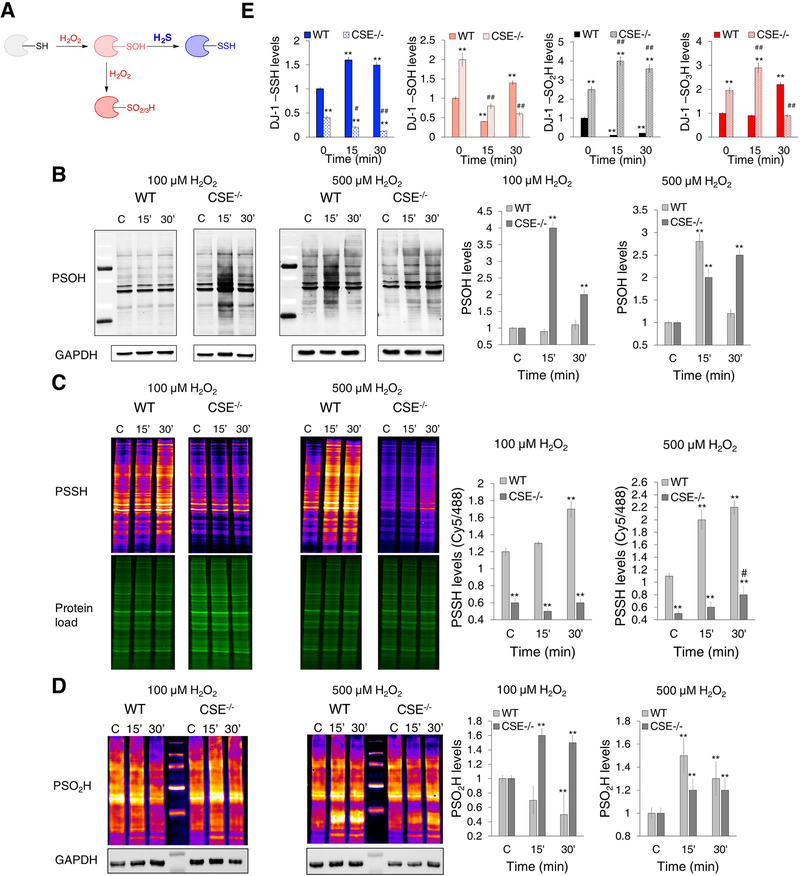
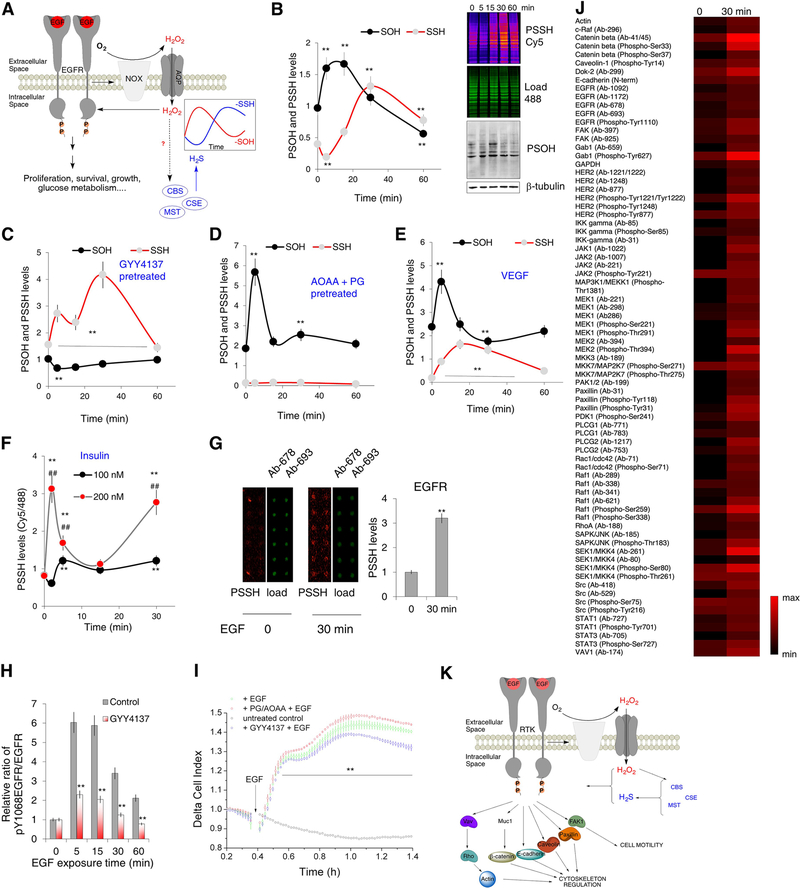
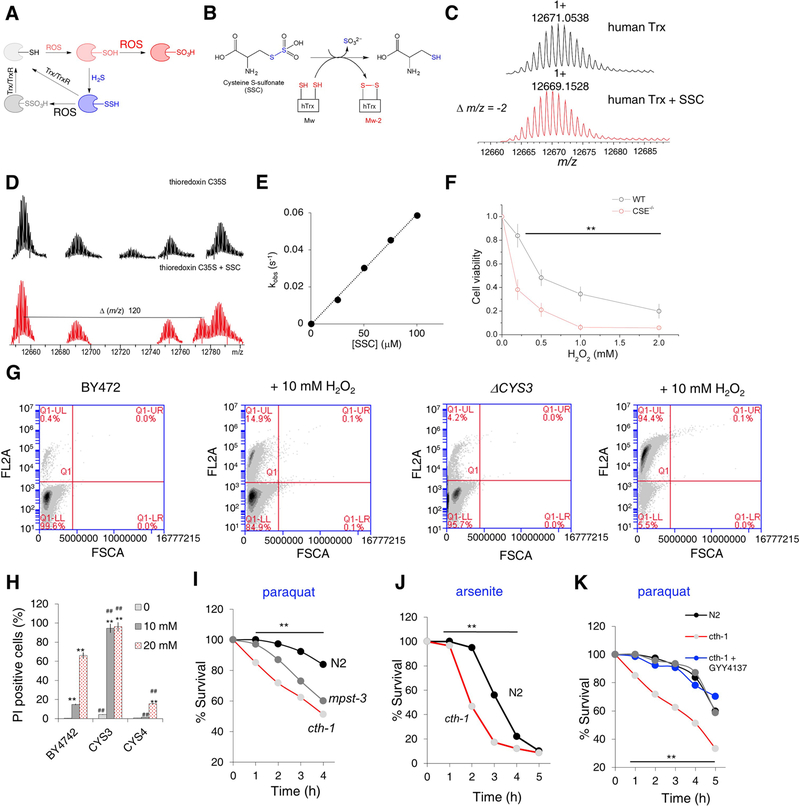
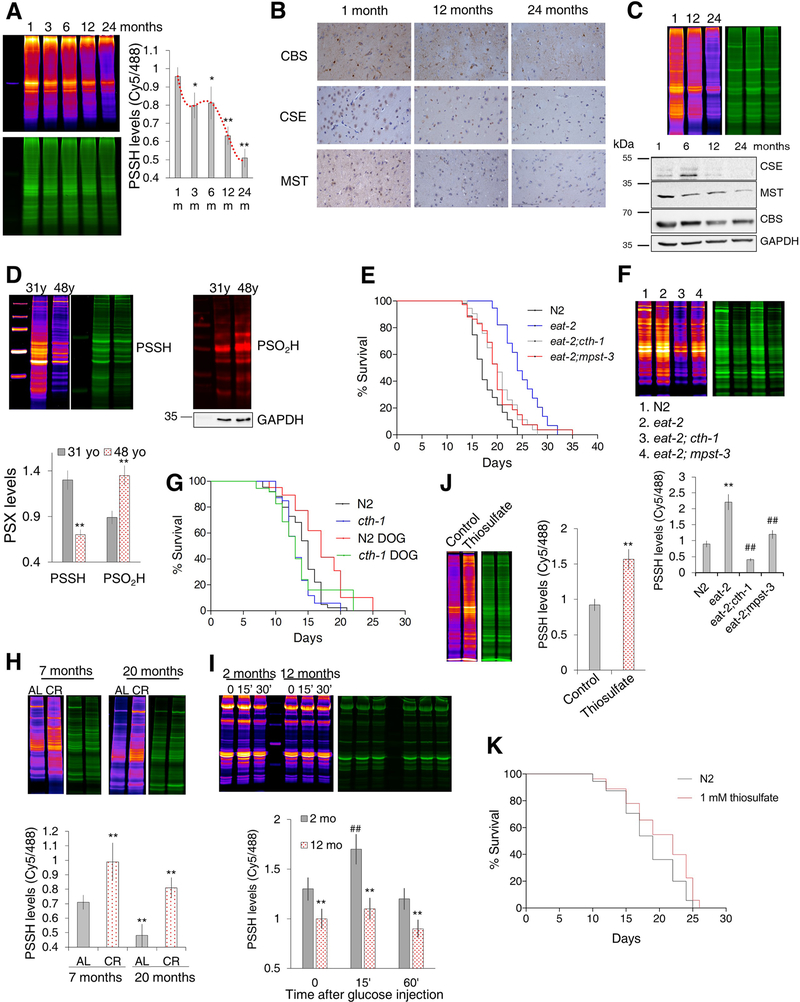
Life on Earth emerged in a hydrogen sulfide (H2S)-rich environment eons ago and with it protein persulfidation mediated by H2S evolved as a signaling mechanism. Protein persulfidation (S-sulfhydration) is a post-translational modification of reactive cysteine residues, which modulate protein structure and/or function. Persulfides are difficult to label and study due to their reactivity and similarity with cysteine. Here, we report a facile strategy for chemoselective persulfide bioconjugation using dimedone-based probes, to achieve highly selective, rapid, and robust persulfide labeling in biological samples with broad utility. Using this method, we show persulfidation is an evolutionarily conserved modification and waves of persulfidation are employed by cells to resolve sulfenylation and prevent irreversible cysteine overoxidation preserving protein function. We report an age-associated decline in persulfidation that is conserved across evolutionary boundaries. Accordingly, dietary or pharmacological interventions to increase persulfidation associate with increased longevity and improved capacity to cope with stress stimuli.

Keywords: aging; calorie restriction; hydrogen peroxide; hydrogen sulfide; protein persulfidation; redox signaling; sulfenylation; sulfinylation; sulfonylation.


Conflict of interest statement

Declaration of Interests: MW and the University of Exeter have patents on the therapeutic and agricultural use of mitochondria-targeted, and other, hydrogen sulfide delivery molecules. All other authors declare no competing interests.

Figures

Fig. 1.
Fig. 1.. Probing dimedone switch strategy for persulfide labeling.
(A) (Upper) Labeling of sulfenic acids with dimedone. (Lower) Structures of dimedone-based probes. (B) Proposed dimedone switch strategy for persulfide labeling. In the first step proteins react with 4-chloro-7-nitrobenzofurazan (NBF-Cl) to label persulfides, thiols, sulfenic acids, and amino groups. Reaction with amino groups gives characteristic green fluorescence. In the second step, NBF tag is switched by a dimedone-based probe, selectively labeling persulfides. (C) Model switch reaction with 100 μM N-methoxycarbonyl penicillamine persulfide (nmc-PSSH) and 100 μM NBF-Cl, followed by 500 μM dimedone. MS analysis reveals formation of 4-thio-7-nitrobenzofurazan (535 nm) and dimedone labeled nmc-penicillamine, which under MS/MS conditions decomposes along the blue or red dash line. Numbers given in the brackets represent calculated m/z for the observed ions. (D) Time-resolved spectra for the reaction of 100 μM nmc-PSSH with 100 μM NBF-Cl (pH 7.4, 23 °C). Arrows indicated disappearance of NBF-Cl and appearance of nmc-PSS-NBF adduct at 412 nm. (E) Time-resolved spectral changes upon addition of 200 μM dimedone to a reaction mixture shown in (D) (pH 7.4, 23 °C). Inset: Kinetics of decay of 412 nm absorbance maximum after addition of dimedone. (F-G) 23 μM HSA-SSH was left to react with 100 μM NBF-Cl over 30 min in phosphate buffer (50 mM, pH 7.4) with 1% SDS, at 37 °C and then 200 μM dimedone was added. UV-Vis spectral changes (F) and kinetic traces (G) show the decay of the 422 nm absorbance and the appearance of a 535 nm peak.
Figure 2.
Figure 2.. Protein persulfide labeling and identification.
(A-B) Selectivity of dimedone-switch method for protein persulfides. Human serum albumin (HSA, A) and TST (B) were used as models. Dimedone labeling was visualized by rabbit polyclonal anti-dimedone antibody. Ponceau S staining was used for the protein load. (C) Deconvoluted mass spectra 20 μM rhodanese (black), rhodanese treated with 100 μM NBF-Cl (blue) and rhodanese treated first with 100 μM NBF-Cl then with 500 μM dimedone (red). (D) In-gel detection of cellular PSSH levels. HeLa cells were lysed with or without supplementation of 10 mM NBF-Cl, and probed for persulfide labeling with or without DAz-2, followed by Cy5-alkyne using CuAAC. Gels were also stained with Coomassie Brilliant Blue. Fire pseudo-colouring was used to visually enhance the signal. Green fluorescence corresponds to the total protein load (NBF-protein adducts). (E) MEF cells lysed with or without 20 mM NBF-Cl samples and then treated with or without 20 mM DTT and labeled with DAz-2/Cy5-alkyne using CuAAC. (F-G) Protein persulfidation levels in HeLa cells treated with different H2S donors: 200 μM Na2S (H2S) for 45 min, 200 μM GYY4137 for 2 hr, 200 nM AP39 for 2 hr and 2 mM D-cysteine (D-Cys) for 1 hr. Ratio of Cy5/488 signals is used for the quantification (G). Data shown as a mean ± SD. of 3 individual experiments. ** p < 0.01 vs. control. (H) Schematic depiction of the protocol used for the proteomic analysis of endogenous persulfidation in RBC.
Figure 3.
Figure 3.. Intracellular persulfidation is evolutionarily conserved and controlled by H2S producing enzymes.
(A) Intracellular H2S production is catalyzed by cystathionine γ-lyase (CSE) and cystathionine-β-synthase (CBS), via the reverse transsulfuration pathway, and by 3-mercaptopyruvate sulfur transferase (MPST) in the cysteine catabolism pathway. Hcy: homocysteine; Cys: cysteine; 3MP: 3-mercaptopyruvate; CAT: cysteine aminotransferase; DAO: D-amino acid oxidase. (B) PSSH levels in MEF cells from wild type (WT) and CSE−/− mice. Ratio of Cy5/488 signals is used for the quantification. n = 4. ** p < 0.01 vs. WT. Data are shown as mean ± SD. Inset: Western blot analysis of CSE levels. n = 3. (C) PSSH levels in STHdhQ7/Q7 and STHdhQ111/Q111 cells. n = 4. ** p < 0.01 vs. Q7. Inset: Representative Western blot of CSE protein expression levels. n = 3. (D) The effect of 1 and 10 μM Erastin (18.5 hr) on PSSH levels in WT MEF cells. n = 4. ** p<0.01 vs. control. (E) PSSH levels in WT MEF cells for control, C, and treated with 1 μM Monensin, Mone (18 hr). n = 3. ** p<0.01 vs. control. Inset: Representative Western blot of CSE protein expression levels. n = 3. (F) PSSH levels in E. coli without (WT) or with phsABC operon (pSB74 plasmid) that encodes thiosulfate reductase and results in H2S production. Both strains were treated with or without thiosulfate (TS, 4 hr at 37°C). n = 3. * p < 0.05, ** p < 0.01 vs. control. (G) PSSH levels in wild type (N2), cth-1 and mpst-3 C. elegans mutants. ~ 16000 worms per sample. Ratio of Cy5/488 signals is used for the quantification. n = 3. ** p < 0.01 vs. control. (H) PSSH levels in wild type (y1w118) Drosophila melanogaster and flies with different levels of CSE overexpression. 3–4 flies per samples. n = 3. * p<0.05, ** p<0.01 vs. WT. (I) PSSH levels in kidney extracts form wild type (C57BL/6J) and CSE−/− mice. n = 3 animals. ** p < 0.01 vs. WT. (J) Protein persulfidation in RBC membrane and cytosol from a healthy human donor. (K) Confocal microscopy images of intracellular protein persulfide levels of WT and CSE−/− MEFs treated or not with 200 μM Na2S (H2S) or 2 mM D-Cys for 1 hr. Cy5 signal corresponds to protein persulfides, 488 nm signal corresponds to NBF-adducts. Nuclei stained with DAPI. Scale bar 20 μm. (L) Antibody microarray-like approach to study persulfidation status of specific proteins. Schematic depiction of the method (lower part) and the actual readout (upper part) for the ten listed proteins. Cell lysates from WT, CSE−/− and WT MEFs treated with D-Cys (2 mM, 1 hr) were compared. Results are presented as a mean ± SD from 3 independent experiments. (M) Ribbon structure of two subunits from human MnSOD (PDB: 1pl4), highlighting the cysteine residues and manganese containing active site. (N) Persulfidation of MnSOD protects it from the H2O2-induced inactivation. SOD activity was measured using cytochrome c as a reporting molecule which is reduced by the superoxide generated from the xanthine/xanthine oxide system. Results are presented as a mean ± SD. from 3 independent experiments.
Figure 4.
Figure 4.. Endogenous H2S controls cysteine oxidation caused by H2O2.
(A) The proposed mechanism for the redox switching between H2O2-induced thiol oxidation and persulfidation. (B-D) Cysteine oxPTM levels in WT and CSE−/− MEF cells treated with 100 or 500 μM H2O2 for 15 and 30 min. (B) Protein sulfenylation (PSOH) (labeled with DCP-Bio1 and visualized with streptavidin-488). GAPDH was used as a loading control. n = 4. (C) Protein persulfidation (PSSH) (labeled with DAz-2:Cy5 as a switching agent). Ratio of Cy5/488 signals is used for the quantification. n = 3. (D) Protein sulfinylation (PSO2H) (labeled with BioDiaAlk and visualized with streptavidin-Cy5). GAPDH was used as a loading control. n = 5. PSOH and PSSH values were normalized to the levels found in untreated cells. ** p < 0.01 compared to the untreated WT cells; # p < 0.05 compared to the untreated CSE−/− cells. (E) Persulfidation, sulfenylation, sulfinylation and sulfonylation of DJ-1. WT and CSE−/− MEF cells were treated with 100 μM H2O2 for 15 or 30 min, labeled for PSSH, PSOH and PSO2H, immunoprecipitated with anti-DJ-1 antibody immobilized to agarose beads and immunoblotted with anti-biotin antibody. For sulfonylated DJ-1 (DJ-1-SO3H), antibody selective for C106 sulfonic acid of DJ-1 was used. n = 4. ** p < 0.01 vs. untreated WT. # p < 0.05, ## p < 0.01 vs. untreated CSE−/− cells.
Figure 5.
Figure 5.. Waves of protein persulfidation in RTK signaling.
(A) Schematic representation of the signaling events triggered by the epidermal growth factor receptor (EGFR) activation. Nox: NADPH oxidase; AQP: aquaporin. (B) HeLa cells treated with 100 ng/mL EGF for 5, 15, 30 or 60 min were analyzed for protein sulfenylation (labeled using DCP-Bio1 and visualized with streptavidin-488, levels calculated using β-tubulin as a loading control) and protein persulfidation (using dimedone switch method with Cy5 as a reporting molecule, levels calculated as a ratio of Cy5/488 fluorescence readouts). (Top) In-gel fluorescence of PSSH levels and Western blots for PSOH levels. (Bottom) Temporal dynamics of PSSH and PSOH changes upon EGF exposure. n ≥ 3. Values are presented as a mean ± SD. ** p < 0.01 vs. control (0). (C) Quantification of PSSH and PSOH changes as a function of time upon EGF exposure in HeLa cells, pretreated with GYY4137 (100 μM) for 30 min, prior the EGF treatment. n ≥ 3. Values are presented as a mean ± SD. ** p < 0.01 vs. control. (D) Quantification of PSSH and PSOH changes as a function of time upon EGF exposure in HeLa cells, pretreated with 2 mM mixture of inhibitors, aminooxyacetic acid (AOAA) and propargylglycine (PG) (1:1, 30 min), prior the EGF treatment. n ≥ 3. Values are presented as a mean ± SD. ** p < 0.01 vs. control. (E) Quantification of PSSH and PSOH changes in HUVEC as a function of time upon VEGF (40 ng/mL) exposure. n ≥ 3. Values are presented as a mean ± SD. ** p < 0.01 vs. control. (F) The effect of different insulin concentrations on PSSH levels in neuroblastoma (SHSY5Y) cells as a function of time of insulin exposure. n ≥ 3. Values are presented as a mean ± SD. ** p < 0.01 vs. untreated, ## p < 0.01 100 nM vs. 200 nM. (G) Persulfidation of EGF receptor of HeLa cells treated with 100 ng/mL EGF for 30 min, detected by two different antibodies using antibody microarray slides. Each antibody was spotted in pentaplicated. 2 technical replicates were performed. Values are presented as a mean ± SD. ** p < 0.01 vs. untreated (0). (H) Time-dependent phosphorylation of EGF receptor tyrosine 1068 (Y1068) as a response to EGF. HeLa cells were pretreated or not with GYY4137 (100 μM) for 2 hr prior to exposure to EGF (100 ng/mL). n = 3. ** p < 0.01 GYY4137 treated vs untreated. (I) Real-time measurement of EGF receptor activation in living cells recorded with xCELLigence RTCA DP system. HeLa cells were also pretreated with GYY4137 (100 μM, 30 min) or with 2 mM mixture of AOAA and PG (1:1, 30 min). EGF receptor activation was initiated by the addition of 150 ng/mL EGF. n = 4. Values are presented as a mean ± SD. ** p < 0.01 vs. untreated control. (J) Antibody microarray analysis of persulfidation of different kinases involved in the EGF signaling. HeLa cells were treated with 100 ng/mL EGF for 30 min. Each antibody was spotted in pentaplicated. 2 technical replicates were performed. (K) Schematic presentation of protein targets involved in actin remodeling, cytoskeleton regulation and cell motility, found to be persulfidated in cells treated with 100 ng/mL EGF for 30 min.
Figure 6.
Figure 6.. Cytoprotective effects of protein persulfidation.
(A) The proposed mechanism for the protective effects of protein persulfidation. Trx-thioredoxin, TrxR-thioredoxin reductase. (B) Model reaction of S-sulfocysteine (SSC) with human thioredoxin (hTrx). (C) Deconvoluted MS spectrum of 10 μM human recombinant Trx (black) and Trx treated with 10 μM S-sulfocysteine (SSC) (red). (D) Deconvolution of MS of 10 μM C35S Trx before (black) and after (red) the reaction with 10 μM SSC showing appearance of TrxS-S-Cys adduct in sample treated with SSC. (E) Plot of kobs vs. concentration of SSC for the reaction with human recombinant Trx. Reaction was followed fluorometrically by measuring conformational changes induced in Trx due to the cysteine oxidation. Values presented as a mean ± SD. n = 3. (F) Toxicity of H2O2 in WT and CSE−/− MEFs. Values presented as a mean ± SD. n = 3, ** p < 0.01 vs. control. (G-H) Flow cytometry analysis of cell death using propidium iodide (FL2A channel). Different S. cerevisiae strains were cultured overnight, adjusted to OD600 = 2, and grown for 27 hr without or with 10 mM and 20 mM H2O2. Upper left quadrant was used as a measure of dead cells. 150000 cells were analysed per measurement. n=2. ** p < 0.01 vs. untreated cells in the same group, ## p < 0.01 vs. corresponding treatment of BY4742 cells. (I-J) Survival curves of N2, cth-1 and mpst-3 C. elegans strains exposed to 60 mM paraquat (I) and 5 mM sodium arsenite (J). N>80 worms. Experiments were performed in triplicate. ** p < 0.01 vs. control. (K) The effect of short-term (3 hr) pre-exposure to GYY4137 (500 μM) or AP39 (100 nM) on survival rate of cth-1 C. elegans mutants treated with 60 mM paraquat. N>80 worms. Experiments were performed in triplicate. ** p < 0.01 vs. control.
Figure 7.
Figure 7.. Anti-aging properties of protein persulfidation.
(A) Changes in the persulfidation levels in brain extracts of male Wistar rats 1, 3, 6, 12 and 24 months of age, calculated as a ratio of Cy5/488 signal. Values are presented as a mean ± SD. n = 3/age group. * p < 0.05, ** p < 0.01 vs 1 month (1m). (B) Immunohistochemical analysis of CSE, CBS and MST expression levels in the cortex of 1-, 12- and 24-month-old male Wistar rats. Images are representative of 3 animals/experimental group, magnification 20x. (C) Protein persulfidation levels of 1-, 12- and 24-month-old hearts of male Wistar rats (top). Expression levels of CSE, CBS and MPST in hearts of 1-, 6-, 12- and 24-month-old male Wistar rats (bottom). Images are representative of 3 animals/experimental group. (D) PSSH and PSO2H levels in human fibroblasts originating from the same donor but collected at the age of 31 and 48. Quantification of thiol modifications, marked on y axis as PSX, represents average ± SD of n = 3. ** p < 0.01 vs. 31 yr. (E) Survival curves for N2, eat-2, eat-2;cth-1 and eat-2; mpst-3 double mutants. n > 100 per line. N2 = 17.8±0.5 days; eat-2 = 24.5±0.9 days; eat-2;cth-1 = 20.3±0.6 days; eat-2;mpst-3 = 20.2±0.7 days. For eat-2;cth-1 vs. eat-2 and eat-2;mpst-3 vs. eat-2 p < 0.001. (F) Persulfidation levels in N2, eat-2, eat-2;cth-1 and eat-2; mpst-3 C. elegans mutants. Values are presented as average ± SD. Protein extracts from ~16000 worms were used for each lane. n = 3. ** p < 0.01 vs. N2, ## p < 0.01 vs. eat-2. (G) Survival curves for N2 and cth-1 mutants grown in the absence or presence of 5 mM 2-deoxy-D-glucose (DOG). n = 110 per each line. N2 = 14.2±0.4 days, N2 5 mM DOG = 17.2 ± 1.0 days; cth-1 = 13.3 ± 0.4 days; cth-1 5 mM DOG = 13.7 ± 1.0 days. For N2 vs. N2 5 mM DOG p= 0.005; for cth-1 vs. cth-1 5 mM DOG p = n.s, for N2 vs. cth-1 p = 0.0565. (H) Age-induced PSSH changes in 7- and 20- month-old mice fed ad libitum (AL) and mice fed with calorie restriction diet (CR). n = 5 animals per group. ** p < 0.01 vs. 7-month AL mice. (I) Time-dependent PSSH changes in the muscle tissue of 2- and 12- month old male mice injected i.p. with D-glucose (2 g/kg body weight). n ≥ 3 animals per group. ** p < 0.01 control vs. 2-month old mice, ## p<0.01 2-month vs. 12month old mice. (J) Persulfidation levels in N2 worms with and without treatment of 1 mM thiosulfate. n = 3. ** p < 0.01 vs. control. (K) Survival curves for N2 C. elegans, and N2 treated with 1 mM thiosulfate. n > 160 per group. N2 = 18.5 ± 0.3 days, 1 mM thiosulfate = 20.3 ± 0.4 days. p < 0.0001

Comment in

References

    1. Aging C, Walther DM, Kasturi P, Mann M, Hartl FU, Walther DM, Kasturi P, Zheng M, Pinkert S, Vecchi G, et al. (2015). Article Widespread Proteome Remodeling and Aggregation in Aging C. elegans. Cell 161, 919–932. - PMC - PubMed
    1. Akaike T, Ida T, Wei FY, Nishida M, Kumagai Y, Alam MM, Ihara H, Sawa T, Matsunaga T, Kasamatsu S, et al. (2017). Cysteinyl-tRNA synthetase governs cysteine polysulfidation and mitochondrial bioenergetics. Nat. Commun 8, 1177. - PMC - PubMed
    1. Akter S, Fu L, Jung Y, Conte M. Lo, Lawson JR, Lowther WT, Sun R, Liu K, Yang J, and Carroll KS (2018). Chemical proteomics reveals new targets of cysteine sulfinic acid reductase. Nat. Chem. Biol 14, 995–1004. - PMC - PubMed
    1. Alexander BE, Coles SJ, Fox BC, Khan TF, Maliszewski J, Perry A, Pitak MB, Whiteman M, Wood ME, Nakashima I, et al. (2015). Investigating the generation of hydrogen sulfide from the phosphonamidodithioate slow-release donor GYY4137. Med. Chem. Commun 6, 1649–1655.
    1. Artaud I, and Galardon E (2014). A persulfide analogue of the nitrosothiol SNAP: formation, characterization and reactivity. Chembiochem 15, 2361–2364. - PubMed

MeSH terms

LinkOut - more resources