. 2019 Dec 16;51(6):684-697.e4.
doi: 10.1016/j.devcel.2019.10.011. Epub 2019 Nov 14.

Lumen Expansion Facilitates Epiblast-Primitive Endoderm Fate Specification during Mouse Blastocyst Formation

Affiliations

Lumen Expansion Facilitates Epiblast-Primitive Endoderm Fate Specification during Mouse Blastocyst Formation

Allyson Quinn Ryan et al. Dev Cell. .

Abstract

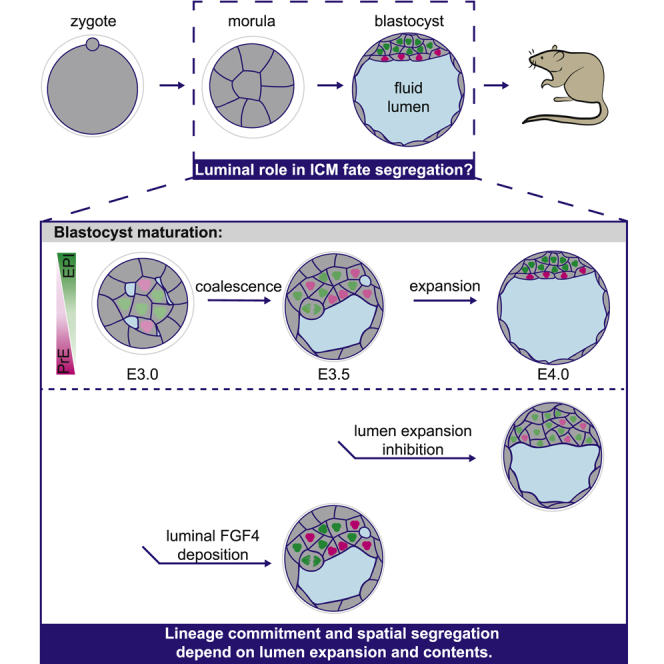
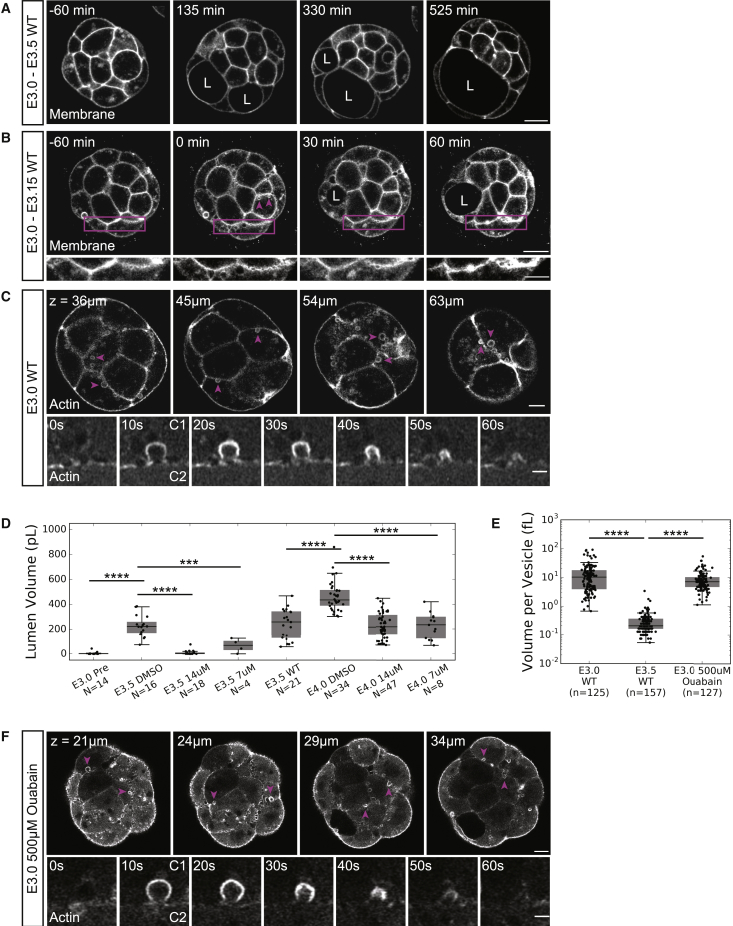
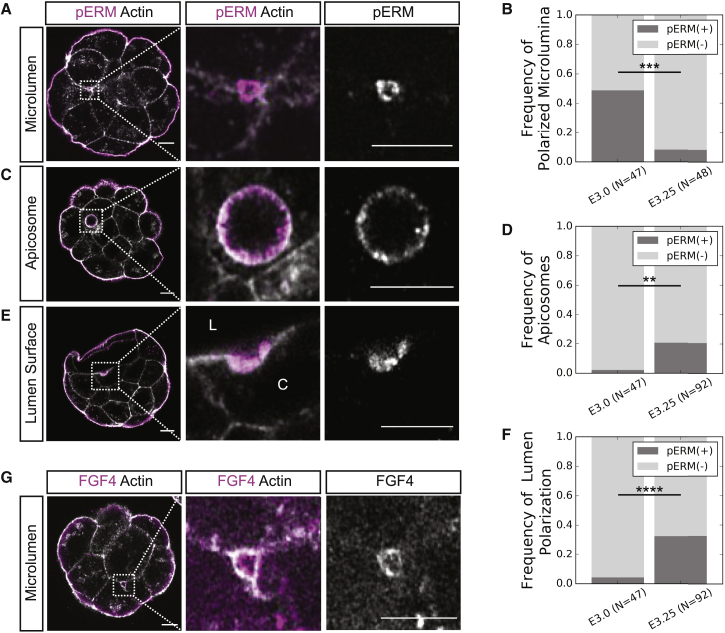
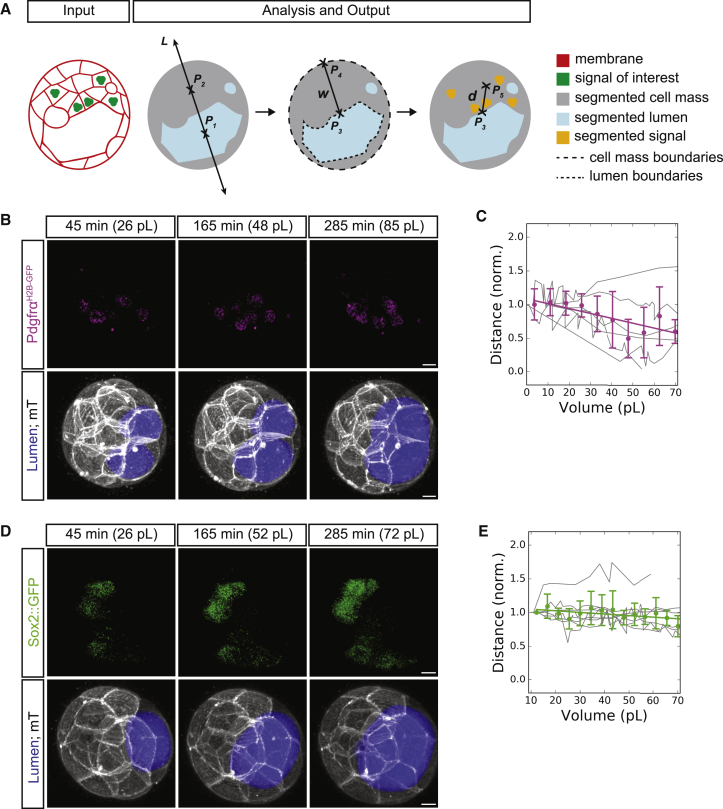
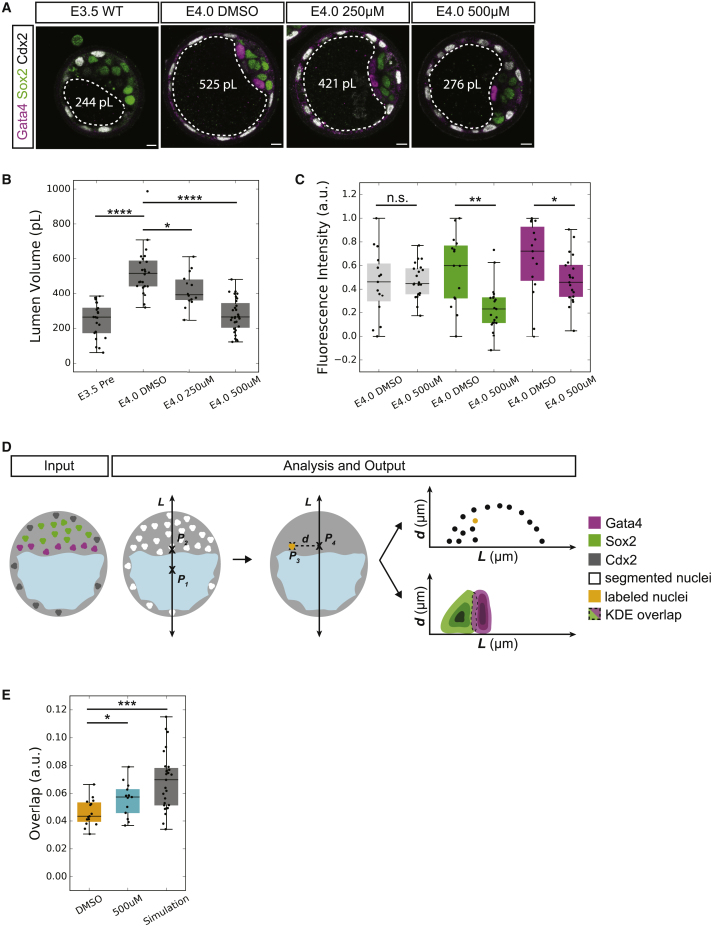
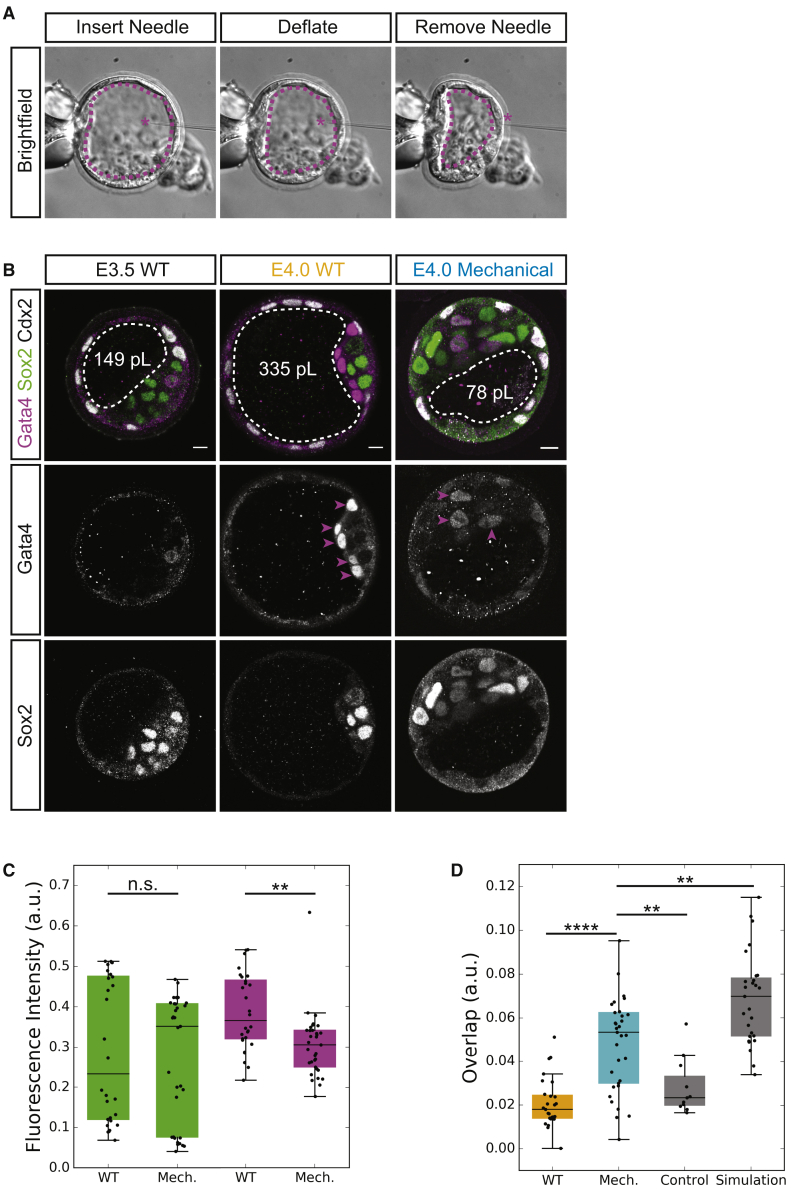
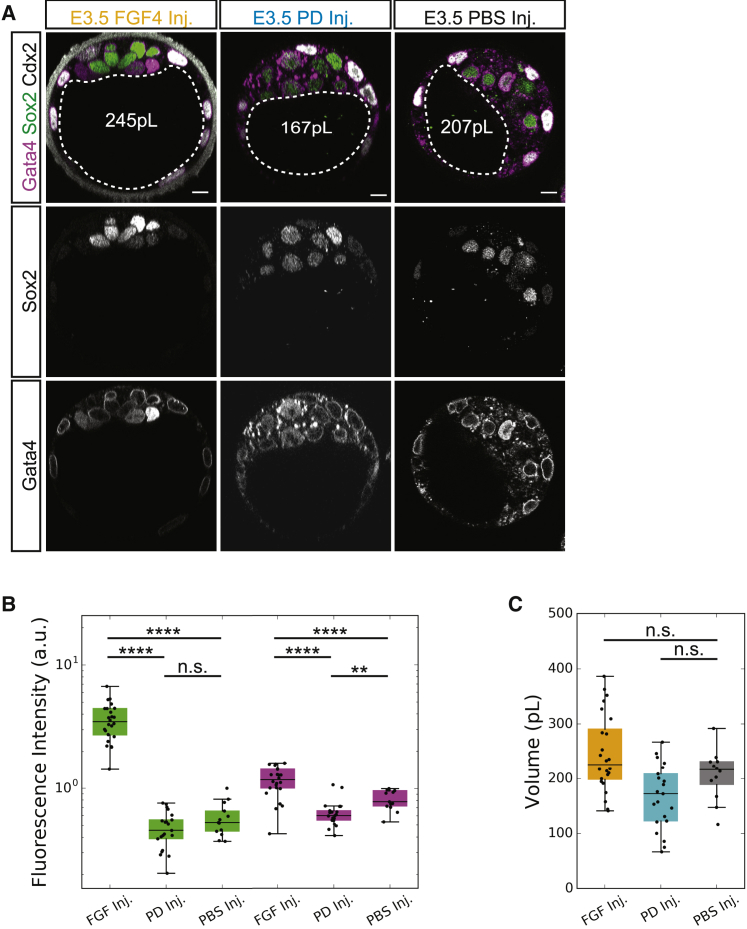
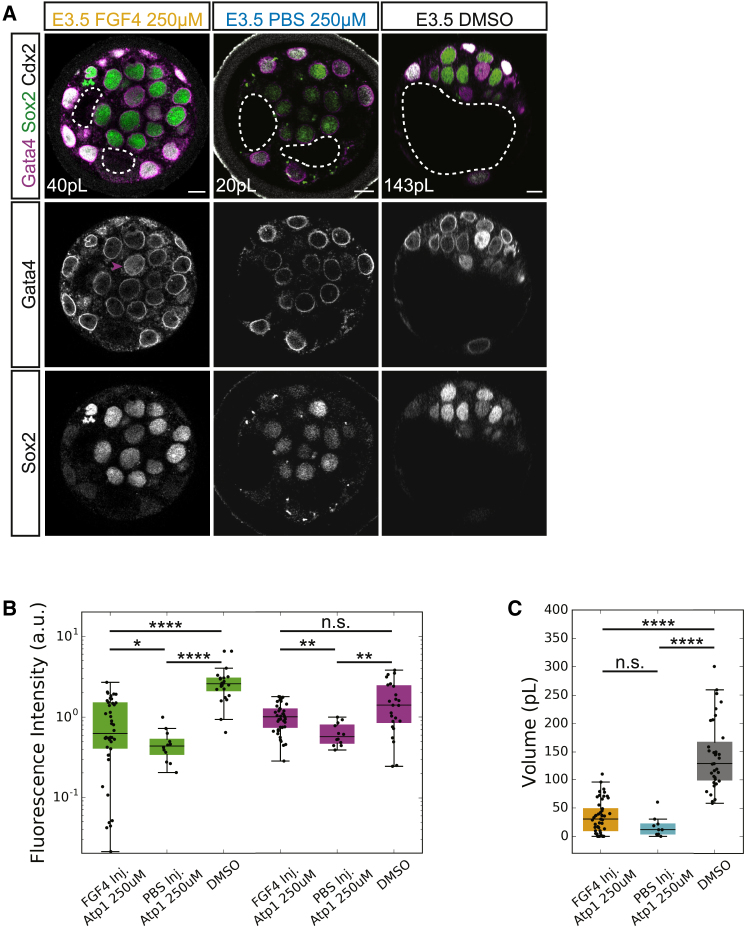
Epithelial tissues typically form lumina. In mammalian blastocysts, in which the first embryonic lumen forms, many studies have investigated how the cell lineages are specified through genetics and signaling, whereas potential roles of the fluid lumen have yet to be investigated. We discover that in mouse pre-implantation embryos at the onset of lumen formation, cytoplasmic vesicles are secreted into intercellular space. The segregation of epiblast and primitive endoderm directly follows lumen coalescence. Notably, pharmacological and biophysical perturbation of lumen expansion impairs the specification and spatial segregation of primitive endoderm cells within the blastocyst. Luminal deposition of FGF4 expedites fate specification and partially rescues the reduced specification in blastocysts with smaller cavities. Combined, our results suggest that blastocyst lumen expansion plays a critical role in guiding cell fate specification and positioning, possibly mediated by luminally deposited FGF4. Lumen expansion may provide a general mechanism for tissue pattern formation.

Keywords: FGF signaling; cell fate specification; cell sorting; early mammalian development; epiblast; lumenogenesis; mouse blastocyst; primitive endoderm; self-organization; vesicle release.


Conflict of interest statement

The authors declare no competing interests.

Figures

None
Graphical abstract
Figure 1
Figure 1
Blastocyst Cavities Are Partially Derived from Cytoplasmic Vesicles (A) Time-lapse of a representative embryo expressing a membrane marker undergoing lumen formation (L marks a lumen). t = 0 min when fluid accumulation is first detectable by automatic segmentation. Scale bar, 20 μm. (B) Time-lapse of the 1st h of fluid accumulation in an embryo expressing a membrane marker (L marks a lumen). t = 0 min when “string of pearls” microluminal structures are observed. Top row is full embryo view (magenta arrowheads highlight cytoplasmic vesicles, scale bar, 20 μm). Bottom row is insets of cell-cell interfaces indicated by magenta boxes in top row highlighting the appearance of “string of pearls”-like microlumina emergence and resolution (scale bar, 10 μm). (C) Z slices of phalloidin staining showing cortically-localized vesicles in an E3.0 embryo (top, magenta arrowheads highlight individual vesicles, scale bar, 10 μm). Time-lapse of vesicle secretion into intercellular space in a Lifeact-GFP E3.0 embryo (bottom, “C1” marks secreting cell, “C2” marks adjacent cell, scale bar, 2 μm). (D) Boxplot of volume for lumina in brefeldin A pharmacologically inhibited embryos. (E) Boxplot of volume for individual vesicles in WT embryos at E3.0 and E3.5, and ATP1 inhibited embryos at E3.0. (F) Z slices of an E3.0 embryo expressing Lifeact-GFP showing vesicle localization under Atp1 inhibition conditions (top, magenta arrowheads highlight individual vesicles, scale bar, 10 μm). Time-lapse of vesicle secretion into intercellular space under Atp1 inhibition conditions (bottom, “C1” marks secreting cell, “C2” marks adjacent cell, scale bar, 2 μm). ∗∗∗p < 0.001 ∗∗∗∗p < 0.0001. N = number of embryos. n = number of vesicles. For boxplots: central mark indicates the median; lower edge, 25%; upper edge, 75%; lower whisker, Q1 − (1.5 × IQR), where IQR = Q3−Q1; upper whisker, Q3 + (1.5 × IQR). See also Figure S1; Videos S1, S2, S3, and S4.
Figure 2
Figure 2
Microlumina Containing Secreted Apical Domain Components Are Transiently Upregulated during Early Phases of Fluid Accumulation (A) Representative immunofluorescence images of an apically polarized microlumina in an E3.0 embryo. (B) Frequency of apically polarized microlumina in E3.0 and E3.25 embryos (p < 0.001). (C) Representative immunofluorescence image of an E3.25 ICM cell containing an apicosome. (D) Frequency of apicosome occurrence in E3.0 and E3.25 embryos (p < 0.002). (E) Representative immunofluorescence image of an E3.25 ICM cell in which a subsection of its membrane facing the growing lumen is apically polarized (L-lumen; C-cytoplasm). (F) Frequency of lumen polarization in E3.0 and E3.25 embryos (p < 0.0001). (G) Z slice of an RNA-injected E3.0 embryo showing localization of FGF4-mNeonGreen to the membrane domains of a microlumen, representative of N = 7 embryos. All scale bars, 10 μm. Two-tailed Fisher's exact test ∗∗∗∗p < 0.0001, ∗∗∗p < 0.001, ∗∗p < 0.01 See also Figures S2 and S3; Videos S5 and S6; Table S2.
Figure 3
Figure 3
The Pdgfr⍺ Signaling Domain Approaches the Luminal Surface as the Lumen Grows in Volume (A) Schematic 2D representation of 3D analysis method for the tracking and normalization of fate reporter expression proximity to the ICM-lumen interface. P1,2,3,4,5 are 3D points. L is a 3D line (P1P2 equivalent) that defines the embryonic-abembryonic axis. w is the 3D line segment (P3P4 equivalent) that measures the ICM width. d is the 3D line segment (P3P5 equivalent) that measures the distance from the center of mass of the signal of interest to the ICM-lumen interface. See Image Analysis for formal definitions of all geometric entities. (B) Time-lapse of an E3.0 embryo expressing a PrE reporter (Pdgfr⍺H2B-GFP/+; top), a membrane marker and lumen segmentation (bottom). t = 0 min is defined as the first moment when a lumen can be segmented. Lumen volume (pL) is given for each time point shown. (C) Quantification of the distance of the center of Pdgfr⍺ signaling domain to the surface of the lumen over time (N = 6 embryos, thin gray lines are traces of individual embryos, magenta dots are binned averages with vertical capped lines showing standard deviations, thick magenta line is the linear regression y = −0.007x + 1.090, r2 = 0.653, p < 0.005). (D) Time-lapse of an E3.0 embryo expressing a cytoplasmic EPI reporter (Sox2::gfp; top), a membrane marker and lumen segmentation (bottom). t0 is defined as the first moment when a lumen can be segmented. Lumen volume (pL) is given for each time point shown. (E) Quantification of the distance of the center of Sox2 expression domain to the surface of the lumen over time (N = 8 embryos, thin gray lines are traces of individual embryos, green dots are binned averages with vertical capped lines showing standard deviations, thick green line is the linear regression y = −0.002x + 1.074, r2 = 0.339, p < 0.030). All scale bars, 10 μm.
Figure 4
Figure 4
EPI and PrE Expression Levels Are Reduced in ATP1-Inhibited Embryos (A) Immunofluorescence images of TE (Cdx2), EPI (Sox2), and PrE (Gata4) fate in pre-treatment control (E3.5 WT), Atp1 inhibited (E4.0 500 μM and E4.0 250 μM), and end-stage control (E4.0 DMSO) embryos. Lumen boundaries outlined by dashed white line and mean lumen volume in white text. Scale bars, 10 μm. (B) Boxplot of lumen volume for E3.5 WT (N = 21), E4.0 DMSO (N = 24), E4.0 250 μM Atp1 inhibited (N = 14) and E4.0 500 μM Atp1 inhibited (N = 31) embryos indicating that the impact on lumen volume is concentration dependent. (C) Boxplot of fluorescence levels of Cdx2 (gray), Sox2 (green), and Gata4 (magenta) in E4.0 500 μM Atp1 inhibited embryos compared to E4.0 DMSO controls. (D) Schematic 2D representation of 3D analysis method for spatial segregation of ICM lineages. P1,2,3,4 are 3D points. L is a 3D line (P1P2 equivalent) that defines the embryonic-abembryonic axis. d is the 3D line segment (P3P4 equivalent) that measures the perpendicular distance from the center of a cell to L. See Image Analysis for formal definitions of all geometric entities. (E) Boxplot of spatial overlap between EPI and PrE lineages within E4.0 control (DMSO, N = 15), E4.0 Atp1 inhibited (500 μM, N =13) and simulated data of maximal overlap in E4.0 WT embryos (Simulation, N = 27). ∗∗∗∗p < 0.0001, ∗∗∗p < 0.001, ∗∗p < 0.01, p < 0.05. n.s., not significant. For boxplots: central mark indicates the median; lower edge, 25%; upper edge, 75%; lower whisker, Q1 − (1.5 × IQR), where IQR = Q3 − Q1; upper whisker, Q3 + (1.5 × IQR). See also Figures S4 and S5; Table S2.
Figure 5
Figure 5
PrE Specification and Spatial Segregation of ICM Lineages Is Impaired by Mechanical Inhibition of Lumen Expansion (A) Brightfield images of mechanical deflation. Magenta asterisk marks the needle tip. Dotted magenta line indicates lumen boundary. (B) Immunofluorescence images of EPI (Sox2) and PrE (Gata4) fate in pre-manipulation control (E3.5 WT), E4.0 post-manipulation control (E4.0 WT), and E4.0 mechanically inhibited (E4.0 Mechanical) embryos. Magenta arrowheads indicate the position of cells expressing high levels of Gata4 within the ICM. White dotted line indicates lumen boundaries. Average lumen volume in white text. Scale bars, 10 μm. (C) Boxplot of fluorescence levels of Sox2 (green) and Gata4 (magenta) in mechanically inhibited (Mech., N = 33) and post-manipulation control (WT, N = 28) E4.0 embryos. (D) Boxplot of spatial overlap between EPI and PrE lineages within post-manipulation control (WT, N = 27), mechanically inhibited (Mech., N = 33), E4.0 procedural control (Control, N = 11), and E4.0 simulation of complete overlap in WT conditions (Simulation, N = 27). ∗∗∗∗p < 0.0001, ∗∗p < 0.01. n.s., not significant. For boxplots: central mark indicates the median; lower edge, 25%; upper edge, 75%; lower whisker, Q1 − (1.5 × IQR), where IQR = Q3 − Q1; upper whisker, Q3 + (1.5 × IQR). See also Figure S6 and Table S2.
Figure 6
Figure 6
Perturbation of FGF4 Signaling in the Lumen Impacts Molecular Specification of EPI and PrE Lineages (A) Immunofluorescence images of EPI (Sox2) and PrE (Gata4) fate in E3.5 post-FGF4 deposition (E3.5 FGF4 Inj.), E3.5 post-PD173074 deposition (E3.5 PD Inj.), and E3.5 post-PBS deposition (E3.5 PBS Inj.). White dotted line indicates lumen boundaries. Average lumen volume in white text. Scale bars, 10 μm. (B) Boxplot of fluorescence levels of Sox2 (green) and Gata4 (magenta) in E3.5 post-FGF4 deposition (FGF4 Inj., N = 24), E3.5 post-PD173074 deposition (PD Inj., N = 21), and E3.5 post-PBS deposition (PBS Inj., N = 13) embryos. (C) Boxplot of luminal volume in E3.5 post-FGF4 deposition (FGF4 Inj., N = 24), E3.5 post-PD173074 deposition (PD Inj., N = 21), and E3.5 post-PBS deposition (PBS Inj., N = 13). ∗∗∗∗p < 0.0001, ∗∗p < 0.01. n.s., not significant. For boxplots: central mark indicates the median; lower edge, 25%; upper edge, 75%; lower whisker, Q1 − (1.5 × IQR) where IQR = Q3 − Q1; upper whisker, Q3 + (1.5 × IQR). See also Figure S7.
Figure 7
Figure 7
Luminal Deposition of FGF4 Partially Rescues EPI-PrE Specification in ATP1-Inhibited Embryos (A) Immunofluorescence images of EPI (Sox2) and PrE (Gata4) fate in E3.5 post-FGF4 deposition and Atp1 inhibition (E3.5 FGF4 250 μM), E3.5 post-PBS deposition and Atp1 inhibition (E3.5 PBS 250 μM), and E3.5 control embryos (E3.5 DMSO). White dotted line indicates lumen boundaries. Average lumen volume in white text. Magenta arrowhead indicates cell with high Gata4 expression relative to neighboring cells. Scale bars, 10 μm. (B) Boxplot of fluorescence levels of Sox2 (green) and Gata4 (magenta) in E3.5 post-FGF4 deposition and Atp1 inhibition (250 μM FGF4 Inj., N = 42 embryos), E3.5 post-PBS deposition and Atp1 inhibition (250 μM PBS Inj., N = 12), and E3.5 control embryos (DMSO, N = 12). (C) Boxplot of luminal volume in E3.5 post-FGF4 deposition and Atp1 inhibition (250 μM FGF4 Inj., N = 49 embryos), E3.5 post-PBS deposition and Atp1 inhibition (250μM PBS Inj., N = 9), and E3.5 control embryos (DMSO, N = 38). p < 0.05, ∗∗p < 0.01, ∗∗∗∗p < 0.0001. n.s., not significant. For boxplots: central mark indicates the median; lower edge, 25%; upper edge, 75%; lower whisker, Q1 − (1.5 × IQR), where IQR = Q3 − Q1; upper whisker, Q3 + (1.5 × IQR).

Similar articles

Cited by

References

    1. Alvers A.L., Ryan S., Scherz P.J., Huisken J., Bagnat M. Single continuous lumen formation in the zebrafish gut is mediated by smoothened-dependent tissue remodeling. Development. 2014;141:1110–1119. - PMC - PubMed
    1. Anani S., Bhat S., Honma-Yamanaka N., Krawchuk D., Yamanaka Y. Initiation of Hippo signaling is linked to polarity rather than to cell position in the pre-implantation mouse embryo. Development. 2014;141:2813–2824. - PubMed
    1. Arnold K., Sarkar A., Yram M.A., Polo J.M., Bronson R., Sengupta S., Seandel M., Geijsen N., Hochedlinger K. Sox2+ adult stem and progenitor cells are important for tissue regeneration and survival of mice. Cell Stem Cell. 2011;9:317–329. - PMC - PubMed
    1. Artus J., Piliszek A., Hadjantonakis A.K. The primitive endoderm lineage of the mouse blastocyst: sequential transcription factor activation and regulation of differentiation by Sox17. Dev. Biol. 2011;350:393–404. - PMC - PubMed
    1. Aziz M., Alexandre H. The origin of the nascent blastocoel in preimplantation mouse embryos: ultrastructural cytochemistry and the effect of chloroquine. Dev. Biol. 1991;200:77–85. - PubMed

Publication types

MeSH terms

Substances

LinkOut - more resources