

Pathogen-induced pH changes regulate the growth-defense balance in plants
- PMID: 31736111
- PMCID: PMC6912046
- DOI: 10.15252/embj.2019101822
Pathogen-induced pH changes regulate the growth-defense balance in plants
Abstract
Environmental adaptation of organisms relies on fast perception and response to external signals, which lead to developmental changes. Plant cell growth is strongly dependent on cell wall remodeling. However, little is known about cell wall-related sensing of biotic stimuli and the downstream mechanisms that coordinate growth and defense responses. We generated genetically encoded pH sensors to determine absolute pH changes across the plasma membrane in response to biotic stress. A rapid apoplastic acidification by phosphorylation-based proton pump activation in response to the fungus Fusarium oxysporum immediately reduced cellulose synthesis and cell growth and, furthermore, had a direct influence on the pathogenicity of the fungus. In addition, pH seems to influence cellulose structure. All these effects were dependent on the COMPANION OF CELLULOSE SYNTHASE proteins that are thus at the nexus of plant growth and defense. Hence, our discoveries show a remarkable connection between plant biomass production, immunity, and pH control, and advance our ability to investigate the plant growth-defense balance.
Keywords: pH; cellulose; defense; growth.
© 2019 The Authors. Published under the terms of the CC BY NC ND 4.0 license.
Conflict of interest statement
The authors declare that they have no conflict of interest.
Figures
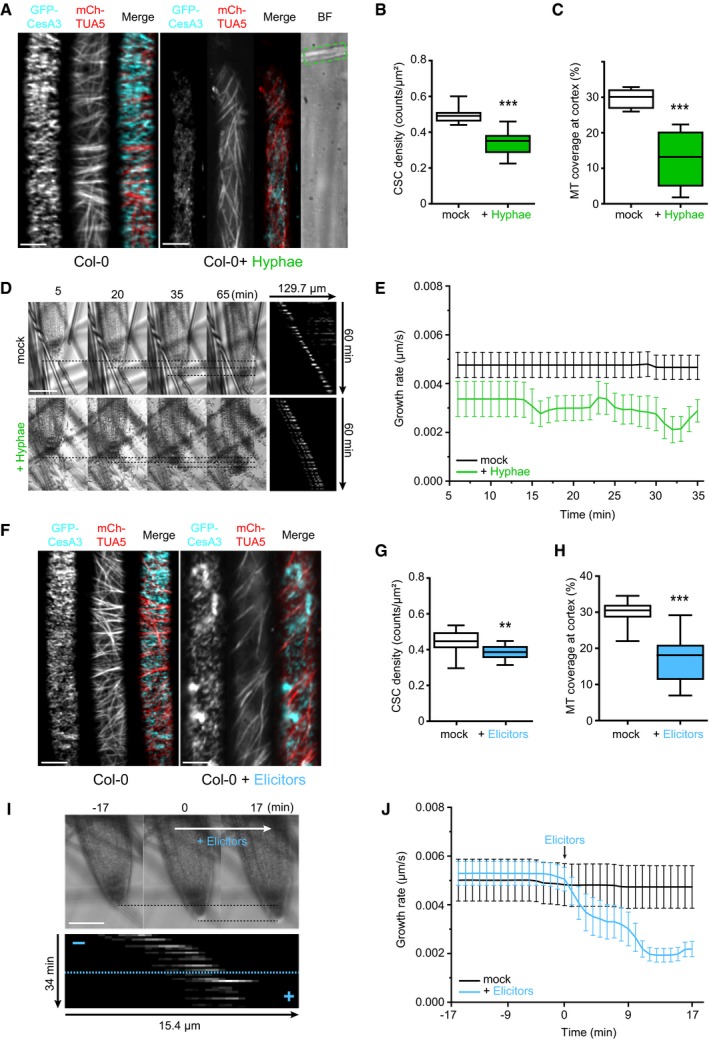
Representative image of a 5‐day‐old WT (Col‐0) GFP‐CesA3 and mCh‐TUA5 dual‐labeled root epidermal cell under mock conditions (left panel) or upon 5 min of Fo5176 hyphae contact (right panel). A green dashed line in the brightfield (BF) channel highlights Fo5176 hypha. Scale bar = 5 μm.
GFP‐CesA3 density at the plasma membrane after Fo5176 hyphae contact as depicted in (A). Box plots: centerlines show the medians; box limits indicate the 25th and 75th percentiles; whiskers extend to the minimum and maximum. N ≥ 25 cells from 14 roots and three independent experiments. Welch's unpaired t‐test; ***P‐value ≤ 0.001.
Microtubule density at the cell cortex after Fo5176 hyphae contact as depicted in (A). Box plots as described in (B). N ≥ 20 cells from 8 roots and three independent experiments. Welch's unpaired t‐test; ***P‐value ≤ 0.001.
Growth progression of roots grown in half MS or half MS + Fo5176 hyphae. Left panels: representative images of roots at different times after the corresponding treatment. Images of hyphae treatment were modified with an unsharp mask to enhance visibility of hyphae. Scale bar = 100 μm. Right panel: kymographs depicting growth of roots in the left panel.
Growth rate of roots in half MS or half MS + Fo5176 hyphae, analyzed from images as in (D). Roots were exposed to hyphae for 5 min before imaging started. Average growth rate in half MS: 0.0047 ± 0.0005 μm/s; average growth rate in half MS + Fo5176 hyphae: 0.0031 ± 0.0005 μm/s. Values are mean ± SEM, N ≥ 11 seedlings from three independent experiments. Welch's unpaired t‐test; P‐value ≤ 0.05.
Representative image of a 5‐day‐old WT (Col‐0) GFP‐CesA3 and mCh‐TUA5 dual‐labeled root epidermal cell under mock conditions (left panel) or upon 5‐min elicitor treatment (right panel). Scale bar = 5 μm.
GFP‐CesA3 density at the plasma membrane after elicitor treatment as depicted in (F). Box plots as described in (B). N ≥ 35 cells from 16 roots and three independent experiments. Welch's unpaired t‐test; **P‐value ≤ 0.01.
Microtubule density at the cell cortex, after elicitor treatment as depicted in (F). Box plots as described in (B). N ≥ 37 cells from 16 roots and three independent experiments. Welch's unpaired t‐test; ***P‐value ≤ 0.001.
Growth progression of roots exposed to fungal elicitor mix. Upper panel: representative images of roots grown in half MS (−17 to 0 min) and after being exposed to the fungal elicitor mix added at 0 min. Scale bar = 100 μm. Lower panel: kymograph depicting growth of roots in the upper panel.
Growth rate of roots exposed to fungal elicitors, analyzed from images as in (I). After 17 min of growth in half MS, H2O or elicitors were added and the growth rate was measured for additional 17 min. Average growth rate before treatment (−17 to 0 min): H2O: 0.0050 ± 0.0009 μm/s; elicitor mix: 0.0053 ± 0.0005 μm/s. Average growth rate after treatment (0–17 min): H2O: 0.0048 ± 0.0009 μm/s; elicitor mix: 0.0028 ± 0.0004 μm/s. Values are mean ± SEM, N ≥ 10 seedlings from three independent experiments. Welch's unpaired t‐test for roots before and after elicitor treatment; P‐value ≤ 0.01.
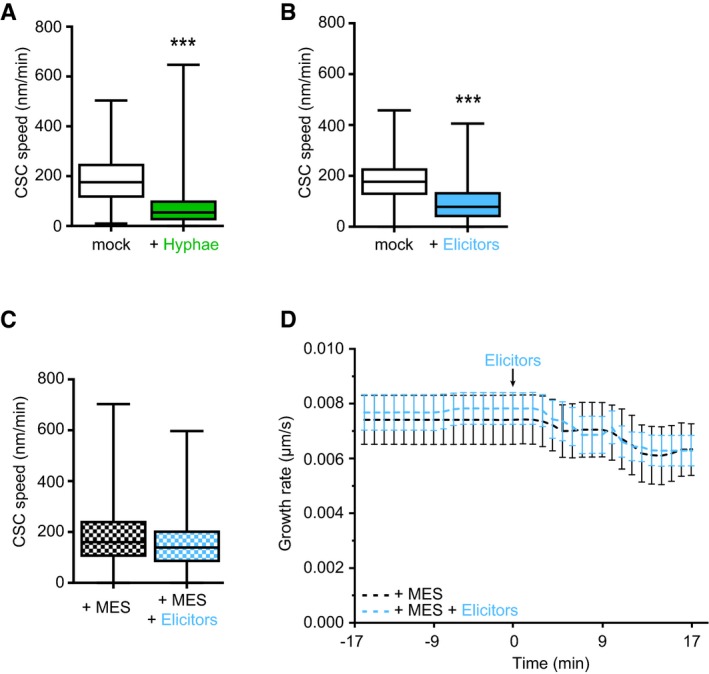
GFP‐CesA3 speed at the plasma membrane of WT (Col‐0) root cells 5 min after half MS treatment or Fo5176 contact (as depicted in Fig 1A). Box plots: centerlines show the medians; box limits indicate the 25th and 75th percentiles; whiskers extend to the minimum and maximum. N ≥ 369 particles from 6 cells and 6 roots and three independent experiments; Welch's unpaired t‐test; ***P‐value ≤ 0.001.
GFP‐CesA3 speed at the plasma membrane of WT (Col‐0) root cells 5 min after half MS or half MS + elicitor treatment (as depicted in Fig 1F). Box plots as described in (A). N ≥ 647 particles from 9 cells and 6 roots and three independent experiments; Welch's unpaired t‐test; ***P‐value ≤ 0.001.
GFP‐CesA3 speed at the plasma membrane of WT (Col‐0) root cells 5 min after being exposed to half MS + 5 mM MES and half MS + 5 mM MES + elicitor treatment (as depicted in Fig 2A). Box plots as described in (A). N ≥ 786 particles from 13 cells and 11 roots and three independent experiments.
Growth rate of WT (Col‐0) roots exposed to fungal elicitors and 5 mM MES. After 17 min of growth in half MS + 5 mM MES, H2O or elicitors were added and the growth rate was measured for an additional 17 min. Average growth rate before treatment (−17 to 0 min): 5 mM MES: 0.0074 ± 0.0009 μm/s; elicitors + 5 mM MES: 0.0068 ± 0.0010 μm/s. Average growth rate after treatment (0–17 min): 5 mM MES: 0.0077 ± 0.0024 μm/s; elicitors + 5 mM MES: 0.0069 ± 0.0020 μm/s. Values are mean ± SEM, N ≥ 11 seedlings from three independent experiments. Welch's unpaired t‐test for roots before and after elicitor treatment; P‐value = 0.33.
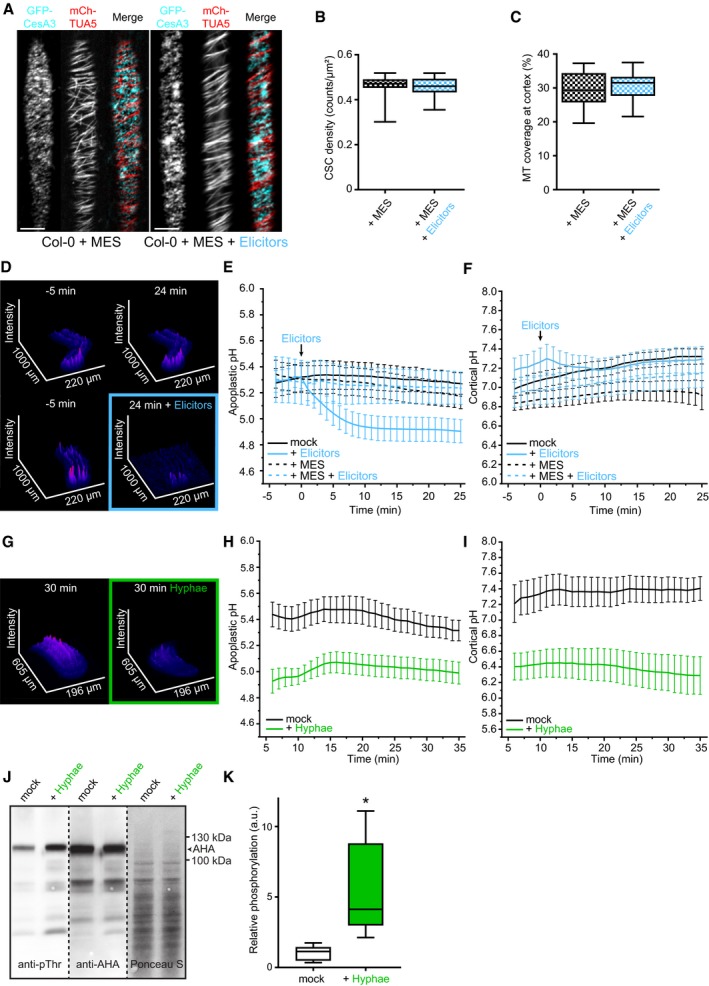
Representative image of a 5‐day‐old WT (Col‐0) GFP‐CesA3 and mCh‐TUA5 dual‐labeled root epidermal cell in half MS + 5 mM MES (left panel) or upon 5‐min elicitor treatment in half MS + 5 mM MES (right panel). Scale bar = 5 μm.
GFP‐CesA3 density at the plasma membrane after elicitor treatment in half MS + 5 mM MES as depicted in (A). Box plots: centerlines show the medians; box limits indicate the 25th and 75th percentiles; whiskers extend to the minimum and maximum. N ≥ 35 cells from 10 roots and three independent experiments.
Microtubule density at the cell cortex after elicitor treatment in half MS + 5 mM MES as depicted in (A). Box plots as described in (B). N ≥ 29 cells from 10 roots and three independent experiments.
Representative surface plot of a WT root expressing the pHapo sensor SYP122‐pHusion grown in half MS (−5 to 0 min). At 0 min, either H2O (upper panel) or an elicitor mix (lower panel) was added. Upon elicitor treatment, the signal intensity in the depicted 488 nm channel drastically decreases (highlighted with a blue square).
Apoplastic pH in WT roots expressing the pHapo sensor SYP122‐pHusion over time, either in half MS or in half MS + 5 mM MES. Imaging started 5 min before either H2O or a fungal elicitor mix was added (0 min). Values are mean ± SEM, N ≥ 15 seedlings from three independent experiments. RM two‐way ANOVA on half MS + H2O versus half MS + elicitors: P ≤ 0.05 (treatment), P ≤ 0.001 (time), P ≤ 0.001 (treatment × time).
Cortical pH of WT roots expressing the pHcortical sensor pHGFP‐Lti6b over time, either in half MS or in half MS + 5 mM MES. Imaging started 5 min before either H2O or a fungal elicitor mix was added (0 min). Values are mean ± SEM, N = 16 seedlings from three independent experiments. Mixed‐effects model on half MS + H2O versus half MS + elicitors: P = 0.80 (treatment), P ≤ 0.001 (time), P ≤ 0.001 (treatment × time).
Representative surface plot of WT root expressing the pHapo sensor SYP122‐pHusion grown 30 min in half MS (left panel) or half MS + Fo5176 hyphae (right panel). The hyphae treated root shows drastically reduced signal intensity in the depicted 488 nm channel (highlighted with a green square).
Apoplastic pH of WT roots expressing the pHapo sensor SYP122‐pHusion over time, either in half MS or half MS + Fo5176 hyphae. Roots were exposed to hyphae for 5 min before imaging started. Values are mean ± SEM, N ≥ 12 seedlings from three independent experiments. RM two‐way ANOVA on half MS versus half MS + elicitors: P ≤ 0.01 (treatment), P ≤ 0.001 (time), P ≤ 0.001 (treatment × time).
Cortical pH variation of WT roots expressing the pHcortical sensor pHGFP‐Lti6b over time, either in half MS or in half MS + Fo5176 hyphae. Roots were exposed to hyphae for 5 min before imaging started. Values are mean ± SEM, N ≥ 13 seedlings from three independent experiments. RM two‐way ANOVA on half MS versus half MS + elicitors: P ≤ 0.01 (treatment), P = 0.23 (time), P ≤ 0.001 (treatment × time).
Western blots showing chemiluminescent signals of an anti‐pThr or anti‐AHA incubated membrane loaded with Arabidopsis root samples treated for 8 min with either half MS or half MS + Fo5176 hyphae. The Ponceau S panel shows total protein content. The AHA band used for quantification is indicated with an arrowhead. Dashed line separates different treatments of the same membrane.
Relative AHA phosphorylation status from Western blots as shown in (J). Normalized signal intensity ratio of anti‐pThr in respect to anti‐AHA is shown. Box plots as described in (B). N = 5 independent experiments. Welch's unpaired t‐test; *P‐value ≤ 0.05.
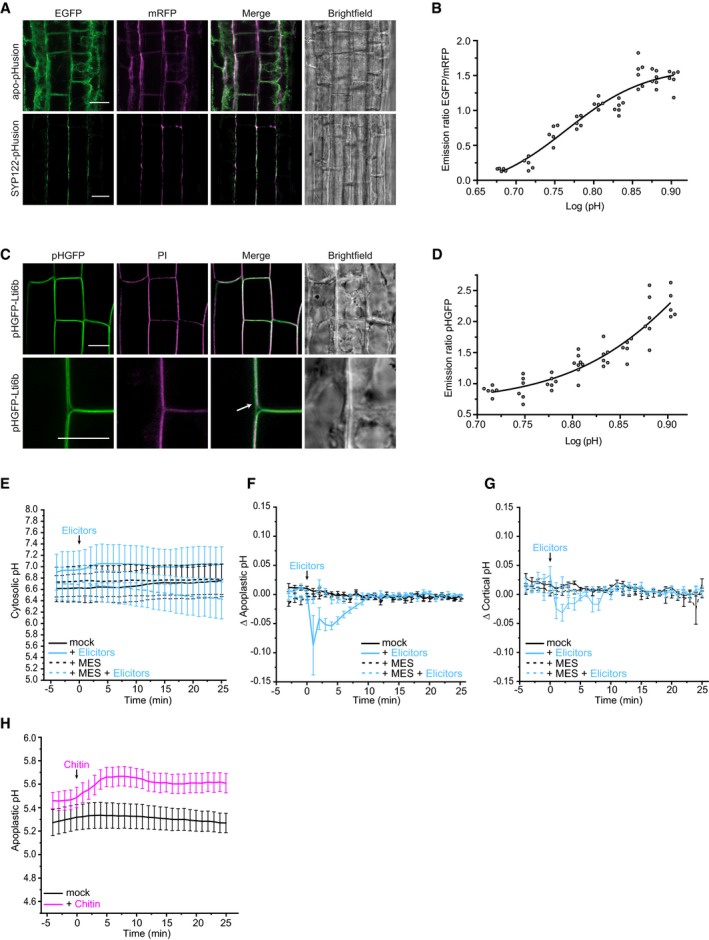
Representative images of 6‐day‐old WT (Col‐0) root epidermal and cortex cells expressing apo‐pHusion or SYP122‐phusion. Much less intracellular signal of pHusion is observed for SYP122‐pHusion than for apo‐pHusion. Scale bar = 20 μm.
In vivo calibration of SYP122‐pHusion in 6‐day‐old roots. Dots represent individual samples with N ≥ 5 seedlings per standard buffer. Data points were fitted using sigmoidal regression.
Representative images of 6‐day‐old WT (Col‐0) root epidermal and cortex cells expressing pHGFP‐Lti6b. Cell walls of seedlings were counterstained with 3 μg/ml propidium iodide to illustrate plasma membrane localization of pHGFP‐Lti6b of two adjacent cells (white arrow). Scale bars = 10 μm.
In vivo calibration of pHGFP‐Lti6b in 6‐day‐old roots. Dots represent individual samples with N ≥ 5 seedlings per standard buffer. Data points were fitted using sigmoidal regression.
Cytoplasmic pH variation of WT roots expressing the pHcyto free pHGFP sensor over time, either in half MS or in half MS + 5 mM MES. Imaging started 5 min before either H2O or a fungal elicitor mix was added (0 min). Values are mean ± SEM, N ≥ 12 seedlings from three independent experiments. RM two‐way ANOVA on half MS + H2O versus half MS + elicitors: P = 0.42 (treatment), P = 0.06 (time), P = 0.08 (treatment × time).
Apoplastic ∆pH of WT roots expressing the pHapo SYP122‐pHusion sensor over time, either in half MS or in half MS + 5 mM MES. Imaging started 5 min before either H2O or a fungal elicitors were added (0 min). Values are mean ± SEM, N ≥ 16 seedlings from three independent experiments. RM two‐way ANOVA on half MS + H2O versus half MS + elicitors: P ≤ 0.001 (treatment), P ≤ 0.05 (time), P ≤ 0.001 (treatment × time).
Cortical ∆pH of WT roots expressing the pHcortical pHGFP‐Lti6b sensor over time, either in half MS or in half MS + 5 mM MES. Imaging started 5 min before either H2O or a fungal elicitor mix was added (0 min). Mixed‐effects model on half MS + H2O versus half MS + elicitors: P ≤ 0.01 (treatment), P ≤ 0.001 (time), P ≤ 0.001 (treatment × time).
Apoplastic pH of WT roots expressing the pHapo SYP122‐pHusion sensor over time in half MS. Imaging started 5 min before either H2O (mock) or 1 mM chitin were added (0 min). Values are mean ± SEM, N = 15 seedlings from three independent experiments. RM two‐way ANOVA on half MS + H2O versus half MS + chitin: P ≤ 0.05 (treatment), P ≤ 0.001 (time), P ≤ 0.001 (treatment × time). This chitin assay was done simultaneously to the elicitor treatments (Fig 2E); therefore, they share the same mock (H2O) curve.
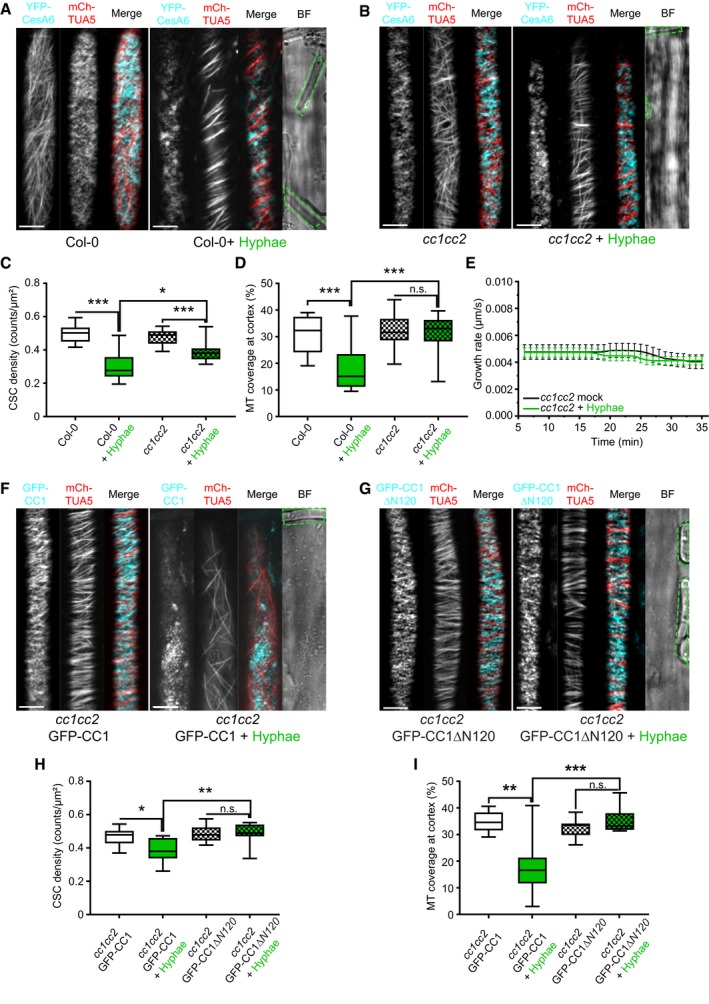
Representative image of a 5‐day‐old WT (Col‐0) YFP‐CesA6 and mCh‐TUA5 dual‐labeled root epidermal cell under mock conditions (left panel) or upon 5 min of Fo5176 hyphae contact (right panel). A green dashed line in the bright field (BF) channel highlights Fo5176 hyphae. Scale bar = 5 μm.
Representative image of a 5‐day‐old cc1cc2 YFP‐CesA6 and mCh‐TUA5 dual‐labeled root epidermal cell under mock conditions (left panel) or upon 5 min of Fo5176 hyphae contact (right panel). A green dashed line in the BF channel highlights Fo5176 hyphae. Scale bar = 5 μm.
YFP‐CesA6 density at the plasma membrane of WT (Col‐0) or cc1cc2 root cells after Fo5176 hyphae contact as depicted in (A and B). Box plots: centerlines show the medians; box limits indicate the 25th and 75th percentiles; whiskers extend to the minimum and maximum. N ≥ 21 cells from 10 roots and three independent experiments; Welch's unpaired t‐test; *P‐value ≤ 0.05, ***P‐value ≤ 0.001.
Microtubule density at the cell cortex of WT (Col‐0) or cc1cc2 root cells after Fo5176 hyphae contact as depicted in (A and B). Box plots as described in (C). N ≥ 24 cells from 9 roots and three independent experiments; Welch's unpaired t‐test; ***P‐value ≤ 0.001.
Growth rate of cc1cc2 roots grown in half MS or half MS + Fo5176 hyphae. Average growth rate in half MS: 0.0046 ± 0.0005 μm/s; average growth rate in half MS + Fo5176 hyphae: 0.0045 ± 0.0003 μm/s. Values are mean ± SEM, N = 17 seedlings from three independent experiments. Welch's unpaired t‐test; P‐value = 0.78.
Representative image of a 5‐day‐old cc1cc2 GFP‐CC1 and mCh‐TUA5 dual‐labeled root epidermal cell under mock conditions (left panel) or upon 5 min of Fo5176 hyphae contact (right panel). A green dashed line in the BF channel highlights Fo5176 hypha. Scale bar = 5 μm.
Representative image of a 5‐day‐old cc1cc2 GFP‐CC1ΔN120 and mCh‐TUA5 dual‐labeled root epidermal cell under mock conditions (left panel) or upon 5 min of Fo5176 hyphae contact (right panel). A green dashed line in the BF channel highlights Fo5176 hypha. Scale bar = 5 μm.
GFP‐CC1 or GFP‐CC1ΔN120 density (as proxy for the CSC) at the plasma membrane of cc1cc2 root cells after Fo5176 hyphae contact as depicted in (F and G). Box plots as described in (C). N ≥ 22 cells from 8 roots and three independent experiments; Welch's unpaired t‐test; *P‐value ≤ 0.05, **P‐value ≤ 0.01.
Microtubule density at the cell cortex of cc1cc2 GFP‐CC1 or cc1cc2 GFP‐CC1ΔN120 root cells after Fo5176 hyphae contact as depicted in (F and G). Box plots as described in (C). N ≥ 24 cells from 7 roots and three independent experiments; Welch's unpaired t‐test; **P‐value ≤ 0.01, ***P‐value ≤ 0.001, n.s. = not significant.
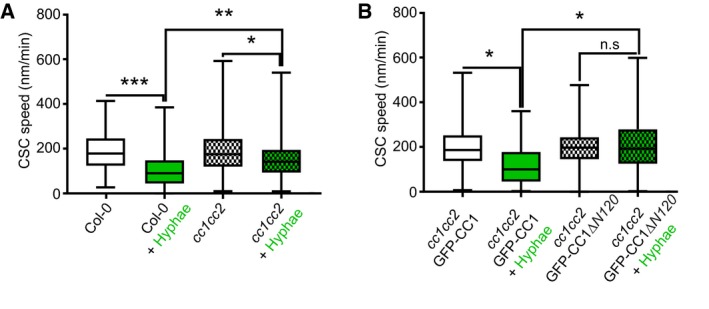
CSC speed at the plasma membrane of WT (Col‐0) and cc1cc2 root cells, as depicted in Fig 3A and B, upon Fo5176 hyphae contact. Box plots: centerlines show the medians; box limits indicate the 25th and 75th percentiles; whiskers extend to the minimum and maximum. N ≥ 270 particles from 8 cells and 7 roots and three independent experiments; Welch's unpaired t‐test; *P‐value ≤ 0.05, **P‐value ≤ 0.01, ***P‐value ≤ 0.001.
GFP‐CC1 and GFP‐CC1ΔN120 speed (as proxy for the CSC) at the plasma membrane of cc1cc2 root cells upon Fo5176 hyphae contact, as depicted in Fig 3F and G. Box plots as described in (A). N ≥ 288 particles from 12 cells and 7 roots and three independent experiments; Welch's unpaired t‐test; *P‐value ≤ 0.05, n.s. = not significant.
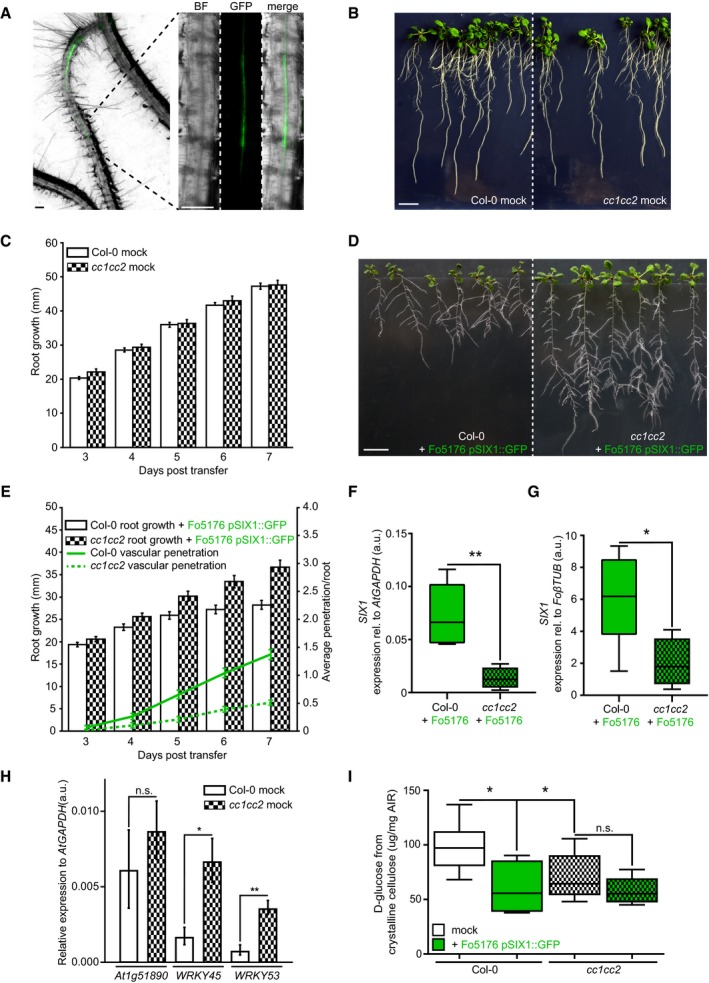
Arabidopsis root vasculature colonized by Fo5176 pSIX1::GFP. Right panel shows a magnification separated into brightfield (BF) and GFP channel. GFP fluorescence is apparent when Fo5176 colonized the vasculature (dark gray, root central line in BF channel). Scale bars = 125 μm.
Representative image of WT (Col‐0) and cc1cc2 plants 7 days post‐transfer to half MS mock plates. Scale bar = 10 mm.
Root elongation of WT (Col‐0) and cc1cc2 plants at various days post‐transfer to mock plates, as depicted in (B). Values are mean ± SEM, N ≥ 103 plants from three independent experiments. RM two‐way ANOVA: P = 0.65 (genotype), P ≤ 0.001 (time), P = 0.33 (genotype × time).
Representative image of WT (Col‐0) and cc1cc2 plants 7 days post‐transfer to Fo5176 pSIX1::GFP spore containing plates. Scale bar = 10 mm.
Root elongation and vascular penetration of WT (Col‐0) and cc1cc2 mutant plants at various days post‐transfer to Fo5176 pSIX1::GFP spore containing plates, as depicted in (D). Values are mean ± SEM, N ≥ 103 plants from three independent experiments. RM two‐way ANOVA on root growth: P ≤ 0.001 (genotype), P ≤ 0.001 (time), P ≤ 0.01 (genotype × time). RM two‐way ANOVA on vascular penetration rate: P ≤ 0.01 (genotype), P ≤ 0.001 (time), P ≤ 0.001 (genotype × time).
SIX1 expression relative to AtGAPDH in WT (Col‐0) or cc1cc2 roots 7 days post‐inoculation with Fo5176 spores. Box plots: centerlines show the medians; box limits indicate the 25th and 75th percentiles; whiskers extend to the minimum and maximum. N ≥ 4 biological replicates; Welch's unpaired t‐test; **P‐value ≤ 0.01.
SIX1 expression relative to FoβTUB in WT (Col‐0) or cc1cc2 roots 7 days post‐inoculation with Fo5176. Box plots as described in (F). N ≥ 4 biological replicates; Welch's unpaired t‐test; *P‐value ≤ 0.05.
Expression of At1g51890, WRKY45, and WRKY53 relative to AtGAPDH in WT (Col‐0) and cc1cc2 roots under mock conditions. Values are mean ± SEM, N ≥ 4 biological replicates; Welch's unpaired t‐test; *P‐value ≤ 0.05. **P value ≤ 0.01.
Cellulose content of roots grown as depicted in (B and D), represented as μg of D‐glucose derived from crystalline cellulose per mg of dried alcohol‐insoluble residue (AIR). Box plots as described in (F). N ≥ 5 biological replicates; 2 technical replicates per biological replicate. Welch's unpaired t‐test; *P‐value ≤ 0.05, n.s. = not significant.
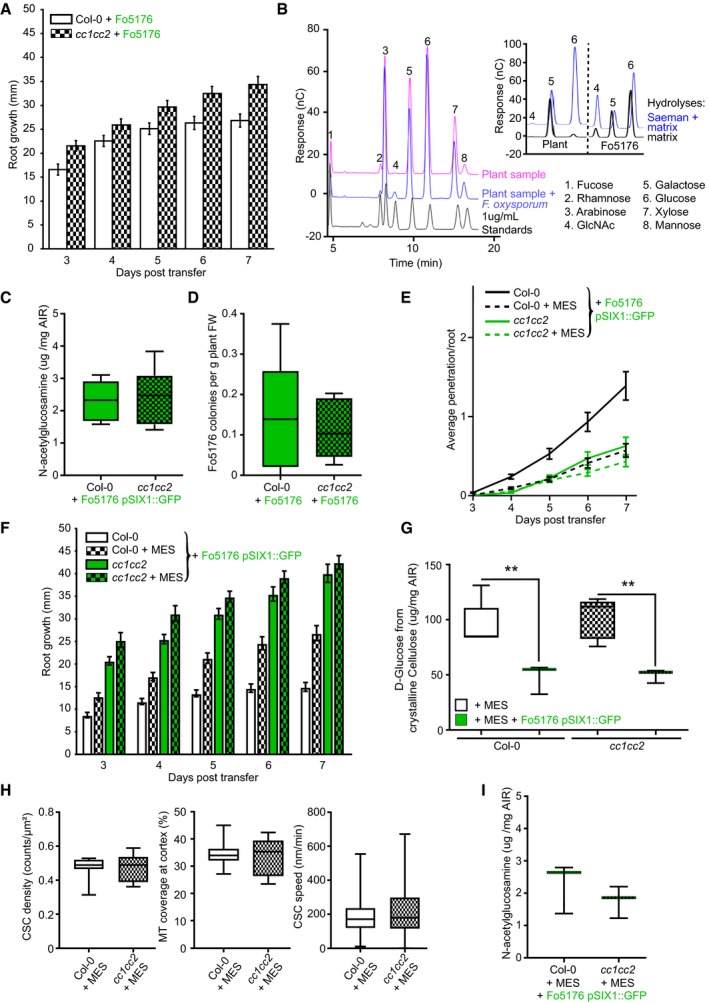
Root elongation at various days post‐transfer to Fo5176 spore containing plates. Values are mean ± SEM, N ≥ 33 plants from three independent experiments. RM two‐way ANOVA: P ≤ 0.01 (genotype), P ≤ 0.001 (time), P ≤ 0.05 (genotype × time).
Left panel: Monosaccharide elution profile of a 1 μg/ml standard (black) compared to 1:10 dilutions of hydrolyzed samples (Saeman hydrolysis, as indicated in methods section) derived from roots after 7 days of either mock (pink) or Fo5176 treatment (blue). The N‐acetylglucosamine (GlcNAc) peak (4) is only identifiable in hydrolyzed infected samples (blue). Right panel: Strong and weak hydrolyses of fungal‐derived cell wall material indicate negligible presence of glucose non‐extractable with the matrix hydrolysis method, as the glucose peak is similar in either hydrolysis method. In plants, there is a clear difference between the glucose peaks in either hydrolysis method.
Quantification of the N‐acetylglucosamine peak of Fo5176 pSix1::GFP‐infected roots derived from the fungal cell wall as shown in (B). Box plots: centerlines show the medians; box limits indicate the 25th and 75th percentiles; whiskers extend to the minimum and maximum. N ≥ 5 biological replicates; Welch's unpaired t‐test; P = 0.34.
Quantification of Fo5176 colonies developing after surface sterilization of infected roots. Box plots as described in (C). N = 5 biological replicates; Welch's unpaired t‐test; P = 0.75.
Vascular penetration of WT (Col‐0) and cc1cc2 plants at various days post‐inoculation with Fo5176 pSIX1::GFP spores with or without 5 mM MES. Values are mean ± SEM, N ≥ 33 plants from three independent experiments. RM two‐way ANOVA (Col‐0 half MS versus Col‐0 half ME + MES): P ≤ 0.001 (genotype), P ≤ 0.001 (time), P ≤ 0.001 (genotype × time).
Root elongation of WT (Col‐0) and cc1cc2 plants at various days post‐inoculation with Fo5176 pSIX1::GFP spores with or without 5 mM MES. Values are mean ± SEM, N ≥ 33 plants from three independent experiments. RM two‐way ANOVA (Col‐0 half MS versus Col‐0 half MS + MES): P ≤ 0.001 (genotype), P ≤ 0.001 (time), P ≤ 0.001 (genotype × time).
Cellulose content of roots 7 days post‐transfer to Fo5176 pSIX1::GFP spore containing half MS + 5 mM MES plates or post‐transfer to control (half MS +5 mM MES) plates, represented as μg of D‐glucose derived from crystalline cellulose per mg of dried alcohol‐insoluble residue (AIR). Box plots as described in (C). N ≥ 5 biological replicates; 2 technical replicates per biological replicate. Welch's unpaired t‐test; **P‐value ≤ 0.01.
CSC (N ≥ 27 cells from 11 roots) and microtubule (N ≥ 17 cells from 7 roots) density and CSC speed (N ≥ 366 particles from 17 cells and 9 roots) at the plasma membrane of WT (Col‐0) or cc1cc2 root cells expressing YFP‐CesA6 and mCh‐TUA5 grown on half MS + 5 mM MES. Data are from three independent experiments. Box plots as described in (C). Welch's unpaired t‐test indicates no significant difference for all measurements.
Quantification of the N‐acetylglucosamine peak of Fo5176 infected plants grown on half MS + 5 mM MES derived from the fungal cell wall as shown in (B). Box plots as described in (C). N = 3 biological replicates; Welch's unpaired t‐test; P = 0.41.
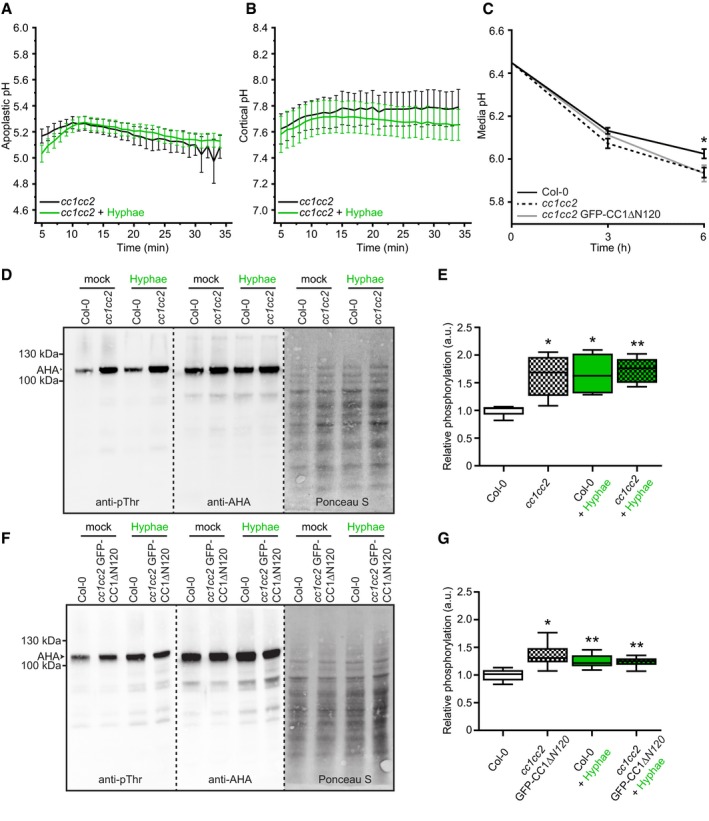
Apoplastic pH variation of cc1cc2 roots expressing the pHapo sensor SYP122‐pHusion over time, either in half MS or in half MS + Fo5176 hyphae. Values are mean ± SEM, N = 17 seedlings from three independent experiments. Welch's unpaired t‐test on total average pH; P‐value = 0.84.
Cortical pH variation of cc1cc2 roots expressing the pHcortical sensor pHGFP‐Lti6b over time, either in half MS or in half MS + Fo5176 hyphae. Values are mean ± SEM, N ≥ 12 seedlings from three independent experiments. Welch's unpaired t‐test on total average pH; P‐value = 0.67.
Media pH development over time when 10‐day‐old WT (Col‐0), cc1cc2, and cc1cc2 GFP‐CC1ΔN120 plants were transferred to a liquid, alkaline media (pH 6.45). Values are mean ± SEM, N ≥ 23 plants from three independent experiments. Welch's unpaired t‐test after 6 h; *P‐value ≤ 0.05.
Western blots showing chemiluminescent signals of anti‐pThr or anti‐AHA incubated membranes loaded with Arabidopsis WT (Col‐0) or cc1cc2 root samples. Roots were treated for 8 min with either half MS or half MS + Fo5176 pSIX1::GFP hyphae. The Ponceau S panel shows total protein content. The AHA band used for quantification is highlighted with an arrowhead. Dashed line separates different treatments of the same membrane.
Relative AHA phosphorylation status from Western blots as shown in (D). Normalized signal intensity ratio of anti‐pThr in respect to anti‐AHA is shown. Box plots: centerlines show the medians; box limits indicate the 25th and 75th percentiles; whiskers extend to the minimum and maximum. N = 5 independent experiments. Welch's unpaired t‐test in comparison with Col‐0 mock conditions; *P‐value ≤ 0.05, **P‐value ≤ 0.01.
Western blots showing chemiluminescent signals of anti‐pThr or anti‐AHA incubated membranes loaded with Arabidopsis WT (Col‐0) or cc1cc2 GFP‐CC1CC1ΔN120 root samples. Roots were treated for 8 min with either half MS or half MS + Fo5176 pSIX1::GFP hyphae. The Ponceau S panel shows total protein content. The AHA band used for quantification is highlighted with an arrowhead. Dashed line separates different treatments of the same membrane.
Relative AHA phosphorylation status from Western blots as shown in (F). Normalized signal intensity ratio of anti‐pThr in respect to anti‐AHA is shown. Box plots as described in (E). N = 6 independent experiments. Welch's unpaired t‐test in comparison with Col‐0 mock conditions; *P‐value ≤ 0.05, **P‐value ≤ 0.01.
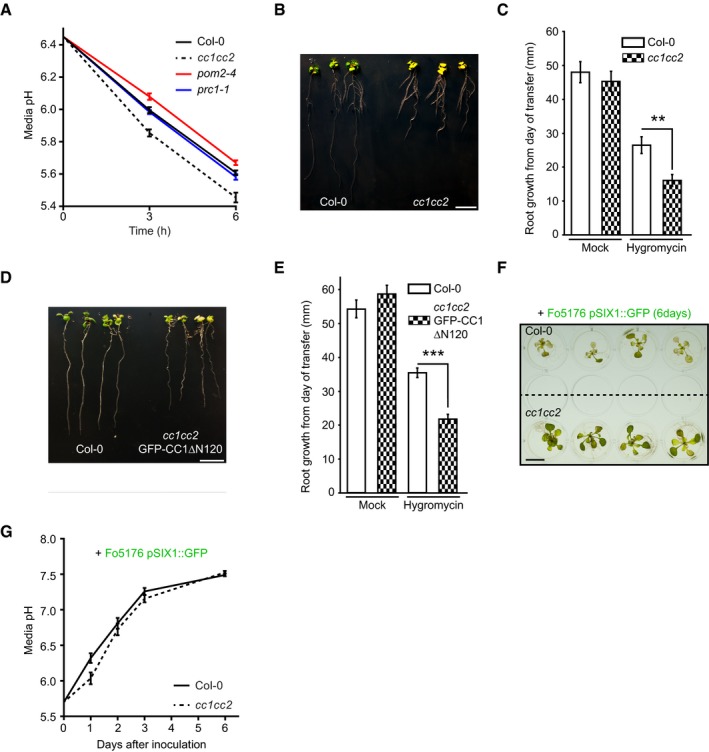
Media pH development over time when 10‐day‐old WT (Col‐0), cc1cc2, pom2‐4, and prc1‐1 plants were transferred to a liquid, alkaline media (pH 6.45). Values are mean ± SEM, N ≥ 17 plants from three independent experiments. Welch's unpaired t‐test versus Col‐0 at 6 h: cc1cc2 P‐value ≤ 0.001; pom2‐4 P‐value ≤ 0.01; prc1‐1 P‐value = 0.29.
Representative image of WT (Col‐0) and cc1cc2 plants 7 days post‐transfer to half MS + 5 μg/ml hygromycin B plates. Scale bar = 10 mm.
Root growth of plants grown as in (B). Values are mean ± SEM, N ≥ 15 plants from three independent experiments. Welch's unpaired t‐test; **P‐value ≤ 0.01.
Representative image of WT (Col‐0) and cc1cc2 GFP‐CC1ΔN120 plants 7 days post‐transfer to half MS + 5 μg/ml hygromycin B plates. Scale bar = 10 mm.
Root growth of plants grown as in (D). Values are mean ± SEM, N ≥ 16 plants from three independent experiments. Welch's unpaired t‐test; ***P‐value ≤ 0.001.
Representative image of WT (Col‐0) and cc1cc2 plants 7 days post‐inoculation with Fo5176 pSIX1::GFP spores in liquid half MS media. Scale bar = 10 mm.
Media pH development of an experiment as depicted in (F). Values are mean ± SEM, N = 36 plants from three independent experiments. RM two‐way ANOVA: P = 0.069 (genotype), P ≤ 0.001 (time), P ≤ 0.05 (genotype × time).
References
-
- Benschop JJ, Mohammed S, O'Flaherty M, Heck AJR, Slijper M, Menke FLH (2007) Quantitative phosphoproteomics of early elicitor signaling in Arabidopsis . Mol Cell Proteomics 6: 1198–1214 - PubMed
Publication types
MeSH terms
Substances
Grants and funding
- Peter und Traudl Engelhorn-Stiftung/International
- SNF 31003A_163065/1/Swiss National Foundation/International
- 0-20172-16/ETHZ Foundation/International
- 2-72160-16/Heinz Imhof Foundation/International
- 15H05956/Grants-in-Aid for Scientific Research from the Ministry of Education, Culture, Sports, Science, and Technology, Japan/International
LinkOut - more resources
Full Text Sources
Other Literature Sources
Research Materials
